SlideShare a Scribd company logo
1 of 104
Download to read offline
1
The Financial, Economic, Social,
and Political Impact of Quantitative
Easing in the United States
Client: The Markets Room, United States Department of the Treasury
Faculty Advisor: Seamus O'Cleireacain
James Cashman
John Olderman
Yiling Pan
Maxime Terrieux
Audrey Yu
David Zhang
Shahnoza Zhumanova
May 2016
School of International and Public Affairs | SIPA
Columbia University in the City of New York
2
ACKNOWLEDGEMENTS
This report represents the collective efforts of a team of graduate students at Columbia University's
School of International and Public Affairs. Our Capstone assignment—to partner with the Markets Room
at The United States Department of the Treasury in an examination of the financial, economic, social and
political impacts of quantitative easing—has proved to be an unparalleled learning experience for us.
Of course, none of this would have been possible without the Markets Room. We are especially grateful
to John Fagan and Albert Lee for designing the terms of reference for this fascinating project and for
generously sharing their time, experience and insight with us as we embarked on this unique academic
odyssey. Similarly, the resultant research would have been far less rich without the contributions of the
many distinguished scholars and industry experts who graciously agreed to be interviewed by the Team
for this project, along with the technical expertise of Alexandre Goncalves, PhD candidate, who assisted
with our data analysis.
Finally, we are indebted to the leadership of Professor Seamus O'Cleireacain, our avuncular faculty
advisor. Professor O'Cleireacain served as the ideal moderator for regular team debates on this
controversial subject. His profound technical expertise and abundant reservoir of patience were much
needed and often tested!
In the end, any errors or oversights appearing in the final report belong to the Capstone team and the
Capstone team alone. Happy reading!
3
TABLE OF CONTENTS
ACKNOWLEDGEMENTS ........................................................................................................................... 2
TABLE OF CONTENTS .............................................................................................................................. 3
EXECUTIVE SUMMARY ............................................................................................................................. 5
1. INTRODUCTION...................................................................................................................................... 6
1.1. Monetary Policymaking in an Era of Quantitative Easing ............................................................................. 6
1.2. Capstone Project Focus, Methodology, and Outline ................................................................................... 10
2. FINANCIAL MARKETS IMPACT ANALYSIS....................................................................................... 12
2.1. QE’s Success: Reducing Long-Term Rates.................................................................................................. 12
2.2. QE’s Unintended Consequences: Six Areas of Concern ............................................................................ 13
2.2.1. Asset Market Dependence on Monetary Policy.......................................................................................... 14
2.2.2. Diminishing Returns to QE Due to Lack of Policymaker Coordination........................................................ 14
2.2.3. Illiquidity in Key Financial Markets.............................................................................................................. 16
2.2.4. Systemic Risk ............................................................................................................................................. 17
2.2.5. International effects..................................................................................................................................... 20
2.2.6. Risks of Unwinding ..................................................................................................................................... 22
2.3. Conclusion: QE and the Financial Markets, a Mixed Success.................................................................... 22
3. REAL ECONOMY IMPACT ANALYSIS................................................................................................ 23
3.1. Consumption.................................................................................................................................................... 23
3.1.1. Expected Results and Transmission Mechanisms ..................................................................................... 23
3.1.2. Observed Outcomes................................................................................................................................... 23
(i) Consumer Credit: Improved Availability and Conditions .................................................................................................... 23
(ii) Impact on Consumer Confidence ...................................................................................................................................... 25
(iii) Overall: Steady, Solid Consumption Recovery ................................................................................................................. 25
3.2. Investment........................................................................................................................................................ 26
3.2.1. Expected Results and Transmission Mechanisms ..................................................................................... 26
3.2.2. Observed Outcomes................................................................................................................................... 26
(i) Financial Conditions for SMEs ........................................................................................................................................... 26
(ii) Impact on Investor Confidence.......................................................................................................................................... 28
(iii) Overall: Partial Investment Recovery................................................................................................................................ 28
3.3. Government Spending .................................................................................................................................... 28
3.3.1. Expected Results and Transmission Mechanisms ..................................................................................... 28
3.3.2. Observed Outcomes................................................................................................................................... 29
3.4. Net Exports....................................................................................................................................................... 31
3.4.1. Expected Results And Transmission Mechanisms..................................................................................... 31
3.4.2. Observed Outcomes................................................................................................................................... 32
3.5. Putting Things Together ................................................................................................................................. 33
3.5.1. Mixed to Positive Impact of QE on Aggregate Demand and Inflation ......................................................... 33
3.5.2. Mixed Recovery in the Labor Market: Any QE Effect?................................................................................ 35
(i) Unemployment ................................................................................................................................................................... 35
(ii) Wages................................................................................................................................................................................ 37
3.5.3. QE and the Real Economy: Unintended Consequences ............................................................................ 39
4. SOCIAL IMPACT ANALYSIS ............................................................................................................... 40
4.1. Assessing Inequality....................................................................................................................................... 40
4.2. Trends in Inequality......................................................................................................................................... 41
4.2.1. Income Inequality........................................................................................................................................ 41
4.2.2. Wealth Inequality ........................................................................................................................................ 43
4
4.2.3. Wealth and Racial/Ethnic Inequality ........................................................................................................... 44
4.2.4. Debt and Consumption Across America..................................................................................................... 44
4.3. Transmission Mechanisms............................................................................................................................. 45
4.3.1. The Conventional Channels........................................................................................................................ 45
4.3.2. Transmission Mechanisms Impaired by the Context .................................................................................. 47
4.4. Literature Review and Interview Findings .................................................................................................... 47
4.4.1. Quantitative Easing Exacerbated Inequality in the United States............................................................... 47
4.4.2. Quantitative Easing Did Not Exacerbate Inequality .................................................................................... 49
4.4.3. Findings from Japan ................................................................................................................................... 51
4.4.4. Long-run Attitudinal and Behavioral Effects................................................................................................ 51
4.5. QE and Inequality: Conclusion and Further Considerations ...................................................................... 53
5. POLITICAL IMPACT ANALYSIS .......................................................................................................... 54
5.1. Politicization of the Fed .................................................................................................................................. 54
5.1.1. The Evolving Relationship Between Congress and the Fed....................................................................... 55
5.1.2. An Increasingly Politicized Presidential Appointment Process ................................................................... 56
5.1.3. A Merging of Monetary and Fiscal Policy.................................................................................................... 57
5.1.4. Social Feedback Loops: the Cause and Effect of the Fed Policy ............................................................... 59
5.2. The Effects of Unconventional Monetary Policy on U.S. Domestic Politics.............................................. 59
5.2.1. Portfolio Rebalance Channel ...................................................................................................................... 59
5.2.2. The Interest Rate Channel.......................................................................................................................... 62
(i) Fiscal Policy........................................................................................................................................................................ 62
6. Conclusion and Topics for Further Consideration........................................................................... 65
6.1. QE in the United States: A Mixed Success ................................................................................................... 65
6.2. Other Concerns Moving Forward................................................................................................................... 67
6.2.1. International Spillover Effects and International Coordination .................................................................... 67
6.2.2. Impact on Pensions and Insurance............................................................................................................. 67
6.2.3. Should the Fed’s Mandate be Refined?...................................................................................................... 68
6.2.4. Was There an Alternative to QE? ............................................................................................................... 68
6.2.5. Risks of Unwinding ..................................................................................................................................... 69
6.3. Closing Remarks ............................................................................................................................................. 70
7. Appendix A: List of Interviewees ....................................................................................................... 71
8. Appendix B: Interview Takeaways (by Industry) .............................................................................. 73
9. Appendix 3: Interviews of Interest ..................................................................................................... 78
9.1. Interview with Professor Joseph Stiglitz....................................................................................................... 78
9.2. Interview with Professor Charles Calomiris ................................................................................................. 79
9.3. Interview with Former New York City Comptroller John Liu....................................................................... 80
10. Appendix D: Additional Figures ....................................................................................................... 81
10.1. Financial Markets Figures ............................................................................................................................ 81
10.2. Real Economy Figures.................................................................................................................................. 85
10.2.1. Consumption............................................................................................................................................. 85
10.2.2. Investment ................................................................................................................................................ 89
10.2.3. Government Spending .............................................................................................................................. 91
10.2.4. Net Exports ............................................................................................................................................... 93
10.2.5. The Labor Market...................................................................................................................................... 95
10.3. Social Impact Figures.................................................................................................................................... 97
Bibliography ............................................................................................................................................. 99
5
EXECUTIVE SUMMARY
In the wake of the Lehman Brothers collapse and the ensuing U.S. and global financial crisis, the world
economy was on the brink of a major depression. Having rapidly exhausted its conventional monetary
policy tools—as the short-term policy rate was already near zero—to stimulate the U.S. economy, the
Federal Reserve turned to unconventional monetary policy in the form of large scale asset purchases
(“LSAPs”), known as Quantitative Easing (“QE”). QE was intended to provide liquidity to frozen credit
markets, lower interest rates of various maturities to stimulate aggregate demand and signal to markets
that central bankers were taking decisive steps to avoid the mistakes which led to the Great Depression.
While a large body of literature has examined the effects of QE on financial markets, less is known on the
other intended and potentially unintended consequences of QE. After revisiting the effects of QE on
financial markets, this project will therefore aim to assess the broader economic, social and political
impacts of QE in the U.S. This paper will argue that:
• QE achieved its expected financial markets goal by restoring stability and lowering interest rates.
But in doing so, QE may have sown the seeds for future crises, with increased dependence of
financial markets on central bank intervention, illiquidity in certain markets, increased risk taking
in certain asset classes, and concerns about exit strategies;
• QE had mixed to positive effects on the real economy: GDP contraction was less severe than
what the country likely would have experienced in the absence of the policy, aggregate demand
was partially stimulated and the economy is now almost back at full employment. Despite this,
there remain concerns about structural issues, the lack of full recovery in some credit markets to
stimulate investment, and deflationary pressures;
• QE more than likely mitigated income inequality in the U.S. That assertion is not unanimously
held by those who have studied this question, and it is just as likely that QE exacerbated wealth
inequality and consumption inequality over the same period.
• QE has both contributed to a greater politicization of the Fed itself and affected the political
dynamics of domestic politics. In doing so, we offer evidence that the Fed’s pursuit of
unconventional monetary policy has diminished political support for the nation’s central banking
system, weakened the Fed’s credibility, and permanently altered underlying distinctions between
monetary and fiscal policy in the United States.
6
1. INTRODUCTION
1.1. Monetary Policymaking in an Era of Quantitative Easing
In the midst of the “Great Recession” of 2007-2009, and especially in the immediate aftermath
of the Lehman Brothers collapse in September 2008, the United States Federal Reserve (“The
Fed”) quickly found itself in unfamiliar and potentially dangerous territory. While the Board of
Governors of the Fed wished to pursue continued aggressive action to further stabilize financial
markets and combat the deflationary pressures of the emerging recession, its conventional
monetary policy instrument—targeting the Federal Funds Rate (“FFR”)—had approached the
so-called “zero lower bound” (“ZLB”).
Figure 1: The Effective Federal Funds Rate
Source: The Federal Reserve
Prior to the financial crisis, the Fed conducted monetary policy by establishing its policy rate—
the FFR—to be consistent with its dual mandate for price stability and full employment. The Fed
achieved its target by conducting open-market operations (“OMOs”) involving the purchase or
sale of short-term government securities through its primary dealer network. The purchase of
securities by the Fed adds to the supply of reserves in the system with a commensurate decline
in the effective policy rate while the sale of securities by the Fed reduces the supply of reserves
from the system thereby increasing the effective policy rate. In normal market conditions, the
Markets Group of the Federal Reserve Bank of New York which implements these OMOs on
behalf of the Federal Reserve Open Market Committee (“FOMC”) needs only to make “fine-
tuning” adjustments since the credibility of the Central Bank and the efficiency of the market for
Fed Funds means a new equilibrium rate is reached almost instantaneously following the
announcement of any FOMC policy adjustment.
7
In such an environment, monetary policy works its way through the financial markets to the real
economy through a series of channels as depicted in the below exhibit.
Figure 2: Monetary Transmission Mechanisms
Source: Kuttner & Mosser, 2002
But with the bursting of the real-estate bubble, its propagation to the rest of the economy, and
the associated pressure that this placed on the balance sheets of both borrowers and lenders,
the Fed found the usual transmission mechanisms for monetary policy to be severely impaired,
and its conventional policy tool apparently disabled. Since the FFR was now anchored at the
ZLB and traditional bank credit channels were in disarray, the Fed turned to a range of
unconventional monetary policies to unfreeze financial and credit markets and ultimately
stimulate the economy. Central to the bank’s new monetary policy approach was a program of
quantitative easing (“QE”) which the Fed engineered to inject liquidity and ultimately coax
lending through the purchase of large quantities of assets from commercial banks and other
investors. In some respects, QE can be viewed as merely an adaptation of conventional
monetary policy in an environment where the traditional channels for the dissemination of policy
have been impaired. Indeed, the Fed used QE as a way to conduct OMOs by focusing on the
long-end of the yield curve instead of the short-end. Fed economists theorized that through a
combination of portfolio balance and signaling channels, large-scale asset purchases (“LSAPs”)
would lower the rates that most directly influence commercial and household savings and
8
investment decisions. As a consensus emerged that the FFR should theoretically be
significantly negative, QE was intended to circumvent the ZLB at the short end by dramatically
flattening the yield curve. The exhibit below illustrates that “Taylor-rule” models for monetary
policy called for significantly negative policy rates beginning in 2008. But with uncertainty around
the efficacy of negative interest rates, the Fed needed to devise an alternative strategy to
produce further monetary policy accommodation. QE became the central element of that
strategy.
Figure 3: Taylor Rule Applications (Estimated Policy Rules for the Fed Funds Rate)
Source: economistsview.typepad.com/
In the United States, QE was implemented in multiple rounds and accompanied by forward guidance from
the Fed to instill marketplace confidence. QE 1 was intended to, “help improve conditions in private credit
markets.”
1
QE 2 was launched to “promote a stronger pace of economic recovery and to help ensure that
inflation, over time, [remained] at levels consistent with [the Fed’s] mandate.”
2
The short-lived Maturity
Extension Program known as “Operation Twist” was designed to drive down interest rates on longer-term
bonds. Finally, QE 3 aimed to “put downward pressure on longer-term interest rates, support mortgage
markets, and help to make broader financial conditions more accommodative.”
3
The successive rounds of
QE are detailed in the below timeline:
1
FOMC press release, March 18, 2009
2
FOMC press release, November 3, 2010
3
FOMC press release, September 13, 2012
9
Figure 4: QE Timeline
Source: Capital Economics
In total, successive rounds of LSAPs have caused the Fed’s balance sheet to grow exponentially. At the
time of this writing, the U.S. Central Bank continues to hold over $4 trillion in assets against its liabilities
which consist primarily of the aggregate monetary base. Despite initiating lift-off in December 2015 with a
modest hike in both the FFR and what has effectively become its new policy rate, the interest rate on
excess reserves (“IOER”), the Fed’s balance sheet looks to remain enormous for the foreseeable future.
4
Our paper seeks to explore these potential consequences and risks.
4
One consequence of QE for monetary policy is that since the supply of reserves is now so immense, “modest
changes in the supply of reserves will no longer have much influence on the federal funds rate. Rather than varying
the supply of reserves, the Fed now manages the federal funds rate by changing the rate of interest it pays on
reserves.” B. Bernanke and D. Kohn, “The Fed’s Interest Payments to Banks,” Brookings Institution, February 2016,
http://www.brookings.edu/blogs/ben-bernanke/posts/2016/02/16-fed-interest-payments-banks
10
Figure 5: The Fed’s Domestic Portfolio
Source: Federal Reserve
1.2. Capstone Project Focus, Methodology, and Outline
Given that the Fed remains far from exiting QE, it is difficult to definitively evaluate the efficiency and
efficacy of the program. Though it has become the modern policy instrument of choice in many advanced
economies following the Great Recession—the Bank of England followed the U.S. in 2009 and the
European Central Bank (“ECB”) launched its own QE program in 2015—quantitative easing remains a
largely experimental monetary policy tool. It was only first implemented from 2001 to 2006 by the Bank of
Japan (“BoJ”), which resorted to LSAPs to increase the balance sheets of Japanese commercial banks.
The novelty of the policy means that there are few longitudinal studies on the topic nor is there a
consensus in the academic literature on the models to use to assess its effects. Additionally, the post-
recessionary period in the U.S. includes a number of concurrent confounding factors (including secular
trends in inequality, skill-biased technological change, and fiscal policy interventions) that further
complicate the task of isolating the true effects of quantitative easing.
With that in mind, this Capstone Project attempts to evaluate the intended and potentially unintended
financial, economic, social, and political effects of the Fed’s unconventional monetary policy in the United
States since the onset of the Great Recession in late 2008. We consider the direction and magnitude of
the policy’s effects on various economic sectors and evaluate the costs and benefits associated with the
policy by relying on (i) academic and marketplace literature identifying conventional and unconventional
monetary transmission channels and (ii) insights sourced from interviews with both academics and
various sector stakeholders (see list of interviewees in Appendix 1).
We begin by examining the impact of each round of QE on the financial markets with an assessment of
the size and composition of Federal Reserve asset holdings, asset market and exchange rate trends, as
11
well as inflation expectations. We then define and evaluate transmission mechanisms from the financial
sector into the real economy and assess the short-to-medium-term effects of QE on a range of
macroeconomic aggregates (including GDP and its main components, inflation, the unemployment rate
and wages). Next, the paper draws on its real economy findings to inform an analysis of the social effects
of QE identifying transmission mechanisms from the literature and then extending them to consider
distributive consequences and “winners” vs. “losers” between various groups (e.g. old vs. young,
borrowers vs. savers, wealthy vs. middle-class vs. poor). Evidence of QE’s social impact, such that it
exists, is derived largely via an exhaustive literature review of both theoretical and econometric papers
and discussions with academics. Additionally, we evaluate the political impact of QE with a focus on
interactions between forward guidance, media messaging, and measures of confidence and uncertainty
held by the population at large. This segment of the report features the strategic inclusion of QE
discussions in political campaigning as well as QE’s potential impact on government spending. Finally, we
consider the role of domestic QE policy and the prospect of unwinding in the context of the global political
economy.
12
2. FINANCIAL MARKETS IMPACT ANALYSIS
2.1. QE’s Success: Reducing Long-Term Rates
Perhaps the best-documented aspect of QE has been the impact of the policy on financial markets. Since
LSAPs were intended to stimulate aggregate demand in the domestic real economy by using financial
markets as a conduit, the analysis of these markets serves as a springboard towards an examination of
QE’s impact on the real economy as well as its social and political impacts. Former Fed Chairman Ben
Bernanke has famously described QE as a monetary policy tool that “works in practice but…doesn’t work
in theory.”
5
Our research identifies as a consensus opinion the view that QE did indeed reduce long-term
interest rates most likely through a portfolio rebalance channel coupled with signaling effects. That said,
given the immense size of the LSAPs the reduction in rates appears quite modest and with diminishing
results upon each successive round of the program.
Figure 6: Cumulative Effects of Bond Purchases on 10 Year Government Yields
Source: IMF
In addition, the range of emergency facilities created by the Fed to support financial markets at the peak
of the panic undeniably played a vital role in restoring some sense of normalcy to what otherwise may
have devolved into a prolonged global run on the markets. This effect can be seen in venue after venue,
most notably in the market for commercial paper on which many U.S. companies rely for funding ongoing
operations. The restoration of stability to this key market following Fed intervention has been one of the
clearest successes of U.S. central bank policy in the crisis era.
5
Bernanke’s tongue-in-cheek remark was made during a Brookings Institution interview on January 16, 2014
13
Figure 7: Commercial Paper vs. T-Bill Risk Spread
Source: Federal Reserve
2.2. QE’s Unintended Consequences: Six Areas of Concern
While QE appears to have achieved its proximate target to reduce long-term interest rates, the policy has
certainly not been without cost. Our research on the financial market impact of QE focuses on the
potential for unconventional monetary policy to generate collateral damage. To that end, we highlight six
concerns regarding QE in this area:
1. Asset Market Dependence on Monetary Policy
2. Diminishing Returns to QE Due to Lack of Policymaker Coordination
3. Illiquidity in Key Financial Markets
4. Systemic risks
5. International effects
6. Unwind risks
For example, while the wealth effect of financial market price appreciation was designed by the Fed to
boost the larger economy, it may also have induced higher market cross-correlation and systemic risk.
Some of these unintended consequences may have been mitigated had the Fed coordinated more closely
with other regulatory, fiscal, and international policy makers. We address these six concerns in the
following sub-sections.
14
2.2.1. Asset Market Dependence on Monetary Policy
One of the key features of the successive rounds of QE is the notably strong correlation between the size
of the central bank’s balance sheet and asset prices as epitomized in the below chart.
Figure 8: The S&P 500 and Federal Reserve Intervention
Source: Advisor Perspectives
What on the surface looks to be a prolonged U.S. stock market recovery appears, upon closer inspection,
to have been built on an unstable foundation as equity rallies failed to persist between rounds of QE.
Similarly, although yields clearly move lower over the life of QE, long-term rates dropped more in between
rounds of QE (for example during the summers of 2010 and 2011) than across the respective QE periods.
Finally, the ability of QE to reduce yields after QE1 appears generally diminished, and the rise in rates at
the conclusion of each round of LSAPs exceeded the declines witnessed at the outset of each respective
round.
2.2.2. Diminishing Returns to QE Due to Lack of Policymaker Coordination
Another explanation for the diminishing returns achieved by QE2 and QE3 is the Treasury’s increased
issuance of longer-term debt since 2008. As shown by Harvard University researchers,
6
more than a
6
R.Greenwood, S. Hanson, J. Rudolph and L. Summers, “Government Debt Management at the Zero Lower Bound,”
Hutchins Center on Fiscal and Monetary Policy, September 2014
15
third of the long-term rate impact appears to have been negated by long-term debt issuance on the part of
the Treasury. The argument for such competing policies, of course, is that prudent debt management
calls for locking in cheap financing during periods of historically low interest rates. Nevertheless, the
monetary policy objectives of the Fed and the financing objectives of the Treasury have sometimes
clearly run at odds since the onset of the crisis.
Figure 9: Contradictory Fed and Treasury Policy Effects
Source: Brookings Institution
16
2.2.3. Illiquidity in Key Financial Markets
Since 2008, financial market liquidity, particularly as measured by dealer inventories, appears to have
dried up in certain key credit markets. This can be attributed to a combination of effects. First, the Fed’s
LSAPs have depleted the availability of Treasuries and Agency Mortgages that typically make up repo
market collateral. Secondly, the Fed’s regulatory capital policy under Dodd-Frank,
7
created in part to
prevent future bubbles, has significantly constrained broker-dealer balance sheets and their ability to
intermediate capital markets.
Figure 10: Dealer Repo Financing
Source: Federal Reserve
Furthermore, ultra-low interest rates may have spurred significant shadow banking growth.
8
As a prime
example, high-yield markets in the energy sector initially benefitted substantially from cheap debt but
have suffered immensely when the 10-year old commodity super-cycle came to a screeching halt in 2015.
Despite the best intentions of Dodd-Frank legislation, shadow banking has remained relatively unscathed
from regulatory policy as seen in the growing credit provided by non-banks post-2008. However, the Fed
and the SEC appear to be catching up on liquidity risks of mutual funds
9
(through “swing pricing”), high
7
R. Anderson, M. Bordo and J. Duca, “Money and Velocity During Financial Crisis: From the Great Depression to the
Great Recession,” National Bureau of Economic Research, March 2016
8
N.Valckx, “Shadow Banking Around the Globe: How Large, and How Risky,” International Monetary Fund, October
2014
9
“SEC Proposes Liquidity Management Rules For Mutual Funds And ETFs,” U.S. Securities And Exchange
Commission, September 2015
17
yield bond markets (as underscored by the closing of Third Avenue’s credit fund in December 2015), and
high-speed trading in treasury markets.
10
Figure 11: The Importance of Shadow Banking
Source: Financial Stability Board
2.2.4. Systemic Risk
While more liquid than corporate bond markets, equity markets are also showing signs of overheating as
measured by average long-term cyclically adjusted PE (“CAPE”) ratios. For example, Nobel Laureate
Robert Shiller’s CAPE suggests that U.S. equity markets are trading at a substantial premium to what
might be considered “fair value.” In a similar spirit, one market participant with whom we spoke
highlighted a divergence between “quality” as measured by an equity factor index and the broader stock
market. While quality outperformed dramatically in the period leading up to the financial crisis, the reverse
has been true ever since—perhaps a signal that markets are currently driven only by the direction of Fed
policy as opposed to macroeconomic fundamentals.
10
L. Brainard, “An Update on the Outlook, Liquidity, and Resilience,” speech held at the Institute of International
Bankers Annual Washington Conference, Washington, D.C., March 2016
18
Figure 12: Trends in the Quality of Equity Indexes
Source: Bloomberg Finance LP, in “Epsilon Theory”, Salient Partners, April 2016
19
Like the stock market declines which occurred in the middle of 2010 and 2011, systemic risk in the U.S.
financial system (measured by the Cleveland Financial Stress Index) has also periodically peaked in
between rounds of QE, as illustrated below:
Figure 13: Cleveland Financial Stress Index
Source: Federal Reserve Bank of St. Louis (2015)
Similarly, financial sector capital shortfall risk (the amount that financials would need to cover risk-
weighted assets under financial sector-wide stress according to NYU VLAB) spiked each of the three
times that a QE round ended. This can be seen in the index levels during the summers of 2010 and 2011,
as well as the end of 2014. As an indication of the risks which may await the Fed as it moves towards
interest rate normalization, the measure peaked once again following the Fed’s 2015 rate increase.
Figure 14: U.S. Total Financial Systemic Risk (SRISK—US$ Billion)
Source: New York University, V-Lab (2016)
20
Furthermore, average cross-asset correlation has increased by two thirds as seen by IMF
11
research
below. The benefits of diversification, it seems, may well have been consumed by central banking policy.
Figure 15: Cross-Asset Correlations (median daily) and Correlation Heat Map
Source: IMF
Balance sheet deleveraging may also explain the lack of bank lending from the demand side, where the
incentive to borrow at a lower rate in a slowing economy is not enough to overcome a negative
household/corporate balance sheet. Another form of transmission breakdown may be the declining of
securitization in mortgage and auto markets since the 2008 crisis.
12
2.2.5. International Effects
While the Fed is primarily concerned with domestic issues, it cannot ignore the consequences of its
policies on the rest of the world and conversely, the impact of foreign factors on domestic issues.
11
“IMF Global Financial Stability Report: Navigating Monetary Policy Challenges and Managing Risks,” International
Monetary Fund, April 2015
12
E. Benmelech, R. Meisenzahl, R. Ramcharan, “The Real Effects of Liquidity During the Financial Crisis: Evidence
from Automobiles,” National Bureau of Economic Research, April 2016
21
Figure 16: Dollar Index
Source: Federal Reserve Bank of St. Louis, Authors’ Computations
While it initially strengthened at the peak of the financial crisis, the dollar index weakened after QE1 and
QE2, but strengthened back as QE3 and competing QE programs in Europe and Japan were
implemented. This may have had consequences for the U.S. trade balance (see section 4.4) as well as
for U.S. trading partners. More specifically, while U.S. trade partners may not have been hurt by a
weakening dollar (during QE1 and 2) owing to a number of other structural strengths, the more recent
dollar strengthening may be more of a concern.
First, countries with high levels of dollar-denominated debt are substantially vulnerable to the dollar
strengthening. Secondly, dollar appreciation reflects large capital outflows from emerging markets to the
U.S. (further fueled by the prospect of Fed’s policy rate hike), which can be met by central bank
intervention in the form of sales of foreign reserves (of U.S. Treasuries in particular) (see Figure 48). In
turn, the sale of foreign reserves by central banks to defend weakening currencies may have two negative
effects on the U.S.: first, it contains growth stimulation in foreign economies, which may affect foreign
demand in the U.S.; second, it means that ownership of U.S. Treasuries moves from foreign central
banks to private investors. As the latter are more rate-sensitive than the former, it follows that volatility
and instability in global and U.S. financial markets are likely to increase.
80	
85	
90	
95	
100	
105	
110	
115	
120	
1-Mar-07 1-Sep-07 1-Mar-08 1-Sep-08 1-Mar-09 1-Sep-09 1-Mar-10 1-Sep-10 1-Mar-11 1-Sep-11 1-Mar-12 1-Sep-12 1-Mar-13 1-Sep-13 1-Mar-14 1-Sep-14 1-Mar-15 1-Sep-15
Index.	1997	=	100
Trade-Weighted	Dollar	Index
Trade	Weighted	U.S.	Dollar	Index:	Broad	(Jan	1997=100)	
QE1 QE2
Operation
Twist
QE3 Tapering
End	of	
QE3
22
2.2.6. Risks of Unwinding
The Fed mentioned in the minutes of its September 2015 meeting that economic effects would be minimal
if it unwound its $4.5 trillion balance sheet when “certain levels of the federal funds rate, such as 1
percent or 2 percent, were reached.”
13
If the Fed unloads $200 Billion of its balance sheet each year for
20 years after the fed funds rate reaches 2%, then it may be theoretically successful in normalizing QE
without disrupting the natural rate of money growth ($200 Billion is less than 2% of $12 Trillion of M2).
However, in the new world of QE, if IOER is the preferred tool for monetary policy then the Fed would also
be paying tens if not hundreds of billions of dollars to banks during each of the 20 years. It is easy to see
how this would be politically uncomfortable for the Fed.
But even before reaching the problem of paying enormous IOER, the Fed may take a long time to reach
its desired 1-2% FFR range due to its preferred gauge of inflation—core PCE. Core PCE not only tends to
be low among various inflation measures due to responses from businesses (BEA) as opposed to
consumers (e.g. BLS’s CPI, see Figure 49), adjustments for improvements in product quality, but also
excludes energy and food, the latter of which may account for as much as 15-40% of U.S. households
whose income is under $30,000.
14
Therefore, living costs for the poor may become disproportionately
high before the Fed starts normalizing its balance sheet (after which actual inflation—and thus living costs
for the poor will finally come down).
2.3. Conclusion: QE and the Financial Markets, a Mixed Success
As our research has indicated, emergency measures taken at the height of the global financial crisis
proved instrumental in stabilizing financial markets on the brink of collapse. In turn, the Fed’s QE
program, which was designed for the real economy, relied on the financial markets as its conduit. While
the program of LSAPs lowered long-term interest rates as designed, it may have opened a Pandora’s box
of financial market risks. Those risks may yet prove manageable and may be deemed to be worth the
cost if QE indeed has managed to achieve its real economy objectives. In the section that follows, we
consider the success of the policy in that arena.
13
Board of Governors of the Federal Reserve System, “Minutes of the Federal Open Market Committee,” Federal
Reserve, September 16-17, 2015
14
J. Feldmann, “The Fed as a Moral Enterprise,” Penn State University Press, 2012
23
3. REAL ECONOMY IMPACT ANALYSIS
When the Fed extended QE1 in March 2009 to the purchase of long-term Treasuries, it stated, “the
Committee anticipates that policy actions [...] will contribute to a gradual resumption of sustainable
economic growth”
15
. Similarly, when QE2 was announced in November 2010, the Fed justified the
expansion of the program “to promote a stronger pace of economic recovery.”
16
Growth resumption—or
economic recovery—both require growth in the main components of GDP’s aggregate demand:
consumption, private investment, government spending and next exports. This section examines the
effect of QE on these 4 factors and the resulting impact on key variables of the economy (GDP, inflation
and employment).
3.1. Consumption
3.1.1. Expected Results and Transmission Mechanisms
Historically, consumption has been the engine of the U.S. Economy. In the wake of the Lehman collapse,
there were fears that massive job cuts and a depressed economic environment would lead to severe
consumption contraction. It was therefore key for the Fed to stimulate consumption and maintain its role
as the driver of Aggregate Demand. Directly or indirectly, QE was therefore expected to ensure
consumption remained robust. There are three main channels through which QE is believed to work on
consumption:
• The interest rate channel: with both short and long-term interest rates low, consumers can
benefit from (i) an intertemporal substitution effect, moving forward consumption which is now
cheaper to finance (ii) an income effect if low rates boost aggregate demand, lead to higher
employment and higher wages and (iii) a wealth effect via the increase in value of assets (which
either allows for revision of consumption smoothing or increases borrowing capabilities with
higher collateral)
• The consumer credit channel: for the interest channel to operate, it needs to be transmitted at
the same time by the various lending institutions. In particular, the consumer credit channel needs
to effectively transform QE into more liquidity at low rates to consumers
• The signaling effect: QE is expected to restore consumer confidence by convincing the public
that the Fed is taking decisive action to ensure that rates remain low for long in order to stimulate
the real economy (including consumption)
3.1.2. Observed Outcomes
(i) Consumer Credit: Improved Availability and Conditions
After recording a rather steady increase of about 5% per annum (“p.a”) in the 5 years prior to the onset of
the global financial crisis, consumer credit availability dropped by an average 4% in 2009 and 1% in 2010,
but recovered to its pre-crisis level by the end of 2011. The total decrease was contained by the limited
15
See Footnote 1
16
See Footnote 2
24
drop and subsequent strong recovery in the availability of non-revolving credit, which has represented the
overwhelmingly larger share of total consumer credit since the crisis.
18
Figure 17: Changes in Consumer Credit Flows
Source: Federal Reserve, Authors’ Computations (2016)
Recovery in the consumer credit market is further evidenced by the improvement in financial conditions,
both in amounts loaned and average maturities. Average auto loans, which are representative of durable
goods, increased from $25,000 to $28,000 (+12%) between the end of 2012 and the end of 2015, while
the average maturity increased by 5 months (+8.2%) to over 66 months in the same period. And as
expected, consumer interest rates followed the downward trend in yields on Treasuries, with both
personal consumption loans and auto loans rates declining at a pace similar to that of long-term
Treasuries.
18
Non-revolving credit includes loans for motor vehicles, boats, trailers, mobile homes, education, vacations.
25
Figure 18: Consumer Financing Rates
Source: Federal Reserve, Authors’ Computations (2016)
(ii) Impact on Consumer Confidence
While consumer confidence slumped at the height of the crisis, it started recovering as QE1 was
extended to Treasury security purchases and quickly recovered as interest rates kept falling (see Figure
54)—suggesting that rather than behaving as a lagged effect of QE, consumer confidence remained
rather healthy and consumption didn’t suffer much during the crisis, which supported the U.S. economy.
(iii) Overall: Steady, Solid Consumption Recovery
Overall, with increased lending and lower interest rates, consumption remained rather steady and the key
engine of the U.S. economy (consistently accounting for about 2/3 of GDP). Contraction was -2% in 2008
and a mere -0.20% in 2009, only to recover to an average 2.3% p.a in the 6 years thereafter.
Consumption remained robust for both durable and non-durable goods (with the notable growth of
recreational goods and vehicles), as well as for services, supported by robust growth in healthcare
services (see Figure 53). On that basis, it would seem that QE had positive effects in supporting
consumption. While one could argue that it simply ensured continuity rather than spurring a full-blown
recovery, QE appears to have helped to offset a collapse in one of the structural pillars of the U.S.
economy.
26
3.2. Investment
Gross private investment was the hardest hit by the crisis, especially investment in the housing sector in
the wake of the real estate collapse in 2006. Although it only accounted for 18% of total U.S. GDP in the
decade preceding the crisis, investment dropped by 2.2% in 2007, 15.9% in 2008 and 11.0% in 2009. The
bulk of the drop came from fixed investment while previously accumulated inventories were being sold.
Unsurprisingly, residential investment experienced a severe contraction (-15.4% p.a on average between
2006 and 2010) which accounted for much of the drop in investment until 2008/9 when the non-residential
part of investment (investment in physical structures, equipment as well as software) also crashed.
3.2.1. Expected Results and Transmission Mechanisms
Against this backdrop, QE was expected to stimulate investment through three main channels in a
manner very similar to the transmission channels operating on consumption:
• The interest rate channel: lower interest would allow for (i) lower funding/borrowing costs and
(ii) increase the value of assets owned by firms (or homes owned by individuals) both of which
make borrowing easier and cheaper for businesses which in turn can be incentivized to bring their
planned investment forward
• The credit channel: just like consumption, the credit channel needs to operate effectively for the
interest rate channel to be transmitted
• The signaling effect: also like consumption, low interest rates are expected to signal support to
real investments and can therefore improve business confidence
3.2.2. Observed Outcomes
(i) Financial Conditions for SMEs
Small and medium enterprises (SMEs) form the backbone of the United States economy. In the U.S.,
SMEs make up 99% of all firms, account for about 50% of GDP as well as over 50% of private sector
employees, and generate over 65% of net new private sector jobs.
19
SMEs fund their expansion or
operations by borrowing primarily from traditional lending institutions
20
. Credit markets enable loan
demand from corporations—including SMEs (as well as individuals) and supply from financing
institutions—to support SMEs and in turn, the larger domestic economy.
In the face of the 2008-2009 credit crunch, the credit channel was seriously impaired and access to
funding, especially for SMEs, deteriorated. How can central bank intervention have an impact on restoring
the credit channel? In a seminal paper (Bernanke and Gertler, 1995), ex-Fed Chairman Bernanke argued
that monetary policy could be transmitted through the credit channel as actions by the central bank can
impact the creditworthiness of borrowers—and therefore demand for credit—as well as the net worth and
balance sheet of lenders—thereby affecting loan supply.
Well aware of the key role of the credit channel, a few months into the crisis then-Chairman Bernanke
sought to encourage community banks to continue lending to SMEs, saying “I want to conclude by
19
S. Firoozmand, P. Haxel, E. Jung and K. Suominen, “State of SME Finance in the United States in 2015,” TradeUp
Capital Fund and Nextrade Group, LLC, March 2015
20
Small banks represent 52% of credit sources as of 2015 with large banks contributing 42%. - “2015 Small Business
Credit Survey,” Federal Reserve System, March 2016
27
encouraging you as community bankers to operate prudently in the current environment, but not to let fear
drive your decisions.”
21
But with contracted demand, uncertain future and increased regulation (especially
with requirements to raise capital adequacy ratios), community banks didn’t play the countercyclical role
Bernanke would have hoped for. In the three years following the Lehman collapse, credit conditions
tightened and loan supply fell—in fact, some studies find that the loan supply shock contributed to 50% of
the GDP growth contraction in 2008/9 in the U.S.
23
Could the Fed have done more in that respect? That is
what Professor Joseph Stiglitz argued during our interview, stressing that there was “no way QE could
work without fixing the bank credit channel.”
Figure 19: SME Financing
Source: Federal Reserve, Authors’ Computations
While interest rates steadily declined with the successive rounds of QE, the data show two important
elements: (i) the net percentage of banks tightening credit standards to SMEs surged in 2008/9 with a
commensurate drop in loan supply (ii) although credit standards substantially loosened after QE1,
demand for loans also resumed and the number of businesses facing difficulties to meet their borrowing
needs actually increased post QE1. This figure almost doubled during QE2 (from 5% to 10% of
21
B. Bernanke, “The Financial Crisis and Community Banking,” speech held at the Independent Community Bankers
of America's National Convention and Techworld, Phoenix, Arizona, March 2009
23
G. Wehinger, “SMEs and the credit crunch: Current financing difficulties, policy measures and a review of
literature,” OECD Journal: Financial Market Trends, Volume 2013/2, 2014
28
businesses claiming their borrowing needs were unsatisfied) before returning to pre-crisis levels as QE
was eventually halted. Both of these elements reflect the well-documented fact that SMEs suffer more
than large corporates from credit drying up and have to wait longer to benefit from a recovery and credit
easing.
24
Given this, one could argue either that (i) QE was not very effective (or even failed), (ii) QE is
very slow to operate or (iii) recovery of borrowing demand is due to factors other than QE (general
recovery/growth inside the economic cycle).
(ii) Impact on Investor Confidence
While business confidence slumped at the peak of the crisis in 2009, it slowly picked up as interest rates
kept declining—although it is still lower today than its pre-crisis level (see Figure 57). One important
aspect gathered from our research is that business behavior isn’t necessarily very responsive to Fed
announcements. While low interest rates and credit availability do help, businesses have been rather
cautious to invest since 2008/9. Such caution is an immediate result of the crisis and due to larger
structural issues which, taken together, hamper aggregate demand and against which QE or any
monetary policy might have only moderate effects.
(iii) Overall: Partial Investment Recovery
Here we distinguish between two main components of investment:
• Residential investment: Studies
25
find that QE1 reduced the spread between mortgage rates
and U.S. Treasuries (for the same given maturities) by 100bp, which in turn is found to lead to an
increase of 6.2% in residential investment. Looking at national data, residential investment indeed
increased by an annual average of 6.8% in the 5 years following QE1 (and a part of QE2),
although it was somewhat subdued and only contributed to an average 23% of the recovery in
investment
• Non-residential investment followed a similar recovery, with an average 5.7% annual increase
since 2011 driven by strong growth in equipment (see Figure 56).
3.3. Government Spending
3.3.1. Expected Results and Transmission Mechanisms
While QE was expected to directly impact consumption and investment, it was also implicitly supposed to
support aggregate demand via an increase in government spending. For instance, in its announcement of
QE1 extension in 2009, the FOMC referred to fiscal stimulus as one of the main factors supporting growth
resumption.
26
There are two ways through which QE supported the fiscal stimulus:
• Increased revenue: Despite much lower interest rates, the expanded balance sheet of the Fed
produced substantially higher revenue from interest earned on the securities held. Interest earned
by the Fed is returned to the U.S. Treasury and accounted for in the federal budget. From 2000 to
2008, the average annual revenue transferred from the Fed to U.S. Treasury amounted to $26.5
billion but swelled to an average $78 billion in the seven following years (peaking at $99 billion in
2014). It is worth noting that such increased revenue come from the Government’s own
borrowings (through Treasuries) and therefore means that the government is borrowing a
24
Ibid
25
K. Walentin, “Quantifying the macroeconomic effects of large-scale asset purchases” in Den Haan (2016)
26
See Footnote 1
29
substantial amount of its debt for free, raising the question of “financial repression” (see 6.2.2)
and related potential distortions by QE of the true costs of government spending. Overall
however, more fiscal space gives more room for public spending which, in times of crisis such as
the Great Recession, is usually needed (at least temporarily) to prevent the economy from
sinking.
• Lower funding costs: cheaper funding costs are expected to incent the federal government—as
well as states and cities—to increase public spending for capital and infrastructure projects,
healthcare, education and other social programs.
3.3.2. Observed Outcomes
QE therefore increased fiscal space both on the revenue and cost side, and together with a rapid political
response, most likely made it easier and more politically acceptable (and marketable to opposing
stakeholders) for the government to pass programs such as the Troubled Asset Relief Program (TARP)
and the American Recovery and Reinvestment Act (ARRA) which made up the bulk of the fiscal stimulus
in 2008/9. As such, the fiscal deficit increased from an annual average of 1.5% from 2000 to 2008 to an
average of 8.4% in the 4 subsequent years (with a peak at almost 10% in 2009).
30
Figure 20: U.S. Fiscal Deficit
Source: Congressional Budget Office, Authors’ Computations
On the whole, without the fiscal stimulus, which was in part supported by QE, Blinder and Zandi (2015)
find that in 2010, U.S. real GDP would have been 3.5% lower than its actual level, the unemployment rate
would have peaked at almost 11% (or 2.4 million fewer jobs), the Great Recession would have lasted
much longer and key macroeconomic data would have only been catching up with actual levels around
2014-2015.
However, there are several caveats to the potential benefits QE might have in terms of increased
government spending:
• Mandatory spending: Around 55% of the U.S. budget is destined to be spent on mandatory
outlays, i.e. those expenditures (most of which are related to Social Security) which are based on
law rather than the actual budgeting process. As such, QE’s potential role in increasing
discretionary spending (which makes up about 35% of the budget—the remainder being used to
pay interest on government debt) is constrained by the space granted to mandatory outlays;
• A high share of discretionary spending goes to National Defense: over 50% (and more in
the 1980s) of discretionary spending has been devoted to national defense for the past 20 years,
meaning that the scope for increased spending in areas such as infrastructure or education is
further limited;
31
• Political gridlock: in spite of the substantial fiscal stimulus of 2008/9, the consensus from both
our literature review and interviews is that more long-term investment in capital, infrastructure or
education projects should have been made. Unfortunately, each of these areas for investment are
politically divisive and didn’t see high enough of a boost because of the U.S. political gridlock;
• Debt sustainability: QE may stimulate spending and increase the budget deficit, but this leads to
an increase in debt ratios which over time can become too high for debt to be sustainable. While
this may not be the case in the U.S. yet, the U.S. debt-to-GDP ratio increased from less than 65%
in 2007 to more than 100% in 2015. As such, any further fiscal stimulus which might have been
supported by QE could have raised concerns about debt sustainability
The data show that government spending increased in 2008, 2009 and 2010 but at a modest 2.3% annual
average, with most of the efforts coming from the federal government while state and local authorities
barely increased spending. Starting in 2011, public spending actually shrank by an annual 1.6%.
Interestingly, both defense and non-defense related items saw an increase in public spending, with a
slightly faster pace for the former (5.9% vs. 5.7% annual average) between 2008 and 2010. Public
expenses in transportation, healthcare, and—to an even greater extent—education, grew at higher than
usual levels during the same period, but contracted thereafter. Given that each account for only 5 to 10%
of discretionary spending, any increase in public spending would have to have been much more
substantial to massively impact overall government spending. In fact, two elements stand out when we
look at fiscal policies while the different rounds of QE were implemented:
• While a number of states and cities took advantage of low interest rates to bring forward new
investments, most actually proved cautious and used low rates to refinance loans or increase
short-term operational spending rather than new spending. This is illustrated in Figure 59.
• Fiscal stimulus turned to austerity in 2011 at a time when unemployment was still far from its
natural rate. In line with other research, Blinder and Zandi (2015) argue the temporary stimulus
should have lasted longer (in their view, until unemployment was less than 1 percentage point
above its natural rate) and, as such, was ended much too early.
3.4. Net Exports
3.4.1. Expected Results And Transmission Mechanisms
De facto, QE should have an impact on net exports thanks to the exchange rate channel: lower interest
rates in the U.S. imply a nominal depreciation of the U.S. Dollar which, with low inflation, should lead to a
real depreciation and in turn boost exports, reduce imports, and lead to imported inflation. This theory is
however subject to several caveats:
• U.S. monetary policy impacts the U.S. dollar via the Exchange Rate channel when all else is held
constant; to the extent other countries adopt similar monetary policies (which could lead to some
currency wars) to stimulate their own exports, the impact of monetary policy on the dollar will be
much weaker than expected
• A large share of global trade is done in dollars and foreign exporters invoice U.S. importers in
dollars; as such, a real dollar depreciation has no effect on imports
32
• Structural changes in the global value chain weaken the impact of the dollar depreciation on
exports: when several parts of a given product come from every corner of the world, the finished
product, even if sold by U.S. exporters, will lose a part of its “dollar” value
• Structural changes in Global trends such as the Great Recession or the recent global slowdown
in demand from Emerging Markets will affect U.S. trade sometimes much more than changes in
the dollar on the Exchange rate market
3.4.2. Observed Outcomes
On that basis, as mentioned in the financial section of this report, while the dollar index weakened after
QE1 and QE2, it strengthened after QE3 as the ECB and BoJ were implementing their own QE programs.
At the same time, it is clear from the chart below that while QE1 was implemented, both exports and
imports substantially decreased, reflecting a global slowdown in the wake of the financial crisis which
propagated from the U.S. to the rest of the world—which supports our argument above that global
structural trends, rather than monetary policies, have a larger impact on the trade balance.
Figure 21: U.S. Trade Balance
Source: Bureau of Economic Analysis, Authors’ Computations
All in all, the trade deficit declined by about 45% (to $410 billion) between 2007 and 2010, but widened by
14% in 2011 alone as QE2 was implemented. During the Great Recession, imports contracted more than
exports. Although after the global slowdown in 2008/9 both exports and imports resumed their upward
trend, the trade deficit remained steady around its crisis level of $450 billion. Indeed, the increase in net
imports of most goods was offset by the increase in net exports of services and by a substantial decline in
33
net imports of oil in the wake of the shale oil boom in the U.S. in the late 2000s. It is therefore difficult to
argue that QE had any substantial impact on net exports given the multitude of confounding factors which
are likely to have impacted such component of U.S. GDP with much more potency.
3.5. Putting Things Together
3.5.1. Mixed to Positive Impact of QE on Aggregate Demand and Inflation
Having looked at the four main elements of aggregate demand, we now have a better overall picture of
what happened since the onset of the crisis: as illustrated by the graph below, we observe that (i)
consumption was rather resilient and remained the engine of the U.S. economy (accounting for over ⅔ of
GDP) through the crisis (ii) investment suffered the most but slowly recovered while (iii) fiscal stimulus
was lower than what was likely required (iv) the trade deficit declined, but the impact of QE on Net
Exports is questionable. As a result, U.S. GDP has been steadily recovering at more than 2% p.a since
2009, narrowing the output gap closer to pre-crisis levels. Nevertheless, core inflation (one of the Fed’s
two key objectives) has been almost consistently below the 2% target.
Figure 22: Main Macroeconomic Indicators
Source: Bureau of Economic Analysis, Authors’ Computations
34
While quantifying the actual effects of QE on GDP is challenging, several studies have attempted to do so
with varying results—summarized in the table below:
Figure 23: QE Macroeconomic Effects: a Summary
Source: Authors, based on the works cited in the table
Most of these studies find rather positive effects on the real economy from one or several rounds of QE.
For instance, Chung et al. (2012) found that QE1 and 2 may have raised GDP by almost 3 percentage
points and created 2 million jobs while Fuhrer and Olivier (2011) estimated that QE2 alone increased
GDP by close to 1 percentage point and created 700,000 jobs. But others (Chen et al, 2011; Wu and Xia,
2014) find much more moderate effects. In fact, one study (Yi, 2014) suggests that for QE to have any
real impact on the real economy, asset purchases need to be even larger (more than 50% of GDP) and
last for several years. According to some of the economists interviewed as part of our research, the very
first round of QE was effective to unfreeze financial markets, but there is little evidence that QE or any
other type of monetary policy actually change anything about the business cycle. Although subject to
shocks, the economy, by nature, is driven by trends and shifts in behavior and confidence (the “animal
spirits” dear to Keynes) and as such, fiscal or monetary policies are only accommodating, not
determining. Taken to an extreme, this line of thought may be associated with the concept of the “Phoenix
Miracle” (Calvo et al., 2006), a phenomenon whereby output “rises from its ashes” outside the formal
credit market, further suggesting the potentially limited impact of QE in restoring aggregate demand.
27
27
Note that the concept of the “Phoenix Miracle” is associated with emerging markets only, and is itself subject to
criticism in T. Mayer, M. Biggs and A. Pick, “The myth of the ‘Phoenix Miracle’,” VOX CEPR's Policy Portal, May
2010, http://voxeu.org/article/myth-phoenix-miracle
35
Overall however, one can reasonably argue that QE had at least some positive effects on aggregate
demand and inflation. At the same time, QE may have contributed to the fall in unemployment—but to
what extent did QE really impact the labor market? The following section attempts to answer that
question.
3.5.2. Mixed Recovery in the Labor Market: Any QE Effect?
(i) Unemployment
In theory, QE should have an effect on unemployment through the work of firms and corporations. With
unconventional monetary policy, money becomes an “inexpensive asset”, and with low interest rates
companies have an increased ability to borrow money and grow their businesses. This expansion should
create new jobs and reduce unemployment.
As employment is a lagging economic indicator, it takes longer to recover in comparison with other
variables. To analyze the effect of the QE on employment, we reviewed the changes in both the U-3 and
U-6 unemployment rates.
Figure 24: Various Measures of Unemployment
Source: U.S. Bureau of Labor Statistics
According to the data, the official unemployment rate (U-3) level declined from 10% at the peak of the
recession in 2010 to 5% in March 2016. Similarly, the U-6 measure (which includes part-time and
discouraged/marginally attached workers) reached 9.8 % in March 2016, down from a peak of 17%, a
reflection that overall, the economy has seen a substantial progress in adding jobs
28
. As employment
levels recover from the deepest recession since the Great Depression, the private sector added 12.8
28
		N.	Irwin,	"Quantitative	Easing	Is	Ending.	Here’s	What	It	Did,	in	Charts."	The	New	York	Times.	October	2014.	
http://www.nytimes.com/2014/10/30/upshot/quantitative-easing-is-about-to-end-heres-what-it-did-in-seven-
charts.html?_r=0
36
million private-sector jobs over “64 straight months of job growth, the longest streak of private-sector job
creation on record. The unemployment rate is down to 5%, a seven-year low”
29
. The goal to reach a 6.5 %
unemployment rate that was set as a benchmark by the Fed has been achieved with the headline
unemployment rate currently resting at about 5%.
However, the unemployment rate does not always provide the clearest picture of the labor market. The
employment-to-population ratio, an indicator of the number of people with a job to the total number of
eligible workers, suggests that the initial rounds of QE did not have as major an effect as the Fed would
have liked although the ratio started to improve steadily beginning in 2014
30
.
Figure 25: Employment-to-Population Ratio
Source: U.S. Bureau of Labor Statistics, Federal Reserve Bank of St. Louis
At the same time, part of the fall in unemployment rate could be explained by the decrease in the labor
force participation rate. To be sure, the participation rate decline “predates the Great Recession, due to
several structural changes that also include aging of the workforce.”
31
In 2015, the participation rate was
equal to 62.6%, its lowest level since October 1977 (see Figure 62). The Current Population Survey
provides three main reasons for the participation rate decline: retirement, disability, and “more people in
school—with a discouraged worker falling into any of those categories.” Out of the three, it would seem
that the primary reason has to do with the retirement, as more people tend to retire during a recession.
32
Given the structural nature of the change in participation rate, there appears little that QE could directly do
to influence this dimension of the labor market, but in stimulating growth and helping job creation, QE
contributed to the drop in unemployment rates as well as an uptick in participation rate. In March 2016,
29
		E.	Jacobs,	"The	Declining	Labor	Force	Participation	Rate:	Causes,	Consequences,	and	the	Path	Forward	-	Equitable	Growth."	
Washington	Center	for	Equitable	Growth,	July	2015	
30
		S.	McCourt,	"Quantitative	Easing",	Meketa	Investment	Group,	September	2013
31
See Footnote 27
32
A. Schrager, “Why Labor Force Participation is still so low,” Bloomberg, Januray 2015,
http://www.bloomberg.com/news/articles/2015-01-19/why-labor-force-participation-is-still-so-low
37
the participation rate increased to 63%, showing a return to the job market by those previously
discouraged in yet another positive sign of economic recovery.
33
In analyzing the effects of QE on the labor market, it is worth distinguishing between two periods: (i)
during the labor market downturn (January 2008-February 2010), “employment losses occurred
throughout the economy, but were concentrated in mid-wage and higher-wage industries while (ii) during
the recovery (February 2010 to February 2014), employment gains have been concentrated in lower-
wage industries.”
34
This is illustrated by Figure 26 below:
Figure 26: Net Change in Private Sector Employment (in thousands)
Source: National Employment Law Project 2014
The above findings therefore raise the question of which sectors benefited the most from the recovery. If
QE supported the job recovery, it is worth stressing that most of the new positions “created were low-
paying jobs in the service sector, like the restaurant and hospitality industry, and not the high-paying
manufacturing, mining and construction jobs that the Fed was hoping for. The number of people giving up
and no longer looking for jobs exploded to a historic record, artificially bringing the unemployment rate
down.”
35
The distribution of job losses and their following creation have also been skewed. “Higher-wage
industries—like accounting and legal work—shed 3.6 million positions during the recession and have
added only 2.6 million positions during the recovery. But lower-wage industries lost two million jobs, then
added 3.8 million.”
36
(ii) Wages
While QE might have supported job recovery, it is also important to analyze the evolution of nominal and
real wages in the aftermath of the Great Recession. While real wage stagnation predates the crisis, it
would seem that wage growth has been very slow during the recovery. This trend is consistent with the
33
	A.	Kiersz,	"The	Labor	Force	Participation	Rate	Falls	to	a	38-year	Low",	Business	Insider,	July	2015,	
http://www.businessinsider.com/labor-force-participation-rate-falls-to-38-year-low-2015-7	
34
	“Tracking	the	low-wage	recovery:	industry	employment	&	wages,”	National	Employment	Law	Project,	April	2014,	
http://www.nelp.org/publication/tracking-the-low-wage-recovery-industry-employment-wages/
35
E. Moy, "A Half Cheer for Quantative Easing", Newsmax Finance, April 2015,
http://www.newsmax.com/t/finance/article/552765
36
A. Lowrey, "Recovery Has Created Far More Low-Wage Jobs Than Better-Paid Ones", The New York Times, April
2014. http://www.nytimes.com/2014/04/28/business/economy/recovery-has-created-far-more-low-wage-jobs-than-
better-paid-ones.html?_r=0.
38
above data showing that most of the job recovery is in low-wage positions which may suggest that QE
might have been insufficient to boost wages and might in fact have knock-on effects on income
distribution (a point which we detail further in our social analysis section). In recent years, there has been
downward pressure on wages as employers have been unable or unwilling to offer considerable wage
growth to attract workers they need despite the economic recovery.
37
“In the last few months, nominal
wage growth appears to be picking up slightly, but remains significantly below levels consistent with the
Fed’s 2% target and likely trends in potential productivity.”
38
The growth in real wages has been concentrated at the top of the wage distribution, with little to no
change between middle and bottom groups for the last 16 years, which shows that wage inequality
continues its 35-year rise trend.
39
In 2015, real wages grew 2.1 % while nominal wage growth was equal
to 2.2%. While this level of wage growth might seem positive, real wage growth is artificially inflated by a
drop in inflation (inflation fell from 1.6% in 2014 to 0.1 % in 2015) and nominal wage growth of this level
remains “below a level where workers would reap the benefits of economic growth.”
40
Figure 27: Wage Growth
Source: Economic Policy Institute
In fact, there are two reasons why low inflation should not be considered as a driver of real wages and
living standards. First of all, low inflation could be explained by a large decline in certain goods, mostly
gas and oil, which are volatile by nature. Secondly, lower levels of inflation could be dampening the rise in
nominal (and therefore real) wages.
41
While the debate over the actual impact of QE on the labor market remains unsettled, the consensus is
positive, with Bivens (2015) noting that “as bad and unequal as wage growth was since the onset of the
37
E. Gould, "Wage Inequality Continued Its 35-year Rise in 2015", Economic Policy Institute, March 2016
38
Ibid.
39
Ibid.
40
Ibid.
41
Ibid.
39
Great Recession, it would have been even slower and less equal had the Fed not pursued its easy money
policies i.e., compared to a counterfactual of no change in fiscal policy in response to a recession,
monetary stimulus reduces inequality significantly.”
42
3.5.3. QE and the Real Economy: Unintended Consequences
Overall, while QE stimulated GDP and potentially inflation and employment, it may have produced at least
two unintended consequences:
• Negative distributional effects: with limited growth in real wages, especially at the bottom of the
distribution, and recovery in asset prices disproportionately in favor of the wealthy, it may be
argued that QE increased social inequalities;
• Increased attention and scrutiny on the Fed: its unconventional monetary policies have drawn
heightened attention to the functioning and policies of the Fed which has sometimes been
accused of a lack of transparency and/or of monetizing the government deficit;
The following two sections will explore these issues in more depth, starting with the social impact of QE.
42
J. Bivens, “Gauging the Impact of the Fed on inequality during the Great Recession,” Brookings Institution, June
2015
40
4. SOCIAL IMPACT ANALYSIS
The Fed’s monetary policy objectives—”to promote effectively the goals of maximum employment, stable
prices and moderate long-term interest rates"—directly relate to the social well-being of the nation, but
these objectives were directly challenged by the recession and global financial crisis.
43
The collapse of
the housing market led to the erosion of home values, systemic risk in the banking and financial sectors
severely curtailed lending and financing opportunities, and a recessionary environment impaired
confidence in both consumers and firms leading to high rates of unemployment. Proponents of QE point
to the great social costs that would have ensued if, having exhausted its conventional monetary policy
instrument, the Fed had not taken further action and employed unconventional monetary policy to
stimulate aggregate demand, repair and mitigate risk in the broken markets, and support economic
recovery and jobs.
44
Critics of QE argue that any benefits were outweighed by the inherently regressive
effects of any expansionary monetary policy targeting economic recovery. In the context of existing
inequality and particularly given the means by which QE operates (expanding bank balance sheets), there
is a general view that “a policy which generates a robust and sustained recovery will benefit those at the
top more than those at the bottom.”
45
In this section, we evaluate these two points of view as we attempt to determine whether social inequality
on the whole was exacerbated by the Fed’s implementation of QE. We begin with a brief consideration of
inequality in America, explore theoretical considerations on how QE can affect social outcomes, conduct a
review of the small but growing literature specific to the subject, and finish with our own conjectures on
the matter.
4.1. Assessing Inequality
Inequality is familiar ground both to sociologists, for whom equality of opportunity is a central concern, and
to economists, who define inequality in terms of the distribution of income, wealth, and consumption
(Cowell, 2011; and Piketty, 2014). In this study, we consider inequality using the economic framework.
We do not ignore the importance of inequality of opportunity but take the view expressed by Fed
Chairwoman Janet Yellen that opportunity follows from “access to economic resources” and that
“inequality of outcomes can exacerbate inequality of opportunity.”
46
While consumption, income, and wealth are interrelated, each has different implications for social welfare.
Inequality of wealth communicates the extent to which “the lottery of birth becomes an increasingly
important determinant of living standards.”
47
Income inequality is widely cited as data is readily available
and can be observed not only between households but also over the course of a single individual’s
lifetime
48
. This facilitates consideration of both cross-household and intergenerational inequality.
49
43
“The Federal Reserve's Dual Mandate,” Federal Reserve Bank of Chicago, May 2016,
https://www.chicagofed.org/publications/speeches/our-dual-mandate
44
	“Troubled	Asset	Relief	Program	:	Treasury's	Framework	for	Deciding	to	Extend	TARP	Was	Sufficient,	But	Could	Be	
Strengthened	for	Future	Decisions,”	United	States	Government	Accountability	Office,	June	2010	
https://fraser.stlouisfed.org/scribd/?title_id=5049&filepath=/docs/historical/fct/gao_report_tarp_20100630.pdf#scribd-open	
45
C. Giles, “Debate rages on quantitative easing’s effect on inequality,” Financial Times, October 2014,
http://www.ft.com/intl/cms/s/0/c630d922-586f-11e4-942f-00144feab7de.html,
46
	J.	Yellen,	"Perspectives	on	Inequality	and	Opportunity	from	the	Survey	of	Consumer	Finances."	Speech	held	At	the	Conference	
on	Economic	Opportunity	and	Inequality,	Federal	Reserve	Bank	of	Boston,	Boston,	Massachusetts	October	17,	2014.	
47
O.	Attanasio,	E.	Hurst	and	L.	Pistaferri,	“The	evolution	of	income,	consumption,	and	leisure	inequality	in	the	U.S.,	1980-2010,”		
National	Bureau	of	Economic	Research,	April	2012	
48
	According	to	the	theory	of	consumption	smoothing,	an	individual	making	little	early	in	her	career	finances	consumption	until	
her	peak	earning	years,	after	which,	in	the	latter	phase	of	her	life,	she	spends	down	her	accrued	wealth.
41
However, many consider consumption inequality to be the best representation of social welfare. This is
because consumption expresses a household’s actual ability to attain a certain standard of living via the
purchase of a minimal “basket” of goods and services to support that style of living.
50
While consumption
itself is a function of both wealth and income, research shows that changes in income and consumption
inequality have mirrored each other in the past few decades.
51 52
Since the early 2000s, measures of income and wealth in the United States have exhibited the largest
disparities, with the majority of wealth and shares of income concentrated in the top strata of the
population.
53
Figure 27: Gini Coefficient Evaluations of Inequality in the United States (1985-2010)
Source: Consumer Expenditure Surveys, Fisher et al. (2013)
4.2. Trends in Inequality
4.2.1. Income Inequality
Income inequality in the United States has persisted since 1993, and has grown at an increasing rate
since 2000.
54
As of 1993, “mean income among the top quintile [has been] at least twice as large as the
mean income in the fourth quintile,” with dispersions in the shares of household income held by each
quintile increasing over the entire time period. The lowest quintile (earning the least) experienced an
11.1% fall in income share since 1993, while the top-most quintile has seen a steady increase in its share
of income since 2000.
55
A comparison of income ratios between the 90th-10th (top-to-bottom of the
income distribution), 90th-50th (top-to-middle), and 50th-10th (top-to-bottom) percentiles further highlights
49
	D.	DeSilver	"The	Many	Ways	to	Measure	Economic	Inequality",	Pew	Research	Center,	May	2015.	
http://www.pewresearch.org/fact-tank/2015/09/22/the-many-ways-to-measure-economic-inequality/		
50
Ibid.	
51
Ibid.	
52
	M.	Aguiar	and	Mark	Bils,	“Has	consumption	inequality	mirrored	income	inequality?,”	National	Bureau	of	Economic	Research,	
February	2011.	
53
	See	Footnote	47	
54
S. Donovan, “A Guide to Describing the Income Distribution.” Congressional Research Service, February 2015
55
Ibid.
42
the increasing inequality. While “all ratios increased between 1993 and 2013, indicating that the income
groups are moving farther apart from each other,” the 90-10 ratio showed the greatest increase “from 10.6
to 12.1 (or approximately a 14% increase).”
56
Figure 28: (a) Trends in Income Inequality
Cumulative Change in Quintile Shares of Total Income Since 1993 (top) and
Cumulative Percentage Change in income Ratios, 1993-2013 (bottom)
Source: Donovan (2015)
While growth in the mean income of all quintiles either declined or remained constant between 2007-2008
(the period coinciding with the Great Recession), only the top-most quintile recovered some of that loss in
the period from 2011 onward.
57
56
Ibid.
57
Ibid.
43
Figure 29: (b) Trends in Income Inequality—Mean Quintile Income
(Pre-Tax Cash Income Received by Households in 2013 CPI-U-RS dollars)
Source: Donovan (2015)
4.2.2. Wealth Inequality
Desilver (2015) notes that “wealth inequality tends to be much higher than either income or consumption
inequality, but it also tends to not vary as much over time.”
58
Despite that, New York University economist
Edward Wolff found significant increases in shares of wealth held by the top 5% of households from 1962
to 2013. The share of wealth held by the top 1% rose from 33.4% in 1962 to 36.7% in 2013, while the
holdings of the next-wealthiest 4% of households rose from 21.2% in 1962 to 28.2% in 2013.
59
By
contrast, the wealth share of the bottom 40% did not grow and instead fluctuated between 1.5% of growth
and -0.9% of loss from 1962 to 2013. Together, these corroborate Pew Research Center research that
found “that the wealth gap between upper-income people and the rest of America was the widest on
record in 2013”—with only those in the upper income brackets seeing wealth gains in the post-recession
period.
60
Figure 30: Trends in Wealth Inequality
Source: PEW Research Center
58
See Footnote 47
59
Ibid.
60
Ibid.
44
4.2.3. Wealth and Racial/Ethnic Inequality
Further analysis from the Pew Research Center finds that wealth inequality has also widened along racial
and ethnic lines, with the median wealth of white households at 13 times that of black households in
2013—as compared to eight times the wealth in 2010.
61
This may be related to the disparate abilities of
households to benefit from the recovery of asset prices. “White households are much more likely than
minority households to own stocks directly or indirectly through retirement accounts” and decreases in
asset ownership from 2010-2013 “tended to be proportionally greater among minority households” (as
homeownership rates among minority households “decreased from 50.6% in 2010 to 47.4% in 2013”).
62
This adds another dimension to the question of QE and social inequality.
Figure 31: Growth of Racial/Ethnic Wealth Gaps Since the Great Recession
Source: PEW Research Center
4.2.4. Debt and Consumption Across America
In addition to the more traditional measures of consumption discussed in the Real Economy portion of this
paper, a consideration of debt patterns can shed light on consumption inequality. Ratcliffe et al. (2014)
characterize debt and access to credit as a critical “stabilizing force” for households and communities as
both support the financing of essential purchases, houses, and education. Ratcliffe et al. (2014) make use
of 2013 TransUnion credit data encompassing mortgage debt and “non-mortgage debt” (vehicle loans,
education loans, credit card debt, and debt in collections—which can include unpaid medical and utility
bills)—to examine the spatial distribution of debt in America in the post-QE recovery.
While QE undoubtedly help to restore home values and financing opportunities, the extent of the recovery
varied across the nation. The authors find high concentrations of mortgage debt both along the west and
east coasts as well as in the Mountain states. In the “affluent, high-cost [coastal] markets,” that metric
61
R. Kochhar and R. Fry, "Wealth Inequality Has Widened along Racial, Ethnic Lines since End of Great Recession."
Pew Research Center, December 2014, http://www.pewresearch.org/fact-tank/2014/12/12/racial-wealth-gaps-great-
recession/
62
Ibid.
45
alone is not a signal of financial distress, as “debt is actually fairly low relative to home prices” in those
regions. However, the debt is a concern in the middle of the country, where there are high levels of
“mortgage debt relative to home values”—likely due to weaker economic recovery resulting in “lower
growth in housing values relative to mortgage amounts and differences in foreclosures and strategic
defaults” in those regions. Finally, the study finds signs of great “financial stress” in “the lower-income and
less populous” central South. In that region, levels of mortgage debt relative to income are low, and the
ratio of “nonmortgage debt” relative to income is the highest in the nation. Additionally, there is a higher
reliance on “alternative nonbank loans” (e.g. payday loans and pawnshop loans) in that region (see
Figure 64).
4.3. Transmission Mechanisms
4.3.1. The Conventional Channels
Given this underlying setting of inequality, a key consideration for this paper is whether the chosen path
that Fed policy took to stimulate aggregate demand produced undesirable social impacts as well. The
table below summarizes five primary mechanisms—widely cited by the literature—through which
conventional expansionary monetary policy influences outcomes related to social welfare. Each
mechanism has the potential to amplify inequality, cutting across the population in different ways,
resulting in different groups of winners and losers. The table below focuses solely on the winners and
losers from a theoretical expansionary monetary policy shock, such as that generated by QE.
46
Figure 32: Five Key Transmissions Identified from a Literature Review of QE and Its Social Effects
Channel Mechanism Impact of Expansionary Monetary Policy
Winners Losers
Savings
Redistribution
Low interest rates benefit new borrowers,
those paying debt service; harms savers
with all assets in a money market account;
harms certain financial intermediaries
(banks, maturity transformations). De facto
greater household disposable income for
debtors and less for lenders.
63
New borrowers
(young), debtors (floating
rate/can refinance), recent
graduates (borrowers
paying debt service and/or
invested in long-term
bonds)
Insurance companies,
pension funds, Social
Security fund,
retirees on fixed
Incomes
Financial
Segmentation
64
Proximity to financial markets Agents interacting more
directly with central banks
(financial intermediaries)
More “distant” agents
(those holding fewer
financial assets);
those outside the
financial sector
Income
Composition
Channel
Expansionary monetary policy “exert[s]
upward pressure on the prices of financial
assets”—and “stocks are
disproportionately held by the wealthy.”
65
66
Further, “if expansionary policy raises
profits by more than wages, wealth will
tend to be reallocated toward the already
wealthy.”
67
Households with financial
assets (wealthy)
Households with no
financial assets (non-
wealthy)
Wage
Heterogeneity
Households who rely predominantly on
labor income are less protected from job
loss in a recession
Low- and middle-income,
young
68
, less-skilled benefit
relatively more from the
reduced unemployment
High-income, skilled
benefit less (though it
doesn’t necessarily
entail a loss)
Portfolio
Composition
69
A concern for “unwinding:”
Inflation (especially unanticipated inflation)
erodes the value of cash.
(Wealthier) households
holding nonmonetary assets
(Low and very low-
income) households
holding mostly cash
63
	C.N.	Nwafor,	"Monetary	policy,	inequality	and	financial	markets.",	University	of	Glasgow,	2015.	
64
	See	Coibion	et	al.	(2012)	and	White	(2012)	
65
	K.	Bernoth,	P.J.	König,	B.	Beckers,	and	C.	Forti	Grazzini,	"Quantitative	Easing–What	Are	the	Side	Effects	on	Income	and	Wealth	
Distribution."	DIW	Berlin,	2015	
66
	B.	Bernanke,	"Monetary	policy	and	inequality.",	Brookings	Institute,	June	2015
67
		See	Coibion	et	al.	(2012)	
68
	M.	Elsby,	B.	Hobijn	and	A.	Şahin,	"The	decline	of	the	U.S.	labor	share."	Brookings	Papers	on	Economic	Activity	2013,	no.	2	
(2013):	1-63.	
69
	See	Den	Haan	(2016)
47
4.3.2. Transmission Mechanisms Impaired by the Context
In this section, we acknowledge that the unique setting of the Great Recession of 2008 may have
impaired the functioning of a key transmission mechanism: the restoration of the housing market via the
savings redistribution channel.
U.S., middle-class households predominantly hold their wealth in real estate. The recovery in housing
prices and home values brought about by QE thus theoretically would have benefitted the middle-class
more than other segments of the population compressing the wealth distribution.
70
However the ability of
households to benefit from the recovery was uneven. Beraja et al. (2016) note that areas where home
prices declined the most during the recession were unable to benefit from the lower interest rates: “[It is
relatively more] expensive for borrowers with little home equity to refinance, areas where home prices
declined the most had relatively fewer homeowners who were able to refinance and benefit from the lower
rates... These regions were also the same locations that had suffered large increases in unemployment.”
Cohan (2014) complained that “home mortgages and small business loans are harder to get than ever. If
you’re GE or KKR, getting a loan from a bank is no problem; if you want to buy a new house in Peoria,
good luck to you.”
71
Thus, the beneficial impact of QE on the underlying context of the housing markets
was realized unequally across regions in the United States impairing the ability of this channel to mitigate
inequality.
72
4.4. Literature Review and Interview Findings
Given the complexity of the subject, and the existence of numerous potential confounding factors, a
robust econometric assessment of QE’s social impact was beyond the scope of this paper. For this
reason, we relied on the growing academic literature to inform our conjectures on the role of QE in
amplifying social inequality. In our review, we found considerable variation in researchers’ approaches to
the question, focus, statistical modeling techniques, and assumptions of the counterfactual of what would
have happened in the absence of QE. The studies are summarized below and loosely grouped by focus.
4.4.1. Quantitative Easing Exacerbated Inequality in the United States
Many studies considered the question of whether using the inherently redistributive tool of QE to promote
the equalizing effects of employment and mortgage refinancing generated greater social benefits than
costs. Many, including Montecino and Epstein (2015), have concluded that the poor and middle classes
were not disadvantaged in the short-term, but that the equalizing effects of restored employment and
housing values were not strong enough and were “swamped by the disequalizing effects of equity price
appreciations” that benefitted the wealthy.
70
	G.	Claeys,	Z.	Darvas,	A.	Leandro	and	T.	Walsh.	"The	effects	of	ultra-loose	monetary	policies	on	inequality."	Bruegel	Policy	
Contribution,	June	2015
71
	W.	Cohan,	"How	Quantitative	Easing	Contributed	to	the	Nation’s	Inequality	Problem."	The	New	York	Times,	October	2014.	
72
	See	Beraja	et	al.	(2015)
48
Figure 33a: Literature Review Pointing to Increased Inequality as a Result of QE
Study Data/Model Findings
Pew Charitable Trusts.
"Household Expenditures and
Income." Chartbook. 2016.
BLS Consumer Expenditure Survey
(1996 to 2014)
“As the recovery began, median
household expenditures returned to
pre-crisis levels, but median
household income continued to
contract.”
Montecino and Epstein. "The
Political Economy of QE and the
Fed: Who Gained, Who Lost and
Why Did it End?" 2015.
CRISP stock returns data
Model: Event-style regressions
“QE probably did increase
inequality, as measured, for
example, by the 99/10 percentile
ratio, largely because of the large
impact of equity price increases on
income inequality, and the relatively
small impacts of employment
generation and mortgage
refinancing on reducing inequality.”
Montecino, Juan Antonio and
Gerald Epstein. "Did Quantitative
Easing Increase Income
Inequality?" 2015.
Survey of Consumer Finances
(SCF)
Model: Recentered influence
function (RIF) regressions
“While employment changes and
mortgage refinancing were
equalizing, these impacts were
nonetheless swamped by the large
dis-equalizing effects of equity price
appreciations. Reductions in returns
to short term assets added further to
dis-equalizing processes between
the periods. Bond price
appreciations, surprisingly, had little
distributional impact.”
A paradox: loose and tight monetary
policy are both likely to be dis-
equalizing
Stiglitz, Joseph. "Fed Policy,
Inequality & Quality of
Opportunity." 2015.
N/A “Monetary policy has asymmetric
effects: what workers lose in the
downturn they do not seem to make
up in the recovery…. Given the
importance of inequality in our
society, the Fed needs to pay
attention to these effects.”
Beraja, Martin, Andreas Fuster,
Erik Hurst, and Joseph Vavra.
"Regional Heterogeneity and
Monetary Policy." 2015.
Home Mortgage data, Census data
(ACS), Bureau of Labor Statistics
data, McDash (CRISM), MBA
Refinance Index, Auto purchases
data
Differences in the value of collateral
likely did exacerbate consumption
inequality.
Writing Sample (Long)

More Related Content

Similar to Writing Sample (Long)

Scoping study student wellbeing study 2008
Scoping study   student wellbeing study 2008Scoping study   student wellbeing study 2008
Scoping study student wellbeing study 2008i4ppis
 
Pji pretrial riskassessment prisão
Pji pretrial riskassessment prisãoPji pretrial riskassessment prisão
Pji pretrial riskassessment prisãoccriminais
 
2020 EDUCAUSE Horizon Report ™ Teaching and Learning Edition
2020 EDUCAUSE Horizon Report ™ Teaching and Learning Edition 2020 EDUCAUSE Horizon Report ™ Teaching and Learning Edition
2020 EDUCAUSE Horizon Report ™ Teaching and Learning Edition eraser Juan José Calderón
 
Manual for eq damage evaluation by usa fema
Manual for eq damage evaluation by usa femaManual for eq damage evaluation by usa fema
Manual for eq damage evaluation by usa femaBhim Upadhyaya
 
JMEAKIN - Thèse professionnelle MBA PT0911 V2
JMEAKIN - Thèse professionnelle MBA PT0911 V2JMEAKIN - Thèse professionnelle MBA PT0911 V2
JMEAKIN - Thèse professionnelle MBA PT0911 V2James MEAKIN
 
Hmi 2009 Consumer Report Dec9 2009
Hmi 2009 Consumer Report Dec9 2009Hmi 2009 Consumer Report Dec9 2009
Hmi 2009 Consumer Report Dec9 2009Agencja Social Media
 
Conducting BIAs for UASC in Cairo (RefugePoint 2012)
Conducting BIAs for UASC in Cairo (RefugePoint 2012)Conducting BIAs for UASC in Cairo (RefugePoint 2012)
Conducting BIAs for UASC in Cairo (RefugePoint 2012)Devon Cone
 
Masterproef_Master_Banking_and_Finance_Nicolas_Dierick_Pieterjan_Tilleman
Masterproef_Master_Banking_and_Finance_Nicolas_Dierick_Pieterjan_TillemanMasterproef_Master_Banking_and_Finance_Nicolas_Dierick_Pieterjan_Tilleman
Masterproef_Master_Banking_and_Finance_Nicolas_Dierick_Pieterjan_TillemanPieterjan Tilleman
 
Affine Term-Structure Models Theory And Implementation
Affine Term-Structure Models  Theory And ImplementationAffine Term-Structure Models  Theory And Implementation
Affine Term-Structure Models Theory And ImplementationAmber Ford
 
USGS Sampling and Analysis Plan for 2 Test Water Wells in Pavillion, WY
USGS Sampling and Analysis Plan for 2 Test Water Wells in Pavillion, WYUSGS Sampling and Analysis Plan for 2 Test Water Wells in Pavillion, WY
USGS Sampling and Analysis Plan for 2 Test Water Wells in Pavillion, WYMarcellus Drilling News
 
Typologies of Interventions in Knowledge Exchange and Enterprise Network (KEE...
Typologies of Interventions in Knowledge Exchange and Enterprise Network (KEE...Typologies of Interventions in Knowledge Exchange and Enterprise Network (KEE...
Typologies of Interventions in Knowledge Exchange and Enterprise Network (KEE...University of Wolverhampton
 
Costs-of-Exclusion-and-Gains-of-Inclusion-Report
Costs-of-Exclusion-and-Gains-of-Inclusion-ReportCosts-of-Exclusion-and-Gains-of-Inclusion-Report
Costs-of-Exclusion-and-Gains-of-Inclusion-ReportCaryl Garcia
 
T. Davison - ESS Honours Thesis
T. Davison - ESS Honours ThesisT. Davison - ESS Honours Thesis
T. Davison - ESS Honours ThesisTom Davison
 

Similar to Writing Sample (Long) (20)

Scoping study student wellbeing study 2008
Scoping study   student wellbeing study 2008Scoping study   student wellbeing study 2008
Scoping study student wellbeing study 2008
 
PhD_Thesis_Dimos_Andronoudis
PhD_Thesis_Dimos_AndronoudisPhD_Thesis_Dimos_Andronoudis
PhD_Thesis_Dimos_Andronoudis
 
Pji pretrial riskassessment prisão
Pji pretrial riskassessment prisãoPji pretrial riskassessment prisão
Pji pretrial riskassessment prisão
 
2020 EDUCAUSE Horizon Report ™ Teaching and Learning Edition
2020 EDUCAUSE Horizon Report ™ Teaching and Learning Edition 2020 EDUCAUSE Horizon Report ™ Teaching and Learning Edition
2020 EDUCAUSE Horizon Report ™ Teaching and Learning Edition
 
CASE Network Report 41 - Currency Crises in Emerging Markets - Selected Compa...
CASE Network Report 41 - Currency Crises in Emerging Markets - Selected Compa...CASE Network Report 41 - Currency Crises in Emerging Markets - Selected Compa...
CASE Network Report 41 - Currency Crises in Emerging Markets - Selected Compa...
 
Manual for eq damage evaluation by usa fema
Manual for eq damage evaluation by usa femaManual for eq damage evaluation by usa fema
Manual for eq damage evaluation by usa fema
 
thesis
thesisthesis
thesis
 
JMEAKIN - Thèse professionnelle MBA PT0911 V2
JMEAKIN - Thèse professionnelle MBA PT0911 V2JMEAKIN - Thèse professionnelle MBA PT0911 V2
JMEAKIN - Thèse professionnelle MBA PT0911 V2
 
Thesis-final
Thesis-finalThesis-final
Thesis-final
 
Hmi 2009 Consumer Report Dec9 2009
Hmi 2009 Consumer Report Dec9 2009Hmi 2009 Consumer Report Dec9 2009
Hmi 2009 Consumer Report Dec9 2009
 
ErosionSedimentManual.pdf
ErosionSedimentManual.pdfErosionSedimentManual.pdf
ErosionSedimentManual.pdf
 
Conducting BIAs for UASC in Cairo (RefugePoint 2012)
Conducting BIAs for UASC in Cairo (RefugePoint 2012)Conducting BIAs for UASC in Cairo (RefugePoint 2012)
Conducting BIAs for UASC in Cairo (RefugePoint 2012)
 
Masterproef_Master_Banking_and_Finance_Nicolas_Dierick_Pieterjan_Tilleman
Masterproef_Master_Banking_and_Finance_Nicolas_Dierick_Pieterjan_TillemanMasterproef_Master_Banking_and_Finance_Nicolas_Dierick_Pieterjan_Tilleman
Masterproef_Master_Banking_and_Finance_Nicolas_Dierick_Pieterjan_Tilleman
 
Affine Term-Structure Models Theory And Implementation
Affine Term-Structure Models  Theory And ImplementationAffine Term-Structure Models  Theory And Implementation
Affine Term-Structure Models Theory And Implementation
 
OECD Guidelines on Measuring Subjective Well-being
OECD Guidelines on Measuring Subjective Well-beingOECD Guidelines on Measuring Subjective Well-being
OECD Guidelines on Measuring Subjective Well-being
 
USGS Sampling and Analysis Plan for 2 Test Water Wells in Pavillion, WY
USGS Sampling and Analysis Plan for 2 Test Water Wells in Pavillion, WYUSGS Sampling and Analysis Plan for 2 Test Water Wells in Pavillion, WY
USGS Sampling and Analysis Plan for 2 Test Water Wells in Pavillion, WY
 
Typologies of Interventions in Knowledge Exchange and Enterprise Network (KEE...
Typologies of Interventions in Knowledge Exchange and Enterprise Network (KEE...Typologies of Interventions in Knowledge Exchange and Enterprise Network (KEE...
Typologies of Interventions in Knowledge Exchange and Enterprise Network (KEE...
 
Costs-of-Exclusion-and-Gains-of-Inclusion-Report
Costs-of-Exclusion-and-Gains-of-Inclusion-ReportCosts-of-Exclusion-and-Gains-of-Inclusion-Report
Costs-of-Exclusion-and-Gains-of-Inclusion-Report
 
Masters Thesis_APC
Masters Thesis_APCMasters Thesis_APC
Masters Thesis_APC
 
T. Davison - ESS Honours Thesis
T. Davison - ESS Honours ThesisT. Davison - ESS Honours Thesis
T. Davison - ESS Honours Thesis
 

Writing Sample (Long)

  • 1. 1 The Financial, Economic, Social, and Political Impact of Quantitative Easing in the United States Client: The Markets Room, United States Department of the Treasury Faculty Advisor: Seamus O'Cleireacain James Cashman John Olderman Yiling Pan Maxime Terrieux Audrey Yu David Zhang Shahnoza Zhumanova May 2016 School of International and Public Affairs | SIPA Columbia University in the City of New York
  • 2. 2 ACKNOWLEDGEMENTS This report represents the collective efforts of a team of graduate students at Columbia University's School of International and Public Affairs. Our Capstone assignment—to partner with the Markets Room at The United States Department of the Treasury in an examination of the financial, economic, social and political impacts of quantitative easing—has proved to be an unparalleled learning experience for us. Of course, none of this would have been possible without the Markets Room. We are especially grateful to John Fagan and Albert Lee for designing the terms of reference for this fascinating project and for generously sharing their time, experience and insight with us as we embarked on this unique academic odyssey. Similarly, the resultant research would have been far less rich without the contributions of the many distinguished scholars and industry experts who graciously agreed to be interviewed by the Team for this project, along with the technical expertise of Alexandre Goncalves, PhD candidate, who assisted with our data analysis. Finally, we are indebted to the leadership of Professor Seamus O'Cleireacain, our avuncular faculty advisor. Professor O'Cleireacain served as the ideal moderator for regular team debates on this controversial subject. His profound technical expertise and abundant reservoir of patience were much needed and often tested! In the end, any errors or oversights appearing in the final report belong to the Capstone team and the Capstone team alone. Happy reading!
  • 3. 3 TABLE OF CONTENTS ACKNOWLEDGEMENTS ........................................................................................................................... 2 TABLE OF CONTENTS .............................................................................................................................. 3 EXECUTIVE SUMMARY ............................................................................................................................. 5 1. INTRODUCTION...................................................................................................................................... 6 1.1. Monetary Policymaking in an Era of Quantitative Easing ............................................................................. 6 1.2. Capstone Project Focus, Methodology, and Outline ................................................................................... 10 2. FINANCIAL MARKETS IMPACT ANALYSIS....................................................................................... 12 2.1. QE’s Success: Reducing Long-Term Rates.................................................................................................. 12 2.2. QE’s Unintended Consequences: Six Areas of Concern ............................................................................ 13 2.2.1. Asset Market Dependence on Monetary Policy.......................................................................................... 14 2.2.2. Diminishing Returns to QE Due to Lack of Policymaker Coordination........................................................ 14 2.2.3. Illiquidity in Key Financial Markets.............................................................................................................. 16 2.2.4. Systemic Risk ............................................................................................................................................. 17 2.2.5. International effects..................................................................................................................................... 20 2.2.6. Risks of Unwinding ..................................................................................................................................... 22 2.3. Conclusion: QE and the Financial Markets, a Mixed Success.................................................................... 22 3. REAL ECONOMY IMPACT ANALYSIS................................................................................................ 23 3.1. Consumption.................................................................................................................................................... 23 3.1.1. Expected Results and Transmission Mechanisms ..................................................................................... 23 3.1.2. Observed Outcomes................................................................................................................................... 23 (i) Consumer Credit: Improved Availability and Conditions .................................................................................................... 23 (ii) Impact on Consumer Confidence ...................................................................................................................................... 25 (iii) Overall: Steady, Solid Consumption Recovery ................................................................................................................. 25 3.2. Investment........................................................................................................................................................ 26 3.2.1. Expected Results and Transmission Mechanisms ..................................................................................... 26 3.2.2. Observed Outcomes................................................................................................................................... 26 (i) Financial Conditions for SMEs ........................................................................................................................................... 26 (ii) Impact on Investor Confidence.......................................................................................................................................... 28 (iii) Overall: Partial Investment Recovery................................................................................................................................ 28 3.3. Government Spending .................................................................................................................................... 28 3.3.1. Expected Results and Transmission Mechanisms ..................................................................................... 28 3.3.2. Observed Outcomes................................................................................................................................... 29 3.4. Net Exports....................................................................................................................................................... 31 3.4.1. Expected Results And Transmission Mechanisms..................................................................................... 31 3.4.2. Observed Outcomes................................................................................................................................... 32 3.5. Putting Things Together ................................................................................................................................. 33 3.5.1. Mixed to Positive Impact of QE on Aggregate Demand and Inflation ......................................................... 33 3.5.2. Mixed Recovery in the Labor Market: Any QE Effect?................................................................................ 35 (i) Unemployment ................................................................................................................................................................... 35 (ii) Wages................................................................................................................................................................................ 37 3.5.3. QE and the Real Economy: Unintended Consequences ............................................................................ 39 4. SOCIAL IMPACT ANALYSIS ............................................................................................................... 40 4.1. Assessing Inequality....................................................................................................................................... 40 4.2. Trends in Inequality......................................................................................................................................... 41 4.2.1. Income Inequality........................................................................................................................................ 41 4.2.2. Wealth Inequality ........................................................................................................................................ 43
  • 4. 4 4.2.3. Wealth and Racial/Ethnic Inequality ........................................................................................................... 44 4.2.4. Debt and Consumption Across America..................................................................................................... 44 4.3. Transmission Mechanisms............................................................................................................................. 45 4.3.1. The Conventional Channels........................................................................................................................ 45 4.3.2. Transmission Mechanisms Impaired by the Context .................................................................................. 47 4.4. Literature Review and Interview Findings .................................................................................................... 47 4.4.1. Quantitative Easing Exacerbated Inequality in the United States............................................................... 47 4.4.2. Quantitative Easing Did Not Exacerbate Inequality .................................................................................... 49 4.4.3. Findings from Japan ................................................................................................................................... 51 4.4.4. Long-run Attitudinal and Behavioral Effects................................................................................................ 51 4.5. QE and Inequality: Conclusion and Further Considerations ...................................................................... 53 5. POLITICAL IMPACT ANALYSIS .......................................................................................................... 54 5.1. Politicization of the Fed .................................................................................................................................. 54 5.1.1. The Evolving Relationship Between Congress and the Fed....................................................................... 55 5.1.2. An Increasingly Politicized Presidential Appointment Process ................................................................... 56 5.1.3. A Merging of Monetary and Fiscal Policy.................................................................................................... 57 5.1.4. Social Feedback Loops: the Cause and Effect of the Fed Policy ............................................................... 59 5.2. The Effects of Unconventional Monetary Policy on U.S. Domestic Politics.............................................. 59 5.2.1. Portfolio Rebalance Channel ...................................................................................................................... 59 5.2.2. The Interest Rate Channel.......................................................................................................................... 62 (i) Fiscal Policy........................................................................................................................................................................ 62 6. Conclusion and Topics for Further Consideration........................................................................... 65 6.1. QE in the United States: A Mixed Success ................................................................................................... 65 6.2. Other Concerns Moving Forward................................................................................................................... 67 6.2.1. International Spillover Effects and International Coordination .................................................................... 67 6.2.2. Impact on Pensions and Insurance............................................................................................................. 67 6.2.3. Should the Fed’s Mandate be Refined?...................................................................................................... 68 6.2.4. Was There an Alternative to QE? ............................................................................................................... 68 6.2.5. Risks of Unwinding ..................................................................................................................................... 69 6.3. Closing Remarks ............................................................................................................................................. 70 7. Appendix A: List of Interviewees ....................................................................................................... 71 8. Appendix B: Interview Takeaways (by Industry) .............................................................................. 73 9. Appendix 3: Interviews of Interest ..................................................................................................... 78 9.1. Interview with Professor Joseph Stiglitz....................................................................................................... 78 9.2. Interview with Professor Charles Calomiris ................................................................................................. 79 9.3. Interview with Former New York City Comptroller John Liu....................................................................... 80 10. Appendix D: Additional Figures ....................................................................................................... 81 10.1. Financial Markets Figures ............................................................................................................................ 81 10.2. Real Economy Figures.................................................................................................................................. 85 10.2.1. Consumption............................................................................................................................................. 85 10.2.2. Investment ................................................................................................................................................ 89 10.2.3. Government Spending .............................................................................................................................. 91 10.2.4. Net Exports ............................................................................................................................................... 93 10.2.5. The Labor Market...................................................................................................................................... 95 10.3. Social Impact Figures.................................................................................................................................... 97 Bibliography ............................................................................................................................................. 99
  • 5. 5 EXECUTIVE SUMMARY In the wake of the Lehman Brothers collapse and the ensuing U.S. and global financial crisis, the world economy was on the brink of a major depression. Having rapidly exhausted its conventional monetary policy tools—as the short-term policy rate was already near zero—to stimulate the U.S. economy, the Federal Reserve turned to unconventional monetary policy in the form of large scale asset purchases (“LSAPs”), known as Quantitative Easing (“QE”). QE was intended to provide liquidity to frozen credit markets, lower interest rates of various maturities to stimulate aggregate demand and signal to markets that central bankers were taking decisive steps to avoid the mistakes which led to the Great Depression. While a large body of literature has examined the effects of QE on financial markets, less is known on the other intended and potentially unintended consequences of QE. After revisiting the effects of QE on financial markets, this project will therefore aim to assess the broader economic, social and political impacts of QE in the U.S. This paper will argue that: • QE achieved its expected financial markets goal by restoring stability and lowering interest rates. But in doing so, QE may have sown the seeds for future crises, with increased dependence of financial markets on central bank intervention, illiquidity in certain markets, increased risk taking in certain asset classes, and concerns about exit strategies; • QE had mixed to positive effects on the real economy: GDP contraction was less severe than what the country likely would have experienced in the absence of the policy, aggregate demand was partially stimulated and the economy is now almost back at full employment. Despite this, there remain concerns about structural issues, the lack of full recovery in some credit markets to stimulate investment, and deflationary pressures; • QE more than likely mitigated income inequality in the U.S. That assertion is not unanimously held by those who have studied this question, and it is just as likely that QE exacerbated wealth inequality and consumption inequality over the same period. • QE has both contributed to a greater politicization of the Fed itself and affected the political dynamics of domestic politics. In doing so, we offer evidence that the Fed’s pursuit of unconventional monetary policy has diminished political support for the nation’s central banking system, weakened the Fed’s credibility, and permanently altered underlying distinctions between monetary and fiscal policy in the United States.
  • 6. 6 1. INTRODUCTION 1.1. Monetary Policymaking in an Era of Quantitative Easing In the midst of the “Great Recession” of 2007-2009, and especially in the immediate aftermath of the Lehman Brothers collapse in September 2008, the United States Federal Reserve (“The Fed”) quickly found itself in unfamiliar and potentially dangerous territory. While the Board of Governors of the Fed wished to pursue continued aggressive action to further stabilize financial markets and combat the deflationary pressures of the emerging recession, its conventional monetary policy instrument—targeting the Federal Funds Rate (“FFR”)—had approached the so-called “zero lower bound” (“ZLB”). Figure 1: The Effective Federal Funds Rate Source: The Federal Reserve Prior to the financial crisis, the Fed conducted monetary policy by establishing its policy rate— the FFR—to be consistent with its dual mandate for price stability and full employment. The Fed achieved its target by conducting open-market operations (“OMOs”) involving the purchase or sale of short-term government securities through its primary dealer network. The purchase of securities by the Fed adds to the supply of reserves in the system with a commensurate decline in the effective policy rate while the sale of securities by the Fed reduces the supply of reserves from the system thereby increasing the effective policy rate. In normal market conditions, the Markets Group of the Federal Reserve Bank of New York which implements these OMOs on behalf of the Federal Reserve Open Market Committee (“FOMC”) needs only to make “fine- tuning” adjustments since the credibility of the Central Bank and the efficiency of the market for Fed Funds means a new equilibrium rate is reached almost instantaneously following the announcement of any FOMC policy adjustment.
  • 7. 7 In such an environment, monetary policy works its way through the financial markets to the real economy through a series of channels as depicted in the below exhibit. Figure 2: Monetary Transmission Mechanisms Source: Kuttner & Mosser, 2002 But with the bursting of the real-estate bubble, its propagation to the rest of the economy, and the associated pressure that this placed on the balance sheets of both borrowers and lenders, the Fed found the usual transmission mechanisms for monetary policy to be severely impaired, and its conventional policy tool apparently disabled. Since the FFR was now anchored at the ZLB and traditional bank credit channels were in disarray, the Fed turned to a range of unconventional monetary policies to unfreeze financial and credit markets and ultimately stimulate the economy. Central to the bank’s new monetary policy approach was a program of quantitative easing (“QE”) which the Fed engineered to inject liquidity and ultimately coax lending through the purchase of large quantities of assets from commercial banks and other investors. In some respects, QE can be viewed as merely an adaptation of conventional monetary policy in an environment where the traditional channels for the dissemination of policy have been impaired. Indeed, the Fed used QE as a way to conduct OMOs by focusing on the long-end of the yield curve instead of the short-end. Fed economists theorized that through a combination of portfolio balance and signaling channels, large-scale asset purchases (“LSAPs”) would lower the rates that most directly influence commercial and household savings and
  • 8. 8 investment decisions. As a consensus emerged that the FFR should theoretically be significantly negative, QE was intended to circumvent the ZLB at the short end by dramatically flattening the yield curve. The exhibit below illustrates that “Taylor-rule” models for monetary policy called for significantly negative policy rates beginning in 2008. But with uncertainty around the efficacy of negative interest rates, the Fed needed to devise an alternative strategy to produce further monetary policy accommodation. QE became the central element of that strategy. Figure 3: Taylor Rule Applications (Estimated Policy Rules for the Fed Funds Rate) Source: economistsview.typepad.com/ In the United States, QE was implemented in multiple rounds and accompanied by forward guidance from the Fed to instill marketplace confidence. QE 1 was intended to, “help improve conditions in private credit markets.” 1 QE 2 was launched to “promote a stronger pace of economic recovery and to help ensure that inflation, over time, [remained] at levels consistent with [the Fed’s] mandate.” 2 The short-lived Maturity Extension Program known as “Operation Twist” was designed to drive down interest rates on longer-term bonds. Finally, QE 3 aimed to “put downward pressure on longer-term interest rates, support mortgage markets, and help to make broader financial conditions more accommodative.” 3 The successive rounds of QE are detailed in the below timeline: 1 FOMC press release, March 18, 2009 2 FOMC press release, November 3, 2010 3 FOMC press release, September 13, 2012
  • 9. 9 Figure 4: QE Timeline Source: Capital Economics In total, successive rounds of LSAPs have caused the Fed’s balance sheet to grow exponentially. At the time of this writing, the U.S. Central Bank continues to hold over $4 trillion in assets against its liabilities which consist primarily of the aggregate monetary base. Despite initiating lift-off in December 2015 with a modest hike in both the FFR and what has effectively become its new policy rate, the interest rate on excess reserves (“IOER”), the Fed’s balance sheet looks to remain enormous for the foreseeable future. 4 Our paper seeks to explore these potential consequences and risks. 4 One consequence of QE for monetary policy is that since the supply of reserves is now so immense, “modest changes in the supply of reserves will no longer have much influence on the federal funds rate. Rather than varying the supply of reserves, the Fed now manages the federal funds rate by changing the rate of interest it pays on reserves.” B. Bernanke and D. Kohn, “The Fed’s Interest Payments to Banks,” Brookings Institution, February 2016, http://www.brookings.edu/blogs/ben-bernanke/posts/2016/02/16-fed-interest-payments-banks
  • 10. 10 Figure 5: The Fed’s Domestic Portfolio Source: Federal Reserve 1.2. Capstone Project Focus, Methodology, and Outline Given that the Fed remains far from exiting QE, it is difficult to definitively evaluate the efficiency and efficacy of the program. Though it has become the modern policy instrument of choice in many advanced economies following the Great Recession—the Bank of England followed the U.S. in 2009 and the European Central Bank (“ECB”) launched its own QE program in 2015—quantitative easing remains a largely experimental monetary policy tool. It was only first implemented from 2001 to 2006 by the Bank of Japan (“BoJ”), which resorted to LSAPs to increase the balance sheets of Japanese commercial banks. The novelty of the policy means that there are few longitudinal studies on the topic nor is there a consensus in the academic literature on the models to use to assess its effects. Additionally, the post- recessionary period in the U.S. includes a number of concurrent confounding factors (including secular trends in inequality, skill-biased technological change, and fiscal policy interventions) that further complicate the task of isolating the true effects of quantitative easing. With that in mind, this Capstone Project attempts to evaluate the intended and potentially unintended financial, economic, social, and political effects of the Fed’s unconventional monetary policy in the United States since the onset of the Great Recession in late 2008. We consider the direction and magnitude of the policy’s effects on various economic sectors and evaluate the costs and benefits associated with the policy by relying on (i) academic and marketplace literature identifying conventional and unconventional monetary transmission channels and (ii) insights sourced from interviews with both academics and various sector stakeholders (see list of interviewees in Appendix 1). We begin by examining the impact of each round of QE on the financial markets with an assessment of the size and composition of Federal Reserve asset holdings, asset market and exchange rate trends, as
  • 11. 11 well as inflation expectations. We then define and evaluate transmission mechanisms from the financial sector into the real economy and assess the short-to-medium-term effects of QE on a range of macroeconomic aggregates (including GDP and its main components, inflation, the unemployment rate and wages). Next, the paper draws on its real economy findings to inform an analysis of the social effects of QE identifying transmission mechanisms from the literature and then extending them to consider distributive consequences and “winners” vs. “losers” between various groups (e.g. old vs. young, borrowers vs. savers, wealthy vs. middle-class vs. poor). Evidence of QE’s social impact, such that it exists, is derived largely via an exhaustive literature review of both theoretical and econometric papers and discussions with academics. Additionally, we evaluate the political impact of QE with a focus on interactions between forward guidance, media messaging, and measures of confidence and uncertainty held by the population at large. This segment of the report features the strategic inclusion of QE discussions in political campaigning as well as QE’s potential impact on government spending. Finally, we consider the role of domestic QE policy and the prospect of unwinding in the context of the global political economy.
  • 12. 12 2. FINANCIAL MARKETS IMPACT ANALYSIS 2.1. QE’s Success: Reducing Long-Term Rates Perhaps the best-documented aspect of QE has been the impact of the policy on financial markets. Since LSAPs were intended to stimulate aggregate demand in the domestic real economy by using financial markets as a conduit, the analysis of these markets serves as a springboard towards an examination of QE’s impact on the real economy as well as its social and political impacts. Former Fed Chairman Ben Bernanke has famously described QE as a monetary policy tool that “works in practice but…doesn’t work in theory.” 5 Our research identifies as a consensus opinion the view that QE did indeed reduce long-term interest rates most likely through a portfolio rebalance channel coupled with signaling effects. That said, given the immense size of the LSAPs the reduction in rates appears quite modest and with diminishing results upon each successive round of the program. Figure 6: Cumulative Effects of Bond Purchases on 10 Year Government Yields Source: IMF In addition, the range of emergency facilities created by the Fed to support financial markets at the peak of the panic undeniably played a vital role in restoring some sense of normalcy to what otherwise may have devolved into a prolonged global run on the markets. This effect can be seen in venue after venue, most notably in the market for commercial paper on which many U.S. companies rely for funding ongoing operations. The restoration of stability to this key market following Fed intervention has been one of the clearest successes of U.S. central bank policy in the crisis era. 5 Bernanke’s tongue-in-cheek remark was made during a Brookings Institution interview on January 16, 2014
  • 13. 13 Figure 7: Commercial Paper vs. T-Bill Risk Spread Source: Federal Reserve 2.2. QE’s Unintended Consequences: Six Areas of Concern While QE appears to have achieved its proximate target to reduce long-term interest rates, the policy has certainly not been without cost. Our research on the financial market impact of QE focuses on the potential for unconventional monetary policy to generate collateral damage. To that end, we highlight six concerns regarding QE in this area: 1. Asset Market Dependence on Monetary Policy 2. Diminishing Returns to QE Due to Lack of Policymaker Coordination 3. Illiquidity in Key Financial Markets 4. Systemic risks 5. International effects 6. Unwind risks For example, while the wealth effect of financial market price appreciation was designed by the Fed to boost the larger economy, it may also have induced higher market cross-correlation and systemic risk. Some of these unintended consequences may have been mitigated had the Fed coordinated more closely with other regulatory, fiscal, and international policy makers. We address these six concerns in the following sub-sections.
  • 14. 14 2.2.1. Asset Market Dependence on Monetary Policy One of the key features of the successive rounds of QE is the notably strong correlation between the size of the central bank’s balance sheet and asset prices as epitomized in the below chart. Figure 8: The S&P 500 and Federal Reserve Intervention Source: Advisor Perspectives What on the surface looks to be a prolonged U.S. stock market recovery appears, upon closer inspection, to have been built on an unstable foundation as equity rallies failed to persist between rounds of QE. Similarly, although yields clearly move lower over the life of QE, long-term rates dropped more in between rounds of QE (for example during the summers of 2010 and 2011) than across the respective QE periods. Finally, the ability of QE to reduce yields after QE1 appears generally diminished, and the rise in rates at the conclusion of each round of LSAPs exceeded the declines witnessed at the outset of each respective round. 2.2.2. Diminishing Returns to QE Due to Lack of Policymaker Coordination Another explanation for the diminishing returns achieved by QE2 and QE3 is the Treasury’s increased issuance of longer-term debt since 2008. As shown by Harvard University researchers, 6 more than a 6 R.Greenwood, S. Hanson, J. Rudolph and L. Summers, “Government Debt Management at the Zero Lower Bound,” Hutchins Center on Fiscal and Monetary Policy, September 2014
  • 15. 15 third of the long-term rate impact appears to have been negated by long-term debt issuance on the part of the Treasury. The argument for such competing policies, of course, is that prudent debt management calls for locking in cheap financing during periods of historically low interest rates. Nevertheless, the monetary policy objectives of the Fed and the financing objectives of the Treasury have sometimes clearly run at odds since the onset of the crisis. Figure 9: Contradictory Fed and Treasury Policy Effects Source: Brookings Institution
  • 16. 16 2.2.3. Illiquidity in Key Financial Markets Since 2008, financial market liquidity, particularly as measured by dealer inventories, appears to have dried up in certain key credit markets. This can be attributed to a combination of effects. First, the Fed’s LSAPs have depleted the availability of Treasuries and Agency Mortgages that typically make up repo market collateral. Secondly, the Fed’s regulatory capital policy under Dodd-Frank, 7 created in part to prevent future bubbles, has significantly constrained broker-dealer balance sheets and their ability to intermediate capital markets. Figure 10: Dealer Repo Financing Source: Federal Reserve Furthermore, ultra-low interest rates may have spurred significant shadow banking growth. 8 As a prime example, high-yield markets in the energy sector initially benefitted substantially from cheap debt but have suffered immensely when the 10-year old commodity super-cycle came to a screeching halt in 2015. Despite the best intentions of Dodd-Frank legislation, shadow banking has remained relatively unscathed from regulatory policy as seen in the growing credit provided by non-banks post-2008. However, the Fed and the SEC appear to be catching up on liquidity risks of mutual funds 9 (through “swing pricing”), high 7 R. Anderson, M. Bordo and J. Duca, “Money and Velocity During Financial Crisis: From the Great Depression to the Great Recession,” National Bureau of Economic Research, March 2016 8 N.Valckx, “Shadow Banking Around the Globe: How Large, and How Risky,” International Monetary Fund, October 2014 9 “SEC Proposes Liquidity Management Rules For Mutual Funds And ETFs,” U.S. Securities And Exchange Commission, September 2015
  • 17. 17 yield bond markets (as underscored by the closing of Third Avenue’s credit fund in December 2015), and high-speed trading in treasury markets. 10 Figure 11: The Importance of Shadow Banking Source: Financial Stability Board 2.2.4. Systemic Risk While more liquid than corporate bond markets, equity markets are also showing signs of overheating as measured by average long-term cyclically adjusted PE (“CAPE”) ratios. For example, Nobel Laureate Robert Shiller’s CAPE suggests that U.S. equity markets are trading at a substantial premium to what might be considered “fair value.” In a similar spirit, one market participant with whom we spoke highlighted a divergence between “quality” as measured by an equity factor index and the broader stock market. While quality outperformed dramatically in the period leading up to the financial crisis, the reverse has been true ever since—perhaps a signal that markets are currently driven only by the direction of Fed policy as opposed to macroeconomic fundamentals. 10 L. Brainard, “An Update on the Outlook, Liquidity, and Resilience,” speech held at the Institute of International Bankers Annual Washington Conference, Washington, D.C., March 2016
  • 18. 18 Figure 12: Trends in the Quality of Equity Indexes Source: Bloomberg Finance LP, in “Epsilon Theory”, Salient Partners, April 2016
  • 19. 19 Like the stock market declines which occurred in the middle of 2010 and 2011, systemic risk in the U.S. financial system (measured by the Cleveland Financial Stress Index) has also periodically peaked in between rounds of QE, as illustrated below: Figure 13: Cleveland Financial Stress Index Source: Federal Reserve Bank of St. Louis (2015) Similarly, financial sector capital shortfall risk (the amount that financials would need to cover risk- weighted assets under financial sector-wide stress according to NYU VLAB) spiked each of the three times that a QE round ended. This can be seen in the index levels during the summers of 2010 and 2011, as well as the end of 2014. As an indication of the risks which may await the Fed as it moves towards interest rate normalization, the measure peaked once again following the Fed’s 2015 rate increase. Figure 14: U.S. Total Financial Systemic Risk (SRISK—US$ Billion) Source: New York University, V-Lab (2016)
  • 20. 20 Furthermore, average cross-asset correlation has increased by two thirds as seen by IMF 11 research below. The benefits of diversification, it seems, may well have been consumed by central banking policy. Figure 15: Cross-Asset Correlations (median daily) and Correlation Heat Map Source: IMF Balance sheet deleveraging may also explain the lack of bank lending from the demand side, where the incentive to borrow at a lower rate in a slowing economy is not enough to overcome a negative household/corporate balance sheet. Another form of transmission breakdown may be the declining of securitization in mortgage and auto markets since the 2008 crisis. 12 2.2.5. International Effects While the Fed is primarily concerned with domestic issues, it cannot ignore the consequences of its policies on the rest of the world and conversely, the impact of foreign factors on domestic issues. 11 “IMF Global Financial Stability Report: Navigating Monetary Policy Challenges and Managing Risks,” International Monetary Fund, April 2015 12 E. Benmelech, R. Meisenzahl, R. Ramcharan, “The Real Effects of Liquidity During the Financial Crisis: Evidence from Automobiles,” National Bureau of Economic Research, April 2016
  • 21. 21 Figure 16: Dollar Index Source: Federal Reserve Bank of St. Louis, Authors’ Computations While it initially strengthened at the peak of the financial crisis, the dollar index weakened after QE1 and QE2, but strengthened back as QE3 and competing QE programs in Europe and Japan were implemented. This may have had consequences for the U.S. trade balance (see section 4.4) as well as for U.S. trading partners. More specifically, while U.S. trade partners may not have been hurt by a weakening dollar (during QE1 and 2) owing to a number of other structural strengths, the more recent dollar strengthening may be more of a concern. First, countries with high levels of dollar-denominated debt are substantially vulnerable to the dollar strengthening. Secondly, dollar appreciation reflects large capital outflows from emerging markets to the U.S. (further fueled by the prospect of Fed’s policy rate hike), which can be met by central bank intervention in the form of sales of foreign reserves (of U.S. Treasuries in particular) (see Figure 48). In turn, the sale of foreign reserves by central banks to defend weakening currencies may have two negative effects on the U.S.: first, it contains growth stimulation in foreign economies, which may affect foreign demand in the U.S.; second, it means that ownership of U.S. Treasuries moves from foreign central banks to private investors. As the latter are more rate-sensitive than the former, it follows that volatility and instability in global and U.S. financial markets are likely to increase. 80 85 90 95 100 105 110 115 120 1-Mar-07 1-Sep-07 1-Mar-08 1-Sep-08 1-Mar-09 1-Sep-09 1-Mar-10 1-Sep-10 1-Mar-11 1-Sep-11 1-Mar-12 1-Sep-12 1-Mar-13 1-Sep-13 1-Mar-14 1-Sep-14 1-Mar-15 1-Sep-15 Index. 1997 = 100 Trade-Weighted Dollar Index Trade Weighted U.S. Dollar Index: Broad (Jan 1997=100) QE1 QE2 Operation Twist QE3 Tapering End of QE3
  • 22. 22 2.2.6. Risks of Unwinding The Fed mentioned in the minutes of its September 2015 meeting that economic effects would be minimal if it unwound its $4.5 trillion balance sheet when “certain levels of the federal funds rate, such as 1 percent or 2 percent, were reached.” 13 If the Fed unloads $200 Billion of its balance sheet each year for 20 years after the fed funds rate reaches 2%, then it may be theoretically successful in normalizing QE without disrupting the natural rate of money growth ($200 Billion is less than 2% of $12 Trillion of M2). However, in the new world of QE, if IOER is the preferred tool for monetary policy then the Fed would also be paying tens if not hundreds of billions of dollars to banks during each of the 20 years. It is easy to see how this would be politically uncomfortable for the Fed. But even before reaching the problem of paying enormous IOER, the Fed may take a long time to reach its desired 1-2% FFR range due to its preferred gauge of inflation—core PCE. Core PCE not only tends to be low among various inflation measures due to responses from businesses (BEA) as opposed to consumers (e.g. BLS’s CPI, see Figure 49), adjustments for improvements in product quality, but also excludes energy and food, the latter of which may account for as much as 15-40% of U.S. households whose income is under $30,000. 14 Therefore, living costs for the poor may become disproportionately high before the Fed starts normalizing its balance sheet (after which actual inflation—and thus living costs for the poor will finally come down). 2.3. Conclusion: QE and the Financial Markets, a Mixed Success As our research has indicated, emergency measures taken at the height of the global financial crisis proved instrumental in stabilizing financial markets on the brink of collapse. In turn, the Fed’s QE program, which was designed for the real economy, relied on the financial markets as its conduit. While the program of LSAPs lowered long-term interest rates as designed, it may have opened a Pandora’s box of financial market risks. Those risks may yet prove manageable and may be deemed to be worth the cost if QE indeed has managed to achieve its real economy objectives. In the section that follows, we consider the success of the policy in that arena. 13 Board of Governors of the Federal Reserve System, “Minutes of the Federal Open Market Committee,” Federal Reserve, September 16-17, 2015 14 J. Feldmann, “The Fed as a Moral Enterprise,” Penn State University Press, 2012
  • 23. 23 3. REAL ECONOMY IMPACT ANALYSIS When the Fed extended QE1 in March 2009 to the purchase of long-term Treasuries, it stated, “the Committee anticipates that policy actions [...] will contribute to a gradual resumption of sustainable economic growth” 15 . Similarly, when QE2 was announced in November 2010, the Fed justified the expansion of the program “to promote a stronger pace of economic recovery.” 16 Growth resumption—or economic recovery—both require growth in the main components of GDP’s aggregate demand: consumption, private investment, government spending and next exports. This section examines the effect of QE on these 4 factors and the resulting impact on key variables of the economy (GDP, inflation and employment). 3.1. Consumption 3.1.1. Expected Results and Transmission Mechanisms Historically, consumption has been the engine of the U.S. Economy. In the wake of the Lehman collapse, there were fears that massive job cuts and a depressed economic environment would lead to severe consumption contraction. It was therefore key for the Fed to stimulate consumption and maintain its role as the driver of Aggregate Demand. Directly or indirectly, QE was therefore expected to ensure consumption remained robust. There are three main channels through which QE is believed to work on consumption: • The interest rate channel: with both short and long-term interest rates low, consumers can benefit from (i) an intertemporal substitution effect, moving forward consumption which is now cheaper to finance (ii) an income effect if low rates boost aggregate demand, lead to higher employment and higher wages and (iii) a wealth effect via the increase in value of assets (which either allows for revision of consumption smoothing or increases borrowing capabilities with higher collateral) • The consumer credit channel: for the interest channel to operate, it needs to be transmitted at the same time by the various lending institutions. In particular, the consumer credit channel needs to effectively transform QE into more liquidity at low rates to consumers • The signaling effect: QE is expected to restore consumer confidence by convincing the public that the Fed is taking decisive action to ensure that rates remain low for long in order to stimulate the real economy (including consumption) 3.1.2. Observed Outcomes (i) Consumer Credit: Improved Availability and Conditions After recording a rather steady increase of about 5% per annum (“p.a”) in the 5 years prior to the onset of the global financial crisis, consumer credit availability dropped by an average 4% in 2009 and 1% in 2010, but recovered to its pre-crisis level by the end of 2011. The total decrease was contained by the limited 15 See Footnote 1 16 See Footnote 2
  • 24. 24 drop and subsequent strong recovery in the availability of non-revolving credit, which has represented the overwhelmingly larger share of total consumer credit since the crisis. 18 Figure 17: Changes in Consumer Credit Flows Source: Federal Reserve, Authors’ Computations (2016) Recovery in the consumer credit market is further evidenced by the improvement in financial conditions, both in amounts loaned and average maturities. Average auto loans, which are representative of durable goods, increased from $25,000 to $28,000 (+12%) between the end of 2012 and the end of 2015, while the average maturity increased by 5 months (+8.2%) to over 66 months in the same period. And as expected, consumer interest rates followed the downward trend in yields on Treasuries, with both personal consumption loans and auto loans rates declining at a pace similar to that of long-term Treasuries. 18 Non-revolving credit includes loans for motor vehicles, boats, trailers, mobile homes, education, vacations.
  • 25. 25 Figure 18: Consumer Financing Rates Source: Federal Reserve, Authors’ Computations (2016) (ii) Impact on Consumer Confidence While consumer confidence slumped at the height of the crisis, it started recovering as QE1 was extended to Treasury security purchases and quickly recovered as interest rates kept falling (see Figure 54)—suggesting that rather than behaving as a lagged effect of QE, consumer confidence remained rather healthy and consumption didn’t suffer much during the crisis, which supported the U.S. economy. (iii) Overall: Steady, Solid Consumption Recovery Overall, with increased lending and lower interest rates, consumption remained rather steady and the key engine of the U.S. economy (consistently accounting for about 2/3 of GDP). Contraction was -2% in 2008 and a mere -0.20% in 2009, only to recover to an average 2.3% p.a in the 6 years thereafter. Consumption remained robust for both durable and non-durable goods (with the notable growth of recreational goods and vehicles), as well as for services, supported by robust growth in healthcare services (see Figure 53). On that basis, it would seem that QE had positive effects in supporting consumption. While one could argue that it simply ensured continuity rather than spurring a full-blown recovery, QE appears to have helped to offset a collapse in one of the structural pillars of the U.S. economy.
  • 26. 26 3.2. Investment Gross private investment was the hardest hit by the crisis, especially investment in the housing sector in the wake of the real estate collapse in 2006. Although it only accounted for 18% of total U.S. GDP in the decade preceding the crisis, investment dropped by 2.2% in 2007, 15.9% in 2008 and 11.0% in 2009. The bulk of the drop came from fixed investment while previously accumulated inventories were being sold. Unsurprisingly, residential investment experienced a severe contraction (-15.4% p.a on average between 2006 and 2010) which accounted for much of the drop in investment until 2008/9 when the non-residential part of investment (investment in physical structures, equipment as well as software) also crashed. 3.2.1. Expected Results and Transmission Mechanisms Against this backdrop, QE was expected to stimulate investment through three main channels in a manner very similar to the transmission channels operating on consumption: • The interest rate channel: lower interest would allow for (i) lower funding/borrowing costs and (ii) increase the value of assets owned by firms (or homes owned by individuals) both of which make borrowing easier and cheaper for businesses which in turn can be incentivized to bring their planned investment forward • The credit channel: just like consumption, the credit channel needs to operate effectively for the interest rate channel to be transmitted • The signaling effect: also like consumption, low interest rates are expected to signal support to real investments and can therefore improve business confidence 3.2.2. Observed Outcomes (i) Financial Conditions for SMEs Small and medium enterprises (SMEs) form the backbone of the United States economy. In the U.S., SMEs make up 99% of all firms, account for about 50% of GDP as well as over 50% of private sector employees, and generate over 65% of net new private sector jobs. 19 SMEs fund their expansion or operations by borrowing primarily from traditional lending institutions 20 . Credit markets enable loan demand from corporations—including SMEs (as well as individuals) and supply from financing institutions—to support SMEs and in turn, the larger domestic economy. In the face of the 2008-2009 credit crunch, the credit channel was seriously impaired and access to funding, especially for SMEs, deteriorated. How can central bank intervention have an impact on restoring the credit channel? In a seminal paper (Bernanke and Gertler, 1995), ex-Fed Chairman Bernanke argued that monetary policy could be transmitted through the credit channel as actions by the central bank can impact the creditworthiness of borrowers—and therefore demand for credit—as well as the net worth and balance sheet of lenders—thereby affecting loan supply. Well aware of the key role of the credit channel, a few months into the crisis then-Chairman Bernanke sought to encourage community banks to continue lending to SMEs, saying “I want to conclude by 19 S. Firoozmand, P. Haxel, E. Jung and K. Suominen, “State of SME Finance in the United States in 2015,” TradeUp Capital Fund and Nextrade Group, LLC, March 2015 20 Small banks represent 52% of credit sources as of 2015 with large banks contributing 42%. - “2015 Small Business Credit Survey,” Federal Reserve System, March 2016
  • 27. 27 encouraging you as community bankers to operate prudently in the current environment, but not to let fear drive your decisions.” 21 But with contracted demand, uncertain future and increased regulation (especially with requirements to raise capital adequacy ratios), community banks didn’t play the countercyclical role Bernanke would have hoped for. In the three years following the Lehman collapse, credit conditions tightened and loan supply fell—in fact, some studies find that the loan supply shock contributed to 50% of the GDP growth contraction in 2008/9 in the U.S. 23 Could the Fed have done more in that respect? That is what Professor Joseph Stiglitz argued during our interview, stressing that there was “no way QE could work without fixing the bank credit channel.” Figure 19: SME Financing Source: Federal Reserve, Authors’ Computations While interest rates steadily declined with the successive rounds of QE, the data show two important elements: (i) the net percentage of banks tightening credit standards to SMEs surged in 2008/9 with a commensurate drop in loan supply (ii) although credit standards substantially loosened after QE1, demand for loans also resumed and the number of businesses facing difficulties to meet their borrowing needs actually increased post QE1. This figure almost doubled during QE2 (from 5% to 10% of 21 B. Bernanke, “The Financial Crisis and Community Banking,” speech held at the Independent Community Bankers of America's National Convention and Techworld, Phoenix, Arizona, March 2009 23 G. Wehinger, “SMEs and the credit crunch: Current financing difficulties, policy measures and a review of literature,” OECD Journal: Financial Market Trends, Volume 2013/2, 2014
  • 28. 28 businesses claiming their borrowing needs were unsatisfied) before returning to pre-crisis levels as QE was eventually halted. Both of these elements reflect the well-documented fact that SMEs suffer more than large corporates from credit drying up and have to wait longer to benefit from a recovery and credit easing. 24 Given this, one could argue either that (i) QE was not very effective (or even failed), (ii) QE is very slow to operate or (iii) recovery of borrowing demand is due to factors other than QE (general recovery/growth inside the economic cycle). (ii) Impact on Investor Confidence While business confidence slumped at the peak of the crisis in 2009, it slowly picked up as interest rates kept declining—although it is still lower today than its pre-crisis level (see Figure 57). One important aspect gathered from our research is that business behavior isn’t necessarily very responsive to Fed announcements. While low interest rates and credit availability do help, businesses have been rather cautious to invest since 2008/9. Such caution is an immediate result of the crisis and due to larger structural issues which, taken together, hamper aggregate demand and against which QE or any monetary policy might have only moderate effects. (iii) Overall: Partial Investment Recovery Here we distinguish between two main components of investment: • Residential investment: Studies 25 find that QE1 reduced the spread between mortgage rates and U.S. Treasuries (for the same given maturities) by 100bp, which in turn is found to lead to an increase of 6.2% in residential investment. Looking at national data, residential investment indeed increased by an annual average of 6.8% in the 5 years following QE1 (and a part of QE2), although it was somewhat subdued and only contributed to an average 23% of the recovery in investment • Non-residential investment followed a similar recovery, with an average 5.7% annual increase since 2011 driven by strong growth in equipment (see Figure 56). 3.3. Government Spending 3.3.1. Expected Results and Transmission Mechanisms While QE was expected to directly impact consumption and investment, it was also implicitly supposed to support aggregate demand via an increase in government spending. For instance, in its announcement of QE1 extension in 2009, the FOMC referred to fiscal stimulus as one of the main factors supporting growth resumption. 26 There are two ways through which QE supported the fiscal stimulus: • Increased revenue: Despite much lower interest rates, the expanded balance sheet of the Fed produced substantially higher revenue from interest earned on the securities held. Interest earned by the Fed is returned to the U.S. Treasury and accounted for in the federal budget. From 2000 to 2008, the average annual revenue transferred from the Fed to U.S. Treasury amounted to $26.5 billion but swelled to an average $78 billion in the seven following years (peaking at $99 billion in 2014). It is worth noting that such increased revenue come from the Government’s own borrowings (through Treasuries) and therefore means that the government is borrowing a 24 Ibid 25 K. Walentin, “Quantifying the macroeconomic effects of large-scale asset purchases” in Den Haan (2016) 26 See Footnote 1
  • 29. 29 substantial amount of its debt for free, raising the question of “financial repression” (see 6.2.2) and related potential distortions by QE of the true costs of government spending. Overall however, more fiscal space gives more room for public spending which, in times of crisis such as the Great Recession, is usually needed (at least temporarily) to prevent the economy from sinking. • Lower funding costs: cheaper funding costs are expected to incent the federal government—as well as states and cities—to increase public spending for capital and infrastructure projects, healthcare, education and other social programs. 3.3.2. Observed Outcomes QE therefore increased fiscal space both on the revenue and cost side, and together with a rapid political response, most likely made it easier and more politically acceptable (and marketable to opposing stakeholders) for the government to pass programs such as the Troubled Asset Relief Program (TARP) and the American Recovery and Reinvestment Act (ARRA) which made up the bulk of the fiscal stimulus in 2008/9. As such, the fiscal deficit increased from an annual average of 1.5% from 2000 to 2008 to an average of 8.4% in the 4 subsequent years (with a peak at almost 10% in 2009).
  • 30. 30 Figure 20: U.S. Fiscal Deficit Source: Congressional Budget Office, Authors’ Computations On the whole, without the fiscal stimulus, which was in part supported by QE, Blinder and Zandi (2015) find that in 2010, U.S. real GDP would have been 3.5% lower than its actual level, the unemployment rate would have peaked at almost 11% (or 2.4 million fewer jobs), the Great Recession would have lasted much longer and key macroeconomic data would have only been catching up with actual levels around 2014-2015. However, there are several caveats to the potential benefits QE might have in terms of increased government spending: • Mandatory spending: Around 55% of the U.S. budget is destined to be spent on mandatory outlays, i.e. those expenditures (most of which are related to Social Security) which are based on law rather than the actual budgeting process. As such, QE’s potential role in increasing discretionary spending (which makes up about 35% of the budget—the remainder being used to pay interest on government debt) is constrained by the space granted to mandatory outlays; • A high share of discretionary spending goes to National Defense: over 50% (and more in the 1980s) of discretionary spending has been devoted to national defense for the past 20 years, meaning that the scope for increased spending in areas such as infrastructure or education is further limited;
  • 31. 31 • Political gridlock: in spite of the substantial fiscal stimulus of 2008/9, the consensus from both our literature review and interviews is that more long-term investment in capital, infrastructure or education projects should have been made. Unfortunately, each of these areas for investment are politically divisive and didn’t see high enough of a boost because of the U.S. political gridlock; • Debt sustainability: QE may stimulate spending and increase the budget deficit, but this leads to an increase in debt ratios which over time can become too high for debt to be sustainable. While this may not be the case in the U.S. yet, the U.S. debt-to-GDP ratio increased from less than 65% in 2007 to more than 100% in 2015. As such, any further fiscal stimulus which might have been supported by QE could have raised concerns about debt sustainability The data show that government spending increased in 2008, 2009 and 2010 but at a modest 2.3% annual average, with most of the efforts coming from the federal government while state and local authorities barely increased spending. Starting in 2011, public spending actually shrank by an annual 1.6%. Interestingly, both defense and non-defense related items saw an increase in public spending, with a slightly faster pace for the former (5.9% vs. 5.7% annual average) between 2008 and 2010. Public expenses in transportation, healthcare, and—to an even greater extent—education, grew at higher than usual levels during the same period, but contracted thereafter. Given that each account for only 5 to 10% of discretionary spending, any increase in public spending would have to have been much more substantial to massively impact overall government spending. In fact, two elements stand out when we look at fiscal policies while the different rounds of QE were implemented: • While a number of states and cities took advantage of low interest rates to bring forward new investments, most actually proved cautious and used low rates to refinance loans or increase short-term operational spending rather than new spending. This is illustrated in Figure 59. • Fiscal stimulus turned to austerity in 2011 at a time when unemployment was still far from its natural rate. In line with other research, Blinder and Zandi (2015) argue the temporary stimulus should have lasted longer (in their view, until unemployment was less than 1 percentage point above its natural rate) and, as such, was ended much too early. 3.4. Net Exports 3.4.1. Expected Results And Transmission Mechanisms De facto, QE should have an impact on net exports thanks to the exchange rate channel: lower interest rates in the U.S. imply a nominal depreciation of the U.S. Dollar which, with low inflation, should lead to a real depreciation and in turn boost exports, reduce imports, and lead to imported inflation. This theory is however subject to several caveats: • U.S. monetary policy impacts the U.S. dollar via the Exchange Rate channel when all else is held constant; to the extent other countries adopt similar monetary policies (which could lead to some currency wars) to stimulate their own exports, the impact of monetary policy on the dollar will be much weaker than expected • A large share of global trade is done in dollars and foreign exporters invoice U.S. importers in dollars; as such, a real dollar depreciation has no effect on imports
  • 32. 32 • Structural changes in the global value chain weaken the impact of the dollar depreciation on exports: when several parts of a given product come from every corner of the world, the finished product, even if sold by U.S. exporters, will lose a part of its “dollar” value • Structural changes in Global trends such as the Great Recession or the recent global slowdown in demand from Emerging Markets will affect U.S. trade sometimes much more than changes in the dollar on the Exchange rate market 3.4.2. Observed Outcomes On that basis, as mentioned in the financial section of this report, while the dollar index weakened after QE1 and QE2, it strengthened after QE3 as the ECB and BoJ were implementing their own QE programs. At the same time, it is clear from the chart below that while QE1 was implemented, both exports and imports substantially decreased, reflecting a global slowdown in the wake of the financial crisis which propagated from the U.S. to the rest of the world—which supports our argument above that global structural trends, rather than monetary policies, have a larger impact on the trade balance. Figure 21: U.S. Trade Balance Source: Bureau of Economic Analysis, Authors’ Computations All in all, the trade deficit declined by about 45% (to $410 billion) between 2007 and 2010, but widened by 14% in 2011 alone as QE2 was implemented. During the Great Recession, imports contracted more than exports. Although after the global slowdown in 2008/9 both exports and imports resumed their upward trend, the trade deficit remained steady around its crisis level of $450 billion. Indeed, the increase in net imports of most goods was offset by the increase in net exports of services and by a substantial decline in
  • 33. 33 net imports of oil in the wake of the shale oil boom in the U.S. in the late 2000s. It is therefore difficult to argue that QE had any substantial impact on net exports given the multitude of confounding factors which are likely to have impacted such component of U.S. GDP with much more potency. 3.5. Putting Things Together 3.5.1. Mixed to Positive Impact of QE on Aggregate Demand and Inflation Having looked at the four main elements of aggregate demand, we now have a better overall picture of what happened since the onset of the crisis: as illustrated by the graph below, we observe that (i) consumption was rather resilient and remained the engine of the U.S. economy (accounting for over ⅔ of GDP) through the crisis (ii) investment suffered the most but slowly recovered while (iii) fiscal stimulus was lower than what was likely required (iv) the trade deficit declined, but the impact of QE on Net Exports is questionable. As a result, U.S. GDP has been steadily recovering at more than 2% p.a since 2009, narrowing the output gap closer to pre-crisis levels. Nevertheless, core inflation (one of the Fed’s two key objectives) has been almost consistently below the 2% target. Figure 22: Main Macroeconomic Indicators Source: Bureau of Economic Analysis, Authors’ Computations
  • 34. 34 While quantifying the actual effects of QE on GDP is challenging, several studies have attempted to do so with varying results—summarized in the table below: Figure 23: QE Macroeconomic Effects: a Summary Source: Authors, based on the works cited in the table Most of these studies find rather positive effects on the real economy from one or several rounds of QE. For instance, Chung et al. (2012) found that QE1 and 2 may have raised GDP by almost 3 percentage points and created 2 million jobs while Fuhrer and Olivier (2011) estimated that QE2 alone increased GDP by close to 1 percentage point and created 700,000 jobs. But others (Chen et al, 2011; Wu and Xia, 2014) find much more moderate effects. In fact, one study (Yi, 2014) suggests that for QE to have any real impact on the real economy, asset purchases need to be even larger (more than 50% of GDP) and last for several years. According to some of the economists interviewed as part of our research, the very first round of QE was effective to unfreeze financial markets, but there is little evidence that QE or any other type of monetary policy actually change anything about the business cycle. Although subject to shocks, the economy, by nature, is driven by trends and shifts in behavior and confidence (the “animal spirits” dear to Keynes) and as such, fiscal or monetary policies are only accommodating, not determining. Taken to an extreme, this line of thought may be associated with the concept of the “Phoenix Miracle” (Calvo et al., 2006), a phenomenon whereby output “rises from its ashes” outside the formal credit market, further suggesting the potentially limited impact of QE in restoring aggregate demand. 27 27 Note that the concept of the “Phoenix Miracle” is associated with emerging markets only, and is itself subject to criticism in T. Mayer, M. Biggs and A. Pick, “The myth of the ‘Phoenix Miracle’,” VOX CEPR's Policy Portal, May 2010, http://voxeu.org/article/myth-phoenix-miracle
  • 35. 35 Overall however, one can reasonably argue that QE had at least some positive effects on aggregate demand and inflation. At the same time, QE may have contributed to the fall in unemployment—but to what extent did QE really impact the labor market? The following section attempts to answer that question. 3.5.2. Mixed Recovery in the Labor Market: Any QE Effect? (i) Unemployment In theory, QE should have an effect on unemployment through the work of firms and corporations. With unconventional monetary policy, money becomes an “inexpensive asset”, and with low interest rates companies have an increased ability to borrow money and grow their businesses. This expansion should create new jobs and reduce unemployment. As employment is a lagging economic indicator, it takes longer to recover in comparison with other variables. To analyze the effect of the QE on employment, we reviewed the changes in both the U-3 and U-6 unemployment rates. Figure 24: Various Measures of Unemployment Source: U.S. Bureau of Labor Statistics According to the data, the official unemployment rate (U-3) level declined from 10% at the peak of the recession in 2010 to 5% in March 2016. Similarly, the U-6 measure (which includes part-time and discouraged/marginally attached workers) reached 9.8 % in March 2016, down from a peak of 17%, a reflection that overall, the economy has seen a substantial progress in adding jobs 28 . As employment levels recover from the deepest recession since the Great Depression, the private sector added 12.8 28 N. Irwin, "Quantitative Easing Is Ending. Here’s What It Did, in Charts." The New York Times. October 2014. http://www.nytimes.com/2014/10/30/upshot/quantitative-easing-is-about-to-end-heres-what-it-did-in-seven- charts.html?_r=0
  • 36. 36 million private-sector jobs over “64 straight months of job growth, the longest streak of private-sector job creation on record. The unemployment rate is down to 5%, a seven-year low” 29 . The goal to reach a 6.5 % unemployment rate that was set as a benchmark by the Fed has been achieved with the headline unemployment rate currently resting at about 5%. However, the unemployment rate does not always provide the clearest picture of the labor market. The employment-to-population ratio, an indicator of the number of people with a job to the total number of eligible workers, suggests that the initial rounds of QE did not have as major an effect as the Fed would have liked although the ratio started to improve steadily beginning in 2014 30 . Figure 25: Employment-to-Population Ratio Source: U.S. Bureau of Labor Statistics, Federal Reserve Bank of St. Louis At the same time, part of the fall in unemployment rate could be explained by the decrease in the labor force participation rate. To be sure, the participation rate decline “predates the Great Recession, due to several structural changes that also include aging of the workforce.” 31 In 2015, the participation rate was equal to 62.6%, its lowest level since October 1977 (see Figure 62). The Current Population Survey provides three main reasons for the participation rate decline: retirement, disability, and “more people in school—with a discouraged worker falling into any of those categories.” Out of the three, it would seem that the primary reason has to do with the retirement, as more people tend to retire during a recession. 32 Given the structural nature of the change in participation rate, there appears little that QE could directly do to influence this dimension of the labor market, but in stimulating growth and helping job creation, QE contributed to the drop in unemployment rates as well as an uptick in participation rate. In March 2016, 29 E. Jacobs, "The Declining Labor Force Participation Rate: Causes, Consequences, and the Path Forward - Equitable Growth." Washington Center for Equitable Growth, July 2015 30 S. McCourt, "Quantitative Easing", Meketa Investment Group, September 2013 31 See Footnote 27 32 A. Schrager, “Why Labor Force Participation is still so low,” Bloomberg, Januray 2015, http://www.bloomberg.com/news/articles/2015-01-19/why-labor-force-participation-is-still-so-low
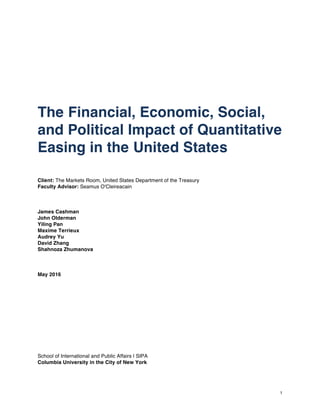
  • 37. 37 the participation rate increased to 63%, showing a return to the job market by those previously discouraged in yet another positive sign of economic recovery. 33 In analyzing the effects of QE on the labor market, it is worth distinguishing between two periods: (i) during the labor market downturn (January 2008-February 2010), “employment losses occurred throughout the economy, but were concentrated in mid-wage and higher-wage industries while (ii) during the recovery (February 2010 to February 2014), employment gains have been concentrated in lower- wage industries.” 34 This is illustrated by Figure 26 below: Figure 26: Net Change in Private Sector Employment (in thousands) Source: National Employment Law Project 2014 The above findings therefore raise the question of which sectors benefited the most from the recovery. If QE supported the job recovery, it is worth stressing that most of the new positions “created were low- paying jobs in the service sector, like the restaurant and hospitality industry, and not the high-paying manufacturing, mining and construction jobs that the Fed was hoping for. The number of people giving up and no longer looking for jobs exploded to a historic record, artificially bringing the unemployment rate down.” 35 The distribution of job losses and their following creation have also been skewed. “Higher-wage industries—like accounting and legal work—shed 3.6 million positions during the recession and have added only 2.6 million positions during the recovery. But lower-wage industries lost two million jobs, then added 3.8 million.” 36 (ii) Wages While QE might have supported job recovery, it is also important to analyze the evolution of nominal and real wages in the aftermath of the Great Recession. While real wage stagnation predates the crisis, it would seem that wage growth has been very slow during the recovery. This trend is consistent with the 33 A. Kiersz, "The Labor Force Participation Rate Falls to a 38-year Low", Business Insider, July 2015, http://www.businessinsider.com/labor-force-participation-rate-falls-to-38-year-low-2015-7 34 “Tracking the low-wage recovery: industry employment & wages,” National Employment Law Project, April 2014, http://www.nelp.org/publication/tracking-the-low-wage-recovery-industry-employment-wages/ 35 E. Moy, "A Half Cheer for Quantative Easing", Newsmax Finance, April 2015, http://www.newsmax.com/t/finance/article/552765 36 A. Lowrey, "Recovery Has Created Far More Low-Wage Jobs Than Better-Paid Ones", The New York Times, April 2014. http://www.nytimes.com/2014/04/28/business/economy/recovery-has-created-far-more-low-wage-jobs-than- better-paid-ones.html?_r=0.
  • 38. 38 above data showing that most of the job recovery is in low-wage positions which may suggest that QE might have been insufficient to boost wages and might in fact have knock-on effects on income distribution (a point which we detail further in our social analysis section). In recent years, there has been downward pressure on wages as employers have been unable or unwilling to offer considerable wage growth to attract workers they need despite the economic recovery. 37 “In the last few months, nominal wage growth appears to be picking up slightly, but remains significantly below levels consistent with the Fed’s 2% target and likely trends in potential productivity.” 38 The growth in real wages has been concentrated at the top of the wage distribution, with little to no change between middle and bottom groups for the last 16 years, which shows that wage inequality continues its 35-year rise trend. 39 In 2015, real wages grew 2.1 % while nominal wage growth was equal to 2.2%. While this level of wage growth might seem positive, real wage growth is artificially inflated by a drop in inflation (inflation fell from 1.6% in 2014 to 0.1 % in 2015) and nominal wage growth of this level remains “below a level where workers would reap the benefits of economic growth.” 40 Figure 27: Wage Growth Source: Economic Policy Institute In fact, there are two reasons why low inflation should not be considered as a driver of real wages and living standards. First of all, low inflation could be explained by a large decline in certain goods, mostly gas and oil, which are volatile by nature. Secondly, lower levels of inflation could be dampening the rise in nominal (and therefore real) wages. 41 While the debate over the actual impact of QE on the labor market remains unsettled, the consensus is positive, with Bivens (2015) noting that “as bad and unequal as wage growth was since the onset of the 37 E. Gould, "Wage Inequality Continued Its 35-year Rise in 2015", Economic Policy Institute, March 2016 38 Ibid. 39 Ibid. 40 Ibid. 41 Ibid.
  • 39. 39 Great Recession, it would have been even slower and less equal had the Fed not pursued its easy money policies i.e., compared to a counterfactual of no change in fiscal policy in response to a recession, monetary stimulus reduces inequality significantly.” 42 3.5.3. QE and the Real Economy: Unintended Consequences Overall, while QE stimulated GDP and potentially inflation and employment, it may have produced at least two unintended consequences: • Negative distributional effects: with limited growth in real wages, especially at the bottom of the distribution, and recovery in asset prices disproportionately in favor of the wealthy, it may be argued that QE increased social inequalities; • Increased attention and scrutiny on the Fed: its unconventional monetary policies have drawn heightened attention to the functioning and policies of the Fed which has sometimes been accused of a lack of transparency and/or of monetizing the government deficit; The following two sections will explore these issues in more depth, starting with the social impact of QE. 42 J. Bivens, “Gauging the Impact of the Fed on inequality during the Great Recession,” Brookings Institution, June 2015
  • 40. 40 4. SOCIAL IMPACT ANALYSIS The Fed’s monetary policy objectives—”to promote effectively the goals of maximum employment, stable prices and moderate long-term interest rates"—directly relate to the social well-being of the nation, but these objectives were directly challenged by the recession and global financial crisis. 43 The collapse of the housing market led to the erosion of home values, systemic risk in the banking and financial sectors severely curtailed lending and financing opportunities, and a recessionary environment impaired confidence in both consumers and firms leading to high rates of unemployment. Proponents of QE point to the great social costs that would have ensued if, having exhausted its conventional monetary policy instrument, the Fed had not taken further action and employed unconventional monetary policy to stimulate aggregate demand, repair and mitigate risk in the broken markets, and support economic recovery and jobs. 44 Critics of QE argue that any benefits were outweighed by the inherently regressive effects of any expansionary monetary policy targeting economic recovery. In the context of existing inequality and particularly given the means by which QE operates (expanding bank balance sheets), there is a general view that “a policy which generates a robust and sustained recovery will benefit those at the top more than those at the bottom.” 45 In this section, we evaluate these two points of view as we attempt to determine whether social inequality on the whole was exacerbated by the Fed’s implementation of QE. We begin with a brief consideration of inequality in America, explore theoretical considerations on how QE can affect social outcomes, conduct a review of the small but growing literature specific to the subject, and finish with our own conjectures on the matter. 4.1. Assessing Inequality Inequality is familiar ground both to sociologists, for whom equality of opportunity is a central concern, and to economists, who define inequality in terms of the distribution of income, wealth, and consumption (Cowell, 2011; and Piketty, 2014). In this study, we consider inequality using the economic framework. We do not ignore the importance of inequality of opportunity but take the view expressed by Fed Chairwoman Janet Yellen that opportunity follows from “access to economic resources” and that “inequality of outcomes can exacerbate inequality of opportunity.” 46 While consumption, income, and wealth are interrelated, each has different implications for social welfare. Inequality of wealth communicates the extent to which “the lottery of birth becomes an increasingly important determinant of living standards.” 47 Income inequality is widely cited as data is readily available and can be observed not only between households but also over the course of a single individual’s lifetime 48 . This facilitates consideration of both cross-household and intergenerational inequality. 49 43 “The Federal Reserve's Dual Mandate,” Federal Reserve Bank of Chicago, May 2016, https://www.chicagofed.org/publications/speeches/our-dual-mandate 44 “Troubled Asset Relief Program : Treasury's Framework for Deciding to Extend TARP Was Sufficient, But Could Be Strengthened for Future Decisions,” United States Government Accountability Office, June 2010 https://fraser.stlouisfed.org/scribd/?title_id=5049&filepath=/docs/historical/fct/gao_report_tarp_20100630.pdf#scribd-open 45 C. Giles, “Debate rages on quantitative easing’s effect on inequality,” Financial Times, October 2014, http://www.ft.com/intl/cms/s/0/c630d922-586f-11e4-942f-00144feab7de.html, 46 J. Yellen, "Perspectives on Inequality and Opportunity from the Survey of Consumer Finances." Speech held At the Conference on Economic Opportunity and Inequality, Federal Reserve Bank of Boston, Boston, Massachusetts October 17, 2014. 47 O. Attanasio, E. Hurst and L. Pistaferri, “The evolution of income, consumption, and leisure inequality in the U.S., 1980-2010,” National Bureau of Economic Research, April 2012 48 According to the theory of consumption smoothing, an individual making little early in her career finances consumption until her peak earning years, after which, in the latter phase of her life, she spends down her accrued wealth.
  • 41. 41 However, many consider consumption inequality to be the best representation of social welfare. This is because consumption expresses a household’s actual ability to attain a certain standard of living via the purchase of a minimal “basket” of goods and services to support that style of living. 50 While consumption itself is a function of both wealth and income, research shows that changes in income and consumption inequality have mirrored each other in the past few decades. 51 52 Since the early 2000s, measures of income and wealth in the United States have exhibited the largest disparities, with the majority of wealth and shares of income concentrated in the top strata of the population. 53 Figure 27: Gini Coefficient Evaluations of Inequality in the United States (1985-2010) Source: Consumer Expenditure Surveys, Fisher et al. (2013) 4.2. Trends in Inequality 4.2.1. Income Inequality Income inequality in the United States has persisted since 1993, and has grown at an increasing rate since 2000. 54 As of 1993, “mean income among the top quintile [has been] at least twice as large as the mean income in the fourth quintile,” with dispersions in the shares of household income held by each quintile increasing over the entire time period. The lowest quintile (earning the least) experienced an 11.1% fall in income share since 1993, while the top-most quintile has seen a steady increase in its share of income since 2000. 55 A comparison of income ratios between the 90th-10th (top-to-bottom of the income distribution), 90th-50th (top-to-middle), and 50th-10th (top-to-bottom) percentiles further highlights 49 D. DeSilver "The Many Ways to Measure Economic Inequality", Pew Research Center, May 2015. http://www.pewresearch.org/fact-tank/2015/09/22/the-many-ways-to-measure-economic-inequality/ 50 Ibid. 51 Ibid. 52 M. Aguiar and Mark Bils, “Has consumption inequality mirrored income inequality?,” National Bureau of Economic Research, February 2011. 53 See Footnote 47 54 S. Donovan, “A Guide to Describing the Income Distribution.” Congressional Research Service, February 2015 55 Ibid.
  • 42. 42 the increasing inequality. While “all ratios increased between 1993 and 2013, indicating that the income groups are moving farther apart from each other,” the 90-10 ratio showed the greatest increase “from 10.6 to 12.1 (or approximately a 14% increase).” 56 Figure 28: (a) Trends in Income Inequality Cumulative Change in Quintile Shares of Total Income Since 1993 (top) and Cumulative Percentage Change in income Ratios, 1993-2013 (bottom) Source: Donovan (2015) While growth in the mean income of all quintiles either declined or remained constant between 2007-2008 (the period coinciding with the Great Recession), only the top-most quintile recovered some of that loss in the period from 2011 onward. 57 56 Ibid. 57 Ibid.
  • 43. 43 Figure 29: (b) Trends in Income Inequality—Mean Quintile Income (Pre-Tax Cash Income Received by Households in 2013 CPI-U-RS dollars) Source: Donovan (2015) 4.2.2. Wealth Inequality Desilver (2015) notes that “wealth inequality tends to be much higher than either income or consumption inequality, but it also tends to not vary as much over time.” 58 Despite that, New York University economist Edward Wolff found significant increases in shares of wealth held by the top 5% of households from 1962 to 2013. The share of wealth held by the top 1% rose from 33.4% in 1962 to 36.7% in 2013, while the holdings of the next-wealthiest 4% of households rose from 21.2% in 1962 to 28.2% in 2013. 59 By contrast, the wealth share of the bottom 40% did not grow and instead fluctuated between 1.5% of growth and -0.9% of loss from 1962 to 2013. Together, these corroborate Pew Research Center research that found “that the wealth gap between upper-income people and the rest of America was the widest on record in 2013”—with only those in the upper income brackets seeing wealth gains in the post-recession period. 60 Figure 30: Trends in Wealth Inequality Source: PEW Research Center 58 See Footnote 47 59 Ibid. 60 Ibid.
  • 44. 44 4.2.3. Wealth and Racial/Ethnic Inequality Further analysis from the Pew Research Center finds that wealth inequality has also widened along racial and ethnic lines, with the median wealth of white households at 13 times that of black households in 2013—as compared to eight times the wealth in 2010. 61 This may be related to the disparate abilities of households to benefit from the recovery of asset prices. “White households are much more likely than minority households to own stocks directly or indirectly through retirement accounts” and decreases in asset ownership from 2010-2013 “tended to be proportionally greater among minority households” (as homeownership rates among minority households “decreased from 50.6% in 2010 to 47.4% in 2013”). 62 This adds another dimension to the question of QE and social inequality. Figure 31: Growth of Racial/Ethnic Wealth Gaps Since the Great Recession Source: PEW Research Center 4.2.4. Debt and Consumption Across America In addition to the more traditional measures of consumption discussed in the Real Economy portion of this paper, a consideration of debt patterns can shed light on consumption inequality. Ratcliffe et al. (2014) characterize debt and access to credit as a critical “stabilizing force” for households and communities as both support the financing of essential purchases, houses, and education. Ratcliffe et al. (2014) make use of 2013 TransUnion credit data encompassing mortgage debt and “non-mortgage debt” (vehicle loans, education loans, credit card debt, and debt in collections—which can include unpaid medical and utility bills)—to examine the spatial distribution of debt in America in the post-QE recovery. While QE undoubtedly help to restore home values and financing opportunities, the extent of the recovery varied across the nation. The authors find high concentrations of mortgage debt both along the west and east coasts as well as in the Mountain states. In the “affluent, high-cost [coastal] markets,” that metric 61 R. Kochhar and R. Fry, "Wealth Inequality Has Widened along Racial, Ethnic Lines since End of Great Recession." Pew Research Center, December 2014, http://www.pewresearch.org/fact-tank/2014/12/12/racial-wealth-gaps-great- recession/ 62 Ibid.
  • 45. 45 alone is not a signal of financial distress, as “debt is actually fairly low relative to home prices” in those regions. However, the debt is a concern in the middle of the country, where there are high levels of “mortgage debt relative to home values”—likely due to weaker economic recovery resulting in “lower growth in housing values relative to mortgage amounts and differences in foreclosures and strategic defaults” in those regions. Finally, the study finds signs of great “financial stress” in “the lower-income and less populous” central South. In that region, levels of mortgage debt relative to income are low, and the ratio of “nonmortgage debt” relative to income is the highest in the nation. Additionally, there is a higher reliance on “alternative nonbank loans” (e.g. payday loans and pawnshop loans) in that region (see Figure 64). 4.3. Transmission Mechanisms 4.3.1. The Conventional Channels Given this underlying setting of inequality, a key consideration for this paper is whether the chosen path that Fed policy took to stimulate aggregate demand produced undesirable social impacts as well. The table below summarizes five primary mechanisms—widely cited by the literature—through which conventional expansionary monetary policy influences outcomes related to social welfare. Each mechanism has the potential to amplify inequality, cutting across the population in different ways, resulting in different groups of winners and losers. The table below focuses solely on the winners and losers from a theoretical expansionary monetary policy shock, such as that generated by QE.
  • 46. 46 Figure 32: Five Key Transmissions Identified from a Literature Review of QE and Its Social Effects Channel Mechanism Impact of Expansionary Monetary Policy Winners Losers Savings Redistribution Low interest rates benefit new borrowers, those paying debt service; harms savers with all assets in a money market account; harms certain financial intermediaries (banks, maturity transformations). De facto greater household disposable income for debtors and less for lenders. 63 New borrowers (young), debtors (floating rate/can refinance), recent graduates (borrowers paying debt service and/or invested in long-term bonds) Insurance companies, pension funds, Social Security fund, retirees on fixed Incomes Financial Segmentation 64 Proximity to financial markets Agents interacting more directly with central banks (financial intermediaries) More “distant” agents (those holding fewer financial assets); those outside the financial sector Income Composition Channel Expansionary monetary policy “exert[s] upward pressure on the prices of financial assets”—and “stocks are disproportionately held by the wealthy.” 65 66 Further, “if expansionary policy raises profits by more than wages, wealth will tend to be reallocated toward the already wealthy.” 67 Households with financial assets (wealthy) Households with no financial assets (non- wealthy) Wage Heterogeneity Households who rely predominantly on labor income are less protected from job loss in a recession Low- and middle-income, young 68 , less-skilled benefit relatively more from the reduced unemployment High-income, skilled benefit less (though it doesn’t necessarily entail a loss) Portfolio Composition 69 A concern for “unwinding:” Inflation (especially unanticipated inflation) erodes the value of cash. (Wealthier) households holding nonmonetary assets (Low and very low- income) households holding mostly cash 63 C.N. Nwafor, "Monetary policy, inequality and financial markets.", University of Glasgow, 2015. 64 See Coibion et al. (2012) and White (2012) 65 K. Bernoth, P.J. König, B. Beckers, and C. Forti Grazzini, "Quantitative Easing–What Are the Side Effects on Income and Wealth Distribution." DIW Berlin, 2015 66 B. Bernanke, "Monetary policy and inequality.", Brookings Institute, June 2015 67 See Coibion et al. (2012) 68 M. Elsby, B. Hobijn and A. Şahin, "The decline of the U.S. labor share." Brookings Papers on Economic Activity 2013, no. 2 (2013): 1-63. 69 See Den Haan (2016)
  • 47. 47 4.3.2. Transmission Mechanisms Impaired by the Context In this section, we acknowledge that the unique setting of the Great Recession of 2008 may have impaired the functioning of a key transmission mechanism: the restoration of the housing market via the savings redistribution channel. U.S., middle-class households predominantly hold their wealth in real estate. The recovery in housing prices and home values brought about by QE thus theoretically would have benefitted the middle-class more than other segments of the population compressing the wealth distribution. 70 However the ability of households to benefit from the recovery was uneven. Beraja et al. (2016) note that areas where home prices declined the most during the recession were unable to benefit from the lower interest rates: “[It is relatively more] expensive for borrowers with little home equity to refinance, areas where home prices declined the most had relatively fewer homeowners who were able to refinance and benefit from the lower rates... These regions were also the same locations that had suffered large increases in unemployment.” Cohan (2014) complained that “home mortgages and small business loans are harder to get than ever. If you’re GE or KKR, getting a loan from a bank is no problem; if you want to buy a new house in Peoria, good luck to you.” 71 Thus, the beneficial impact of QE on the underlying context of the housing markets was realized unequally across regions in the United States impairing the ability of this channel to mitigate inequality. 72 4.4. Literature Review and Interview Findings Given the complexity of the subject, and the existence of numerous potential confounding factors, a robust econometric assessment of QE’s social impact was beyond the scope of this paper. For this reason, we relied on the growing academic literature to inform our conjectures on the role of QE in amplifying social inequality. In our review, we found considerable variation in researchers’ approaches to the question, focus, statistical modeling techniques, and assumptions of the counterfactual of what would have happened in the absence of QE. The studies are summarized below and loosely grouped by focus. 4.4.1. Quantitative Easing Exacerbated Inequality in the United States Many studies considered the question of whether using the inherently redistributive tool of QE to promote the equalizing effects of employment and mortgage refinancing generated greater social benefits than costs. Many, including Montecino and Epstein (2015), have concluded that the poor and middle classes were not disadvantaged in the short-term, but that the equalizing effects of restored employment and housing values were not strong enough and were “swamped by the disequalizing effects of equity price appreciations” that benefitted the wealthy. 70 G. Claeys, Z. Darvas, A. Leandro and T. Walsh. "The effects of ultra-loose monetary policies on inequality." Bruegel Policy Contribution, June 2015 71 W. Cohan, "How Quantitative Easing Contributed to the Nation’s Inequality Problem." The New York Times, October 2014. 72 See Beraja et al. (2015)
  • 48. 48 Figure 33a: Literature Review Pointing to Increased Inequality as a Result of QE Study Data/Model Findings Pew Charitable Trusts. "Household Expenditures and Income." Chartbook. 2016. BLS Consumer Expenditure Survey (1996 to 2014) “As the recovery began, median household expenditures returned to pre-crisis levels, but median household income continued to contract.” Montecino and Epstein. "The Political Economy of QE and the Fed: Who Gained, Who Lost and Why Did it End?" 2015. CRISP stock returns data Model: Event-style regressions “QE probably did increase inequality, as measured, for example, by the 99/10 percentile ratio, largely because of the large impact of equity price increases on income inequality, and the relatively small impacts of employment generation and mortgage refinancing on reducing inequality.” Montecino, Juan Antonio and Gerald Epstein. "Did Quantitative Easing Increase Income Inequality?" 2015. Survey of Consumer Finances (SCF) Model: Recentered influence function (RIF) regressions “While employment changes and mortgage refinancing were equalizing, these impacts were nonetheless swamped by the large dis-equalizing effects of equity price appreciations. Reductions in returns to short term assets added further to dis-equalizing processes between the periods. Bond price appreciations, surprisingly, had little distributional impact.” A paradox: loose and tight monetary policy are both likely to be dis- equalizing Stiglitz, Joseph. "Fed Policy, Inequality & Quality of Opportunity." 2015. N/A “Monetary policy has asymmetric effects: what workers lose in the downturn they do not seem to make up in the recovery…. Given the importance of inequality in our society, the Fed needs to pay attention to these effects.” Beraja, Martin, Andreas Fuster, Erik Hurst, and Joseph Vavra. "Regional Heterogeneity and Monetary Policy." 2015. Home Mortgage data, Census data (ACS), Bureau of Labor Statistics data, McDash (CRISM), MBA Refinance Index, Auto purchases data Differences in the value of collateral likely did exacerbate consumption inequality.