SlideShare a Scribd company logo
1 of 1
Download to read offline
Financial Performance FY 2015
31.5
31.0
30.5
30.0
29.5
29.0
28.5
28.0
27.5
27.0
INPATIENT ACTIVITY
Patient discharges (in thousands)
2012 2013 2014 2015
1030
1000
960
930
900
870
840
810
780
OUTPATIENT ACTIVITY
Patient visits (in thousands)
2012 2013 2014 2015
	 2015	 2014
BALANCE SHEET
Assets
Total current assets	 834,366	894,050
Capital assets, net	 2,136,862	1,913,427
Cash restricted for hospital construction	 -	6,744
Other assets	 462,150	266,546
Total assets	 3,433,378	3,080,767
Liabilities and Net Assets
Total current liabilities	 366,633	283,370
Long-term debt and capital leases, net of current portion	 833,600	837,536
Pension liability	 993,664	670,964
Other liabilities	 412,401	506,228
Total liabilities	 2,606,298 	 2,298,098
Net assets	 827,080 	 782,669
Total liabilities and net assets	 3,433,378	3,080,767
INCOME STATEMENT
Operating Revenue
Net patient service revenue	 2,579,844	2,308,685
Other operating revenue	 103,608	 81,588
Total operating revenue	 2,683,452	2,390,273
Operating Expenses
Salaries and employee benefits	 1,319,439	1,094,283
Supplies and purchased services	 1,010,821	909,932
Depreciation and amortization	 128,034	98,523
Other	 156,584	128,131
Total operating expenses	 2,614,878	2,230,869
Income from operations	 68,574	159,404
Nonoperating revenues, net	 5,391	22,400
Net income	 73,965	181,804
ADDITIONAL INFORMATION
Uncompensated/undercompensated care	 140,650 	 175,329
Reinvestment in facilities and equipment	 358,502	 382,466
Fiscal years ending June 30, 2015, and June 30, 2014 (dollars in thousands).
Financials do not include UCSF Benioff Children’s Hospital Oakland.
THE YEAR IN REVIEW
UCSF Medical Center and UCSF Benioff Children’s Hospital
San Francisco had several notable financial achievements
throughout 2015.
n	 UCSF Medical Center at Mission Bay opened on schedule and
	 under budget.
n	 Total net income was $74 million for UCSF Medical Center and UCSF
	 Benioff Children’s Hospital San Francisco.
n	 Nearly $360 million was invested in capital projects and equipment.
n	 A total of $154 million was contributed to the research and education
	 mission of UC San Francisco.
n	 More than $140 million of uncompensated care was provided to patients.

More Related Content

Similar to UCSF Annual Report 2015

Annual financial report 2014
Annual financial report 2014Annual financial report 2014
Annual financial report 2014AT&S_IR
 
Zigoscar CorporationComparative Income.docx
Zigoscar CorporationComparative Income.docxZigoscar CorporationComparative Income.docx
Zigoscar CorporationComparative Income.docxdanielfoster65629
 
Abengoa's 2014 economic and financial report
Abengoa's 2014 economic and financial reportAbengoa's 2014 economic and financial report
Abengoa's 2014 economic and financial reportAbengoa
 
2014 Annual Report - Separate financial statements February 18, 2015]
2014 Annual Report - Separate financial statements February 18, 2015]2014 Annual Report - Separate financial statements February 18, 2015]
2014 Annual Report - Separate financial statements February 18, 2015]Edison S.p.A.
 
Jan Feb Mar AprRevenuesNet Patient Revenue 46,450 41,9.docx
Jan Feb Mar AprRevenuesNet Patient Revenue 46,450 41,9.docxJan Feb Mar AprRevenuesNet Patient Revenue 46,450 41,9.docx
Jan Feb Mar AprRevenuesNet Patient Revenue 46,450 41,9.docxpriestmanmable
 
Contoh Laporan Keuangan
Contoh Laporan KeuanganContoh Laporan Keuangan
Contoh Laporan KeuanganFerry Rinaldi
 
Nordnet's report presentation, January-September 2015
Nordnet's report presentation, January-September 2015Nordnet's report presentation, January-September 2015
Nordnet's report presentation, January-September 2015Nordnet
 
Square pharmaceuticals ltd
Square pharmaceuticals ltdSquare pharmaceuticals ltd
Square pharmaceuticals ltdAl Mamun
 
Financial InformationIn this worksheet, you will recreate both the
Financial InformationIn this worksheet, you will recreate both theFinancial InformationIn this worksheet, you will recreate both the
Financial InformationIn this worksheet, you will recreate both theChereCheek752
 
Nordnet report presentation January-December 2015
Nordnet report presentation January-December 2015Nordnet report presentation January-December 2015
Nordnet report presentation January-December 2015Nordnet
 
Sanofi India: Q2CY14 net rises 12.30%, maintain buy
 Sanofi India: Q2CY14 net rises 12.30%, maintain buy Sanofi India: Q2CY14 net rises 12.30%, maintain buy
Sanofi India: Q2CY14 net rises 12.30%, maintain buyIndiaNotes.com
 
Finacial Statement Analysis
Finacial Statement AnalysisFinacial Statement Analysis
Finacial Statement AnalysisAklas Chowdhury
 
C O N S O L I D A T E D F I N A N C I A L S T A T E M .docx
C O N S O L I D A T E D  F I N A N C I A L  S T A T E M .docxC O N S O L I D A T E D  F I N A N C I A L  S T A T E M .docx
C O N S O L I D A T E D F I N A N C I A L S T A T E M .docxhumphrieskalyn
 
AT&T Financial and Operational Results
AT&T Financial and Operational ResultsAT&T Financial and Operational Results
AT&T Financial and Operational Resultsfinance1
 

Similar to UCSF Annual Report 2015 (20)

Annual financial report 2014
Annual financial report 2014Annual financial report 2014
Annual financial report 2014
 
Zigoscar CorporationComparative Income.docx
Zigoscar CorporationComparative Income.docxZigoscar CorporationComparative Income.docx
Zigoscar CorporationComparative Income.docx
 
Abengoa's 2014 economic and financial report
Abengoa's 2014 economic and financial reportAbengoa's 2014 economic and financial report
Abengoa's 2014 economic and financial report
 
OXYS Investor Presentation
OXYS Investor PresentationOXYS Investor Presentation
OXYS Investor Presentation
 
2014 Annual Report - Separate financial statements February 18, 2015]
2014 Annual Report - Separate financial statements February 18, 2015]2014 Annual Report - Separate financial statements February 18, 2015]
2014 Annual Report - Separate financial statements February 18, 2015]
 
Jan Feb Mar AprRevenuesNet Patient Revenue 46,450 41,9.docx
Jan Feb Mar AprRevenuesNet Patient Revenue 46,450 41,9.docxJan Feb Mar AprRevenuesNet Patient Revenue 46,450 41,9.docx
Jan Feb Mar AprRevenuesNet Patient Revenue 46,450 41,9.docx
 
Contoh Laporan Keuangan
Contoh Laporan KeuanganContoh Laporan Keuangan
Contoh Laporan Keuangan
 
Nordnet's report presentation, January-September 2015
Nordnet's report presentation, January-September 2015Nordnet's report presentation, January-September 2015
Nordnet's report presentation, January-September 2015
 
FINANCIAL ANALYSIS OF NOVARTIS INDIA
FINANCIAL ANALYSIS OF NOVARTIS INDIAFINANCIAL ANALYSIS OF NOVARTIS INDIA
FINANCIAL ANALYSIS OF NOVARTIS INDIA
 
Financial management
Financial managementFinancial management
Financial management
 
Square pharmaceuticals ltd
Square pharmaceuticals ltdSquare pharmaceuticals ltd
Square pharmaceuticals ltd
 
Acc 291 acc291
Acc 291 acc291Acc 291 acc291
Acc 291 acc291
 
Financial InformationIn this worksheet, you will recreate both the
Financial InformationIn this worksheet, you will recreate both theFinancial InformationIn this worksheet, you will recreate both the
Financial InformationIn this worksheet, you will recreate both the
 
Nordnet report presentation January-December 2015
Nordnet report presentation January-December 2015Nordnet report presentation January-December 2015
Nordnet report presentation January-December 2015
 
Sanofi India: Q2CY14 net rises 12.30%, maintain buy
 Sanofi India: Q2CY14 net rises 12.30%, maintain buy Sanofi India: Q2CY14 net rises 12.30%, maintain buy
Sanofi India: Q2CY14 net rises 12.30%, maintain buy
 
Roll no. 20
Roll no. 20Roll no. 20
Roll no. 20
 
Slide Sidang Tugas Akhir
Slide Sidang Tugas AkhirSlide Sidang Tugas Akhir
Slide Sidang Tugas Akhir
 
Finacial Statement Analysis
Finacial Statement AnalysisFinacial Statement Analysis
Finacial Statement Analysis
 
C O N S O L I D A T E D F I N A N C I A L S T A T E M .docx
C O N S O L I D A T E D  F I N A N C I A L  S T A T E M .docxC O N S O L I D A T E D  F I N A N C I A L  S T A T E M .docx
C O N S O L I D A T E D F I N A N C I A L S T A T E M .docx
 
AT&T Financial and Operational Results
AT&T Financial and Operational ResultsAT&T Financial and Operational Results
AT&T Financial and Operational Results
 

UCSF Annual Report 2015

  • 1. Financial Performance FY 2015
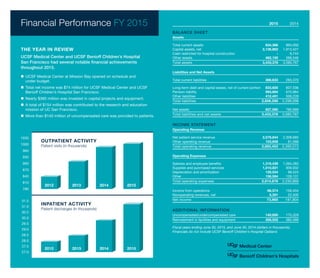
 31.5 31.0 30.5 30.0 29.5 29.0 28.5 28.0 27.5 27.0 INPATIENT ACTIVITY Patient discharges (in thousands) 2012 2013 2014 2015 1030 1000 960 930 900 870 840 810 780 OUTPATIENT ACTIVITY Patient visits (in thousands) 2012 2013 2014 2015 2015 2014 BALANCE SHEET Assets Total current assets 834,366 894,050 Capital assets, net 2,136,862 1,913,427 Cash restricted for hospital construction - 6,744 Other assets 462,150 266,546 Total assets 3,433,378 3,080,767 Liabilities and Net Assets Total current liabilities 366,633 283,370 Long-term debt and capital leases, net of current portion 833,600 837,536 Pension liability 993,664 670,964 Other liabilities 412,401 506,228 Total liabilities 2,606,298 2,298,098 Net assets 827,080 782,669 Total liabilities and net assets 3,433,378 3,080,767 INCOME STATEMENT Operating Revenue Net patient service revenue 2,579,844 2,308,685 Other operating revenue 103,608 81,588 Total operating revenue 2,683,452 2,390,273 Operating Expenses Salaries and employee benefits 1,319,439 1,094,283 Supplies and purchased services 1,010,821 909,932 Depreciation and amortization 128,034 98,523 Other 156,584 128,131 Total operating expenses 2,614,878 2,230,869 Income from operations 68,574 159,404 Nonoperating revenues, net 5,391 22,400 Net income 73,965 181,804 ADDITIONAL INFORMATION Uncompensated/undercompensated care 140,650 175,329 Reinvestment in facilities and equipment 358,502 382,466 Fiscal years ending June 30, 2015, and June 30, 2014 (dollars in thousands). Financials do not include UCSF Benioff Children’s Hospital Oakland. THE YEAR IN REVIEW UCSF Medical Center and UCSF Benioff Children’s Hospital San Francisco had several notable financial achievements throughout 2015. n UCSF Medical Center at Mission Bay opened on schedule and under budget. n Total net income was $74 million for UCSF Medical Center and UCSF Benioff Children’s Hospital San Francisco. n Nearly $360 million was invested in capital projects and equipment. n A total of $154 million was contributed to the research and education mission of UC San Francisco. n More than $140 million of uncompensated care was provided to patients.