1. A studyonFundFlowandTrendAnalysiswithreferenceto
KarnatakaStateOpenUniversity 1
CHAPTER:1
EXECUTIVE SUMMARY
Karnataka Housing Board (KHB) established under Karnataka Housing Board
Act 1962 as a successorto Mysore Housing Board constituted in 1956.
The primary objective of KHB is ‘to make such schemes and carry out such
works as are necessaryof dealing with and satisfactionthe need of housing
accommodations’.
With this directive KHB endeavors to provide housing to the people of
Karnataka at affordable costand therefore recognized as the most important
agency for housing throughout Karnataka.
TECHNIQUES USED TO ANALYSE FINANCIAL STATEMENTOF
THE KHB FUND FLOW ANALYSIS
The fund flow analysis is undertaken to highlight changes in the financial
condition of a business concern over a given period of time.
The fund flow statement is a statement, which shows the movement of funds
and is a report of the financial operations of the business undertaking.
It indicates various means by which funds were obtained during a particular and
the ways in which these funds were employed. In simple words, it is a statement
of sources and applications of funds.
TREND ANALYSIS
The financial statements may be analyzed by computing trends of series of
information. This method determines the direction upwards or downwards and
involves the computation of the percentage relationship that each statement item
bears to the same item in base year.
2. A studyonFundFlowandTrendAnalysiswithreferenceto
KarnatakaStateOpenUniversity 2
The information for the number of years is taken up and one year, generally the
first year, is taken as a base year. The figures of the base year are taken as 100
and trends ratios for other years are calculated on the basis of baseyear.
OBJECTIVESOF THE STUDY
To know the changes in working capital during the last few years in the
company and the reason for the changes in Working Capital.
To know the various sources from which the funds are raised and the
application of those finds in the company.
To evaluate the financial statements of the Board over the past5 years.
LIMITATIONS OF THE STUDY
The findings of the study and recommendations are applicable only to
KARNATAKA HOUSING BOARD, Head office of Bangalore.
Analysis, projections and conclusion are arrived at depending on the
information provided by the board.
3. A studyonFundFlowandTrendAnalysiswithreferenceto
KarnatakaStateOpenUniversity 3
CHAPTER:2
INDUSTRYPROFILE
Housing is one of the basic needs of the mankind in terms of safety, security,
self-esteem, social status, cultural identity, satisfaction and achievement. It is
one of the major determinants of economic wellbeing. The development of
satisfactory housing has always been the priority in both formulation and its
implementation.
A rapid rise in population results in higher demand of dwelling units for
residential purpose. This coupled with the growth in the household formation
and increased rural urban migration resulting from non-availability of
opportunities in the rural areas has resulted in severe pressure on urban
infrastructure in recent years. The consequencehas been over-crowding and
unhealthy living environment, shortages of basic amenities and finally social
and economic deprivation. All major urban centers in our country are gradually
becoming victims of such civic deficiency.
As per the census 2009. India’s population was approximately over 116 Crores,
which is second highest after China. As the country enters the era of economic
growth, economic liberalization and prosperity, cities seem not yet ready to
accommodatethe population and provide work and services and environmental
infrastructure for all. The twin problems of affordability and availability
continued. The housing problem should not be predicted as a mere demand
supply problem. Because of inequitable income distribution in our country,
there is bound to be a wide gap between the demand for the houses and need,
because the need is translated into demand only when it is backed by the
purchasing power. The Karnataka Housing Board was established by legislation
in 1962 as a farsighted
4. A studyonFundFlowandTrendAnalysiswithreferenceto
KarnatakaStateOpenUniversity 4
Move to satisfy the increasing housing needs of the people. Over the decades,
KHB has provided housing to 1.10 lakh families. It is the only housing agency
which has completed 950 schemes spread over the entire state. The board has
taken up diverse roles to provide housing to different segments. Unlike privately
developed, Housing layouts, KHB townships and layouts meet standard norms
of town planning and land usage.
KARNATAKA HOUSING BOARD
Karnataka Housing Board was established under Karnataka Housing Board Act
1962 as a successorto the Mysore Housing Board, which was constituted in the
year of 1956. Karnataka Housing Board (KHB), a statutory state government
undertaking, KHB is the only organization developed and implemented housing
projects throughout the state.
DEMAND FOR KARNATAKA HOUSING BOARD
The probable demand for housing could be analyzed from the census statistics
as per the census 2009 the population in Karnataka State was 57,399,000. The
census further indicates the expected growth in population by 2020 will be
around 30% over the population of 2009. On an average, therefore, the expected
growth in population would be around 1.5% Per annum considering that one
house is required for 4 individuals the actual requirement of houses for the
above population is 13,776,747 houses. An analysis was made taking into
consideration the Urban and Rural population and the requirement of housing in
each district. The requirement is further divided into EWS, LIG, MIG, and HIG
y adopting 40%, 30%, 25% and 5% respectively.
5. A studyonFundFlowandTrendAnalysiswithreferenceto
KarnatakaStateOpenUniversity 5
CHAPTER:3
COMPANYPROFILE
COMPANYPROFILE
Backgroundand inception of the company:
Karnataka Housing Board was established under Karnataka Housing Board Act
1962 as a successorto the Mysore Housing Board constituted in 1956. The
primary objective of KHB is ‘to make such schemes and carry out such works
which are necessary for the purposeof dealing with and satisfaction the need of
housing to the people of Karnataka at affordable costand therefore recognized
as the most important agency for housing throughout Karnataka. KHB
undertakes layout formation, housing scheme and land development schemes as
envisaged in the Act and subject to the controlof the state Government.
Nature of the business carried:
KHB endeavors to meet the Housing requirements to the class of people Viz.,
Low Income Group (LIG), Middle Income Group (MIG) and High Income
Group (HIG) categories. KHB townships are provided with basic infrastructure
such as asphalted roads, drinking water, electricity, underground drainage etc.
KHB Township provides civic cum commercial complexes in developed areas.
Bigger townships have commercial plazas. KHB takes care of maintenances of
each township till it is handed over to local municipal bodies. Road repairs,
garbage clearance, street light maintenance, security are taken care. KHB
ensures electricity and water supply from local authorities.
6. A studyonFundFlowandTrendAnalysiswithreferenceto
KarnatakaStateOpenUniversity 6
KHB has Project Implementation Unit (PIU) and Customer Service Unit (CSU)
in each of its township and layouts. PIU function pro-actively to make living
better. CSU is actively interacting with customers and respond timely to keep
customers satisfied.
VISION, MISSION AND QUALITY STANDARDS
VISION:
“To improve quality of life by establishing self-contained communities with
state-of-the art amenities those are in harmony with the environment”.
MISSION:
To provide sustainable, equitable, eco-friendly, acceptable and affordable
housing.
To constantly strive to work for customer satisfaction.
To provide efficient urban infrastructure services.
Function in a manner that is transparent, customer friendly, consultative
and participative.
KHB QUALITY STANDARDS:
KHB would like to bring more transparency in its operation. Hence it has
opened up new wings like customer relation cell, property management and
project management units to cater to the needs of the customer. It would like to
ensure that all the townships maintain quality of highest standards. All
townships will be self-contained with all urban and civic amenities and will
7. A studyonFundFlowandTrendAnalysiswithreferenceto
KarnatakaStateOpenUniversity 7
include rain water harvesting, water recycling for health, education and
recreation.
PRODUCT/SERVICESPROFILE:
Composite housing Schemes(CHS)
Group Housing Schemes
Multistoried Apartments
Labor Housing Schemes
Sites and Service Schemes
Satellite Towns
Layouts
Commercial plazas
District Office Complexes
Mini Vidhana Soudhas
Office Buildings and Hotel buildings.
AREA OF OPERATION
Karnataka Housing Board is the only organization developed and implemented
housing projects throughout the state. Its operation is throughout the state like
Bangalore, Bidar, Gulbarga, Raichur..
8. A studyonFundFlowandTrendAnalysiswithreferenceto
KarnatakaStateOpenUniversity 8
OWNERSHIP PATTERN
Name of the Board Members
As on 31.3.2013
SL Name Designation
1 Sri.V.Somanna
Chairman, Karnataka Housing Board,
Bangalore.
2
Sri.M.Lakshminaraya
na, I.A.S
Principal Secretary, Housing Department, Vikas
Soudha, Bangalore.
3
Sri. S.N.Jayaram,
I.A.S
Housing Commissioner, Karnataka Housing Board,
Bangalore.
4
Sri. Anurag Tiwari
I.A.S
Deputy Secretary III, Finance Department, Vidhana
Soudha, Bangalore.
5
Sri. C.K.Shivanna
I.F.S
Managing Director, KLAC, Bangalore.
6 Sri.A.N.Thyagaraj
Chief Engineer, A& B (South) K.R.Circle,
Bangalore.
7 Sri. S.S.Topagi
Director, Town Planning, M.S. Building,
Bangalore.
8 Sri. M.V.Jayaramaiah Deputy Chief(Finance) , HUDCO, Bangalore.
9 Sri.N. Basavaraju Non- Official member
10 M.Kumar Non- Official member
9. A studyonFundFlowandTrendAnalysiswithreferenceto
KarnatakaStateOpenUniversity 9
11 H.Gangamma Non- Official member
12 L.B.Jayalaksmi Non- Official member
13 A.H.Anand Non- Official member
ACTS RULING KHB
KARNATAKA ACT 10 OF 1963
THE KARNATAKA HOUSING BOARD ACT, 1962
THE KARNATAKA HOUSING BOARD RULES, 1964
THE KARNATAKA HOUSING BOARD (BORROWING SUMS BY
ISSUE OF DEBENTURE) RULES, 1967
THE KARNATAKA HOUSING BOARD REGULATIONS, 1983
THE KARNATAKA HOUSING OARD (WORK-CHARGED
ESTABLISHMED EMPLOYEES) (ABSORTIONIN THE HOUSING
BOARD SEVICES) RULES, 1985
THE KARNATAKA HOUSING BOARD (WORK CHARGED
ESTABLISHMENT EMPLOYEES) (ABSORTION IN THE HOUSING
BOARD SEVICES) RULES, 1999
DEPARTMENT OF PARLIAMENTARY AFFAIRS AND
LEGISLATION, 2000
THE KARNATAKA HOUSING BOARD ACT, 1962
INFRASTRUCTUREOF HOUSING PROJECTS:
The Programme of “100 Housing Projects” was initially launched to provide
15000 sites and 13500 Houses, at an approximate costof Rs.850 Crores. The
10. A studyonFundFlowandTrendAnalysiswithreferenceto
KarnatakaStateOpenUniversity 10
key infrastructure features in the layout are as per the town norms and depicted
below.
ACHIEVEMENTS OF KHB:
Developed over 950 housing schemes.
Provided 1,10,1000 houses and 6700 sites (approx.)
Taken up compositehousing and sire & services schemes.
Developed satellite townships at Yelhanka, Kengeri and Hootagalli.
Nodal Agency for National Games Village complex, Bangalore.
AWARDS FOR KHB
Karnataka Housing Board (KHB) is the only organization, which has developed
and implemented housing projects throughout Karnataka. KHB has been
working tirelessly for the successfulcompletion of its ambitious “100 Housing
Projects” plan. KHB has been awarded number of times by HUDCO fir its best
performance. The following are some of the important awards:
Outstanding performance Award (1994-1995)
Award for completing 200 Rural houses
12. A studyonFundFlowandTrendAnalysiswithreferenceto
KarnatakaStateOpenUniversity 12
DEMAND SURVEY AND LAND ACQUISITION:
Demand Survey and Land Acquisition plays a very vital role in the Karnataka
Housing Board. The other housing activities start after acquiring land only.
Therefore, Land Acquisition plays a very important role in KHB according to
the Land Acquisition Act; there are two type of Land Procurement. They are:
Purchase and
Acquisition
PURCHASE:
Purchase is one type of Land Acquisition in Karnataka Housing Board. In
purchase, the land is procured through the consent of the Landlords. The
commissioner of KHB and the Landlords of the land will decide mutually and
fix the rates the proposalgoes to the Government for its approval, payment will
be made after verifying all the necessary records and documents such as RR
(Records ofRights), Mutation, etc
ACQUISITION:
Acquisition is another type of Land Acquisition in KHB. Acquisition is mainly
done by paying the Compensation. Acquisition involves the following steps:
Commissioner of KHB will visit the Land.
13. A studyonFundFlowandTrendAnalysiswithreferenceto
KarnatakaStateOpenUniversity 13
If it is feasible, 4(1) Land Acquisition Act notification will be issued by
the KHB
This Notification will be issued to all the Land Owners whose lands are
notified in this Notification.
They can file objection regarding dropping of their Land or regarding the
rates within 30 days from the date of issue of the Notification.
As per the land Acquisition Act 5(A) inquiry will be conducted in the
SLAO (Special Land Acquisition Office)
Award will be passed bythe commissioner. If the award is more than 1
Crore, Government has to sanction and if it is less than 1 Crore it will be
sanctioned by the Commissioner himself.
Before passing the Award Joint measurement (KHB and Land Records
Department) will be issued.
After Award is passed 9 & 10 Enquiry of (Land Acquisition Act) done
regarding the payments and then 12(2) notice will be issued.
12(2) notice will be given to the concerned landlords showing their
compensation amount.
Finally the amount is given to the landowner after submitting all the
necessary documents.
PLANNING AND TENDING:
KH projects are spread over the entire state of Karnataka. KHB consults with
the reputed architects by issuing a panel (call of) and gives the contract to
whoever quotes the least in the tender. Then they make plan and design the
project designs. The planning deals with the planning activities of Karnataka
Housing Board such as:
14. A studyonFundFlowandTrendAnalysiswithreferenceto
KarnatakaStateOpenUniversity 14
Construction of houses
To provide affordable housing to all sections of the society
Development of sites throughout the states
KHB undertakes the construction of other government department
projects also such as the construction of schooland college buildings to
the earlier responsethe demand is poorthey cannot take up the project.
The planning of KHB Projects is done as per the “Town Planning Norms
and Standards”of Karnataka Government.
EXECUTION AND DEVELOPMENT
The implementation of the KHB planning activities involves 6 stages. They are:
Preparation of plan
Estimate for Construction as well as for Development
Float Tenders for the Project
Disposal of the properties / Marketing.
ALLOTMENT REGULATIONS:
15. A studyonFundFlowandTrendAnalysiswithreferenceto
KarnatakaStateOpenUniversity 15
Only those person, who pay initial deposit & Reg fee, shall be considered
for allotment of house/site. Property will be given to those who are
already registered, provided they pay initial deposit.
Balance of the costofhouse/site is to be paid in three quarterly equal
installments (Monthly) as soonas they receive intimations letter from the
Board. Failure to be so will entitle cancellation of the allotment and
forfeiture of 25% of initial deposit.
Allotment of house/site/CA site/Commercial site to KHB allotment Rules
& Regulations in force from time to time.
Discount to allottees will be allowed for delay in delivery of house/site @
0.02% per day of the amount deposited with subject to a maximum
ceiling of Rs.10,000/- for LIG, Rs.20,000/- for MIG and Rs.30,000/- for
HIG. A special rebate will be extended to allottees who pay the entire
amount in the beginning but only in lieu of initial deposit towards the cost
of house in one lump sum @ Rs.10,000/- for LIG, Rs.15,000/- for MIG
and Rs.20,000/- for HIG category house. This will not be available when
ForceMajeure condition are in operation. 100% payment should with
KHB for not less than 7 months.
Payment only by way of Demand draft/Chelan drawn in favor of the
Housing Commissioner, Karnataka Housing Board towards allotment can
be made at the local office/Head office/CANBANK computer Services,
Application must obtain an acknowledgement.
Absolute sale deed will be issued at the time of handling over possession
of the house/site on full payment.
Allotment will be on first-cum-first served basis also in caseof less
demand and in caseof more demand, lottery will be conducted.
Corner/commercial sites & commercial shops will be auctioned.
16. A studyonFundFlowandTrendAnalysiswithreferenceto
KarnatakaStateOpenUniversity 16
KHB would facilitate allottees in getting loans from Financial Institutions
of their choice. However KHB does not guarantee its sanction and
allotment is not linked to it in anyways.
Application can be had from KHB Head office/local office or its web site.
Application is available free of cost.
ALLOTMENT SUMMARY OF 100 HP AND OLD HP
FINANCIAL YEAR WISE ALLOTMENT SUMMARY FOR 100 HP & OLD HP
Financial year Sites House/Flats Total Property Price(Cr)
2005-06 2548 2902 5450 126
2006-07 2670 1864 4534 89
2007-08 2991 2025 5016 466
2008-09 5777 940 6717 257
Total 16293 8986 25279 1017
BREAK UP OF ALLOTMENT OF OLD STOCK DURING 2008-2009
HOUSES & FLAT
TOTAL HOUSESEWS LIG MIG HIG
19 62 85 8 174
SITES
Total SitesEWS LIG MIG HIG
4 137 325 71 537
BREAK UP OF ALLOTMENT OF 100 HP DURING 2008-2009
HOUSE & FLAT
TOTAL HOUSESLIG MIG HIG
254 67 8 773
17. A studyonFundFlowandTrendAnalysiswithreferenceto
KarnatakaStateOpenUniversity 17
SITES
TOTAL SITESLIG MIG HIG
2259 1837 978 5074
Note: Above details include public and corner properties, also revised and
exchange allotments.
Projects where there is less demand the houses are marketed on lease cum
sale basis and collecting 20% to 50% as initial deposit and balance
amount payable in 10 years leases period with applicable interest.
Old and new scheme (100 HP) properties are allotted on line.
KHB is conducting loan melas to facilities the customer to avail the loans
from the banks I.V.R.S has been installed for customer to obtain
information easily.
The information can seek from our web site address. www.khb.kar.nic.in
www.khbcustomerinfo.com for further details.
RECOVERY:
For the existing allottees KHB had extended concessionbenefits on difference
of costi.e., difference between final and provisional cost. Concessionhad also
been given to cash loan beneficiaries on entire liability at 15% to 35% based on
the income category of the allottees.
Conversion of LCS in bank loans.
Concessionalbenefit has been extended on difference of costi.e.,
difference between final and provisional cost. Concessionhas also been
18. A studyonFundFlowandTrendAnalysiswithreferenceto
KarnatakaStateOpenUniversity 18
given to cash loan beneficiaries on entire liability at 15% to 35% based
on income category of allottees. Concessionbenefits have also been
extended to Rural housing Schemes at 30% on outstanding amount
Entire Recovery network and mechanism has been activated and
strengthened.
Subject 2005-06 2006-07 2007-08 2008-09
Balance collection 89.54 55.49 44.32 40.4
Loan Amount 156.27 144.06 220.72 220
DEMAND, COLLECTION & BALANCE FOR THE YEAR 2012-13
The recovery mechanism has been reactivated and strengthened through
rigorous and meticulous recovery drives during the entire year. The demand
(outstanding) has shown a downward Trent indicating a very healthy sign.
The following are the activities of the recovery section:
Action will be taken by the recovery section on the basis of demand, ion
respect of allotment of sites / houses / apartments/ CA (Civic Amenities)
sites / shopping complexes / marginal land.
Demand is to be raised by the recovery section after the issue of allotment
letters to the beneficiaries, there in the demand amount to be paid has
been noted and intimated to the concernallottees.
Scheduled / fixed time, if the allottees fail to repay the installment /
amount fixed by the KHB action will be taken to issue ‘Show Cause’.
Even after the lapse of the period the allotted fails to pay the amount then
the allotment paid in the favor of the allottees will be cancelled after
giving a final notice of cancellation.
19. A studyonFundFlowandTrendAnalysiswithreferenceto
KarnatakaStateOpenUniversity 19
KHB will take action to allot the cancellation house in question to the
eligible allottee / beneficiary as the case.
The amount paid by the allottee for the allotment purposewill be
forfeited to the Board after the cancellation of the allotment.
If the allottee has executed the agreement in respectof the property
allotted to him and subsequently he wants to surrender the property
allotted to the Board, the Board will also forfeit the amount paid by him.
In case, if the allottee wants the property backwhich he had purchased
and the same property will not been allotted to any other personit is
given back to him and if it is allotted then the other site/house if available
is given to him.
The allottee should pay the costof the house/site in 4 installments for
every month i.e., for 4 months.
DCB every year KHB will be collecting the repayment of loan from the
allottees as per the demand raised by the KHB demand that balance will
be collected in due course along with the penal interest.
Earlier KH has made a facility to the allottee for repayment of loans in
equally 10 annual installments. In case of LCS agreement, at the time of
allotment the allottee have to pay 50% of the costof the house/site and
remaining 50% have to be cleared in annual installments. But, this facility
has been removed since 1999 due to paucity of funds in the KHB.
Moreover, many more Banks/Financial Institutions have come forward to
sanction
Loans in respectof the properties allotted by the KHB after mortgaging the
property in said favor of the Bank/Financial Institution. If the allottee required
NOC in respect of the above mortgage the same will be the KHB.
20. A studyonFundFlowandTrendAnalysiswithreferenceto
KarnatakaStateOpenUniversity 20
FUTURE GROWTHAND PROSPECTS
The Programme of “100 Housing Projects” was launched during 2002 to
provide 15,000 sites & 13,500 Houses as per Government Order
Housing Schemes Under Suvarana Karnataka Programme Board has
proposedto take up 50 housing schemes at various places under
SUVARNA KARNATAKA Programme.
Apart from the projects sanctioned under 100 housing projects and
Suvarna Karnataka Programme the Board has proposed to take up
Housing Schemes in the places with details indicated in the Annexure B
Peenya housing project, Bangalore for state Govt. Employees it is
proposedto build 4000 dwelling units.
Bangalore International Convention Center around 20Km from city. It is
near the proposed site for the Bangalore International Airport,
Devanahalli.
Major Housing Projects and commercial plazas on joint venture basis is
proposedin districts like Gadag, Mangalore, Udupi, Mandya, and
Bagalkot. Forthese housing projects, KHB is in possessionof required
land. The proposed township will be self-contained with all urban and
civic amenities.
Construction of district office complexes, mini Vidhana Soudha and
quarters for revenue dept of the govt.
Out of 7 new district office complexes construction at Chamarajnagar,
Haveri, Bagalkot and Koppal has been completed.
Construction of District Office Complex at Gadag is under completion
Construction will be taken up shortly at Udupi
Out of 195 quarter for the Deputy Commissioner/Chief Executive
Officer, Revenue Inspection and village Accountants taken up in that
21. A studyonFundFlowandTrendAnalysiswithreferenceto
KarnatakaStateOpenUniversity 21
construction of 184 quarter has been completed and construction of 11
quarter are under progress
Construction of First Floor to existing museum building and compound
walls around museum and Historical buildings at Basavakalay is under
Progress.
Works for Urban Development Department
Construction of office building for Belgaum City Corporation at
Belgaum is under progress.
Construction of underground drainage system to Shikharipura town,
construction of commercial complex and stadium at Shikharipura at
Shimoga district
Construction of hotel building and beautification works at Jog falls for
Jog Development Authority
The Department of Horticulture has entrusted the work of construction
of new Horticulture University Campus at Bagalkot. The work will be
taken up shortly.
Construction of Suvarna Ranga Mandhira in 7 different places in the
state for Kannada Culture Department will be taken up shortly.
Construction of Registrar offices for Department of stamps and
Registration Department at 7 different places at a costof Rs. 2 Crores is
under progress.
22. A studyonFundFlowandTrendAnalysiswithreferenceto
KarnatakaStateOpenUniversity 22
CHAPTER:4
MCKINSEY’S FRAMEWORK
The Mckinsey 7S model was named under the consulting company, Mckinsey
and Company, which has constructed applied research in business and industry
(Pascale & Athos, 1981; Peters & Waterman, 1982). All of the authors worked
as consultants at Mckinsey and Company: in the year 1980s they used the
model to analyze over 70 large organizations. The Mckinsey 7S Framework was
created as a recognizable and easily remembered model in business. The seven
variables, which the authors term ‘Levers”, all begin with letter ‘S’. The seven
variables include Structure, Strategy, Systems, Skills, Style, Staff and Shared
values
23. A studyonFundFlowandTrendAnalysiswithreferenceto
KarnatakaStateOpenUniversity 23
STRATEGY:
Strategy is the plan of action an organization prepares in responseto, or
anticipation of, changes in its external environment. It deals with essentially
three questions:
Where the organization is at this moment in time?
Where the organization wants to be in a particular length of time?
How to get there?
24. A studyonFundFlowandTrendAnalysiswithreferenceto
KarnatakaStateOpenUniversity 24
Thus, strategy is designed to transform the firm from the present position to the
new position described by objectives, subject to constraints of the capabilities or
the potential.
OperationalStrategies:
Under the 100 Housing Projects taken up,
Detailed project report is proficiently prepared by pre-qualified, reputed
and professional management consultants.
The allottees will be identified and allotment made before the completion
of the project. Their representative will be part of the committee to
monitor the project. This is to ensure customer audit at the time of
completion.
Under the housing Programme for economically weaker sections:
To implement the program through the existing network of District
Administration.
Tie up with RRBs and district lead banks and integrate them to put in
place an existing network to facilitate the program fund disbursement,
recovery and accounting.
Under the Slum development programmes:
Ensure preparation of need based action plan after properverification,
reflecting ground realities.
Involvement of beneficiaries in construction of houses at the stage of
implementation, monitoring and loan recovery.
25. A studyonFundFlowandTrendAnalysiswithreferenceto
KarnatakaStateOpenUniversity 25
Under low cost technology promotion programme:
To provide low costconstruction technology materials in construction of
houses.
To undertake construction of houses for economically weaker section and
slum dwellers through the district level Nirmithi Kendra’s using low cost
construction technology.
STRUCTURE:
Business needs to be organized in a specific form of shape that is generally
referred to as organizational structure. Organizations are structured in a variety
of ways, dependent on their objectives and culture. The structure of the
company often dictates the way it operates the way it operates and performs.
The board consists of 8 official member and 5 non official members including
the chairman. The government had Appointed presently 8 officials including the
chairman. The government of Karnataka nominates the chairman and appoints
the:
The Housing Commissioner,
Chief Engineer (General Manager- Technical)
Secretary (General Manager- HRD)
Controller of Finance (General Manager- Finance) and
Deputy Commissioner- Recovery (General Manager- Recovery).
The housing Commissioner is the Chief Executive and Administrative Officer
ads per the Act. The Board has two-tier administrative structure comprising of a
Head Office and Executive Engineer’s Offices being one level and Project
Offices situated in all the Districts, being the other level. There are the 12
Offices of the EE’s. Administration maintains all the service particulars of all
26. A studyonFundFlowandTrendAnalysiswithreferenceto
KarnatakaStateOpenUniversity 26
the officials from the top to bottomlevel i.e. from Commissioner to peon,
Administration are divided into four groups. They are:
Group A: Consists of Commissioner, Chief Engineer, Secretary, Executive
Engineers, and all IAS and KAS Officers.
Group B: Consists of Assistance Executive Engineers and Assistant Engineers.
Group C: Consists of clerks, Junior Engineers including Assistant Engineers.
Group D: Consists of Peons, Attendees, Sweepers, and Miscellaneous
SYSTEMS:
Every organization has systems or internal process to supportand implement
the strategy and run day-to-day affairs. For example, a company may follow a
particular process forrecruitment. These process are normally strictly followed
and are designed to achieve maximum effectiveness. In Karnataka Housing
Board the promotional policy is followed as per the Cadres and recruitment
Rules of the Board on the basis of number of Posts, which is further based on
the:
RECRUITMENTSYSTEM
SENIORITY:
By the permission of the government only certain posts canbe promoted.
Depending upon the seniority of the postthe KHB employees are promoted.
DEPARTMENTALEXAMINATION:
27. A studyonFundFlowandTrendAnalysiswithreferenceto
KarnatakaStateOpenUniversity 27
The other basis on which the employees of KHB are promoted is the
departmental examinations and qualification. E.g. The KHB has given four
prescribed department examination and all the examinations has to be passed
compulsory, if even one examination is not cleared, examination is cancelled.
ROSTER METHOD:
Karnataka Housing Board follows the RosterMethod as one of the promotional
policies to promote the SC’s and ST’s i.e., as per the rules laid down by the
central Government 18% is fixed for the SC’s and ST’s promotion.
MIS FOR ALLOTMENT:
M I S has been implemented in the customer service sectoralong with an
exclusive customer service that is being handled by Canbank Computer
Services Limited (CCSL), Bangalore. This has ushered in centralized allotment.
Information is being updated regularly on to the web site:
http://www.khbcustomerinfo.com of vacant houses and sites.
GEOGRAPHICALINFORMATION SYSTEM:
It has becomean indispensable tool in KHB. Geographic Information System
features an electronic digital map, which correlates entries into a relational
database. This smart map can query information for reporting, as well as for
analysis.
CommercialAccount System and Double Entry System are followedfor
financing function.
STYLE:
28. A studyonFundFlowandTrendAnalysiswithreferenceto
KarnatakaStateOpenUniversity 28
All organizations have their own distinct culture and management style. It
includes the dominant values, beliefs and norms which develop over time and
become relatively enduring features of the organizational life. KHB Projects are
demand driven. Detailed Project Reports (DPRs) are being professionally
prepared by pre-qualified Architectural and Engineering firms, and monitored
by pre-qualified, reputed and professional Project Management Consultants.
The schemes are offered to pre-qualified trunkey contractors who shall execute
all the works starting from Civil Works, Road, Electrical, Water supply,
sanitation and sewage treatment works, landscaping including developing open
spaces, parks, gardens etc.
These Turnkey contractors are being insisted upon a 2 year defect liability
period and simultaneously, for a 1 year contractfor maintenance, water supply
maintenance, security and general upkeep of the layout and this will be on
actual charges. Contractors will be complimented with incentives for early
completion of work and penalized for delay in delivery. Third party quality
inspection is being provided. KHB announces the exact final costof houses and
sites being made during the project period. Extra items and work- slips are not
entertained here and fixed costs are being announced before allotment up the
promise: “No time and costover runs”
SKILLS:
It refers to the capabilities of the staff within organization as a whole. Since
KHB is dealing mainly with public and customers, lot of emphasis has been put
on quick redressed of public grievances. For this up graduation of the skills of
the staff has become inevitable. In this regard the staffs of KHB were imparted
training in various aspects ofHRD and development skills. This special training
29. A studyonFundFlowandTrendAnalysiswithreferenceto
KarnatakaStateOpenUniversity 29
program has had a good effect on the staff. In a phased manner, it is aimed to
equip the entire staff of KHB with these skills. As a result, fo the positive
attitude of the staff, the number of public grievances has drastically came down.
Karnataka Housing Board has two types of Training Programmes, which are as
follows:
ADMINTRATIVE TRAINING
In KHB, the Administrative Training deals with the maintenance of the officials
service particulars.
TECHNICAL TRAINING
In KHB, the Technical Training deals with the following- Computer Training is
given to all the officials of KHB. Some Officials and Engineers are deputed to
neighboring states and foreign countries to know the developmental,
maintenance, quality and marketing activities of housing.
STAFF:
Organizations are made up of humans and it’s the people who make the real
difference to the success ofthe organization in the increasingly knowledge-
based society. The importance of human resources has thus got the central
position in the strategy of the organization. In KHB, staff are provided by
monetary advances in form of Festival advances, Medical advances, Traveling
Advances, pay advances, Computer advances and so on. Out of the sanctioned
strength of 643, KHB has 605 employees (including the officers) are working.
Out of these, 579 ae KHB employees and 26 are deputed from other
Government Departments.
30. A studyonFundFlowandTrendAnalysiswithreferenceto
KarnatakaStateOpenUniversity 30
SHARED VALUES/SUPER ORDINATE GOALS
All members of the organization share some common fundamental ideas or
guiding concepts around which the business is built. This may be to make
money or to achieve excellence in a particular field. These values and common
goals keep the employees working towards a common destination as a coherent
team and are important to keep the team spirit alive.
Provide sustainable, equitable, eco-friendly, acceptable and affordable
housing.
Constantly improve delivery and quality.
Constantly strive to work for customer satisfaction.
Provide efficient urban infrastructure services.
32. A studyonFundFlowandTrendAnalysiswithreferenceto
KarnatakaStateOpenUniversity 32
2. Financial Position of KHB is very strong.
3. It has customer friendly and hard working employees.
4. It has the best Architect Panel.
5. It provides Loans through Commercial Banks to customers.
6. It has implemented new technologies like MIS & GIS.
7. It provides Loans through Commercial Banks to customers.
WESAKNESSES:
1. Delay in working process due to formalities & require of Govt approval.
2. KHB is facing very much time gap between the Identification and
3. Implementation & Completion of the project.
4. Less Training Programs are imparted to Technical employees.
5. Working place of KHB Central office is congested.
6. KHB is not well furnished.
7. Delay in customer services and project Approvals.
OPPORTUNITIES:
1. Government Project Contracts are reserved for KHB.
2. City development & infrastructure development projects are available to
KHB.
3. It can diversify, be number 1 in Karnataka and be competitive to private
sector.
4. Better scopefor expansion and diversification.
5. Adopting more sophisticated technology in constructions.
6. Concentrating on rural area to capture higher market share.
THREATS:
1. Entry of Private Builders and agencies in Construction Projects.
33. A studyonFundFlowandTrendAnalysiswithreferenceto
KarnatakaStateOpenUniversity 33
2. Company are engaged themselves in construction of own office
buildings, colonies etc. like Banks, LIC’s, Factories.
3. Difficulty in Recovery of Amount from its customers.
4. Invasion of private companies leads to competition.
CHAPTER:6
ANALYSIS OF FINANCIAL STATEMENT
ANALYSIS OF FINANCIAL STATEMENTS
34. A studyonFundFlowandTrendAnalysiswithreferenceto
KarnatakaStateOpenUniversity 34
The Karnataka Housing Board has been meeting administrative expenses cost
out fo the revenues generated from sale of Houses, apartments, sites,
commercial Banks for construction & Development of Composite Housing
Scheme, Apartments, Sites & services for the year beginning an amount of
Rs.220.73 Crore is outstanding.
During current year an amount of Rs.209.78 Crores had borrowed from the
commercial banks for the interest rate at 9% to 10.50%. Out of this, an amount
of Rs.231.43 Crores has already been paid.
Profit maximization is not the main concerns;they are working for the societal
concern. Because it was working like PWD, but after 1986 they became an
autonomous body, this is done to strengthen the Board activities. To meet the
Administration costand overheads they utilize 10% of the project cost. E.g.
Rs.100 is the purchase and development price out which 10% is utilized to meet
the administration cost.
The balance loan of Rs.199.08 Crores which was outstanding in the above
account. KHB has repaid the entire high costborrowings amounting to Rs.215
Crores by swapping of loan from HUDCO.
The average costof borrowing is reduced from 10.5% to 7.5%. KHB has
obtained Tax exemption from Income Tax Dept. Sales increased from Rs.92.64
to Rs.103.84 Crores.
Profits has increased from Rs.0.81 Crores to Rs.11.62 Crores to Rs.11.62
Crores. There is no changes in the Housing Fund since, 2006-08 because, there
are no adjustments, such as prior period adjustments. Reserves and Surplus
figure varies year by year because of differences in Income and Expenditure.
FINANCIAL ACHIEVEMENTS:
KHB has repaired the entire high costborrowings amounting to Rs.215
Crores by swapping of loan from HUDCO
35. A studyonFundFlowandTrendAnalysiswithreferenceto
KarnatakaStateOpenUniversity 35
The average costof borrowing is reduced from 10.5% to 7.5%.
KHB has obtained Tax exemption from Income Tax Dept.
Profit has increased from Rs.0.81 crores to Rs.11.62 crores.
Computerization of Allottee accounts
Introduced Finalization of accounts on monthly basis
Introduced Internal Audit System
Commercial Accounting system introduced.
CHAPTER:7
LEARNING EXPERIENCE
LEARNING EXPERIENCE:
36. A studyonFundFlowandTrendAnalysiswithreferenceto
KarnatakaStateOpenUniversity 36
The learning experience which I have gained during the project work has been
very useful and has given me an insight as to what the organization is all about.
There was a corporateexposure to know about the facts related to KHB. It
helped me to aware of the housing industry and the role played by KHB.
I came to know how the KHB would conductallotments to its customers and
what are the criteria that should be fulfilled by its customers. I had an exposure
of knowing about the practical aspects of KHB strategies, style, staffing,
structure, skills, system, shared values and SWOT analysis.
The KHB provided me with the financial statements, company profile,
brochures and through browsing internet, it has been easy for me to analyze and
interpret the facts and figures.
Lastly, it had been a good experience which enabled me to enhance my practical
knowledge.
CHAPTER:8
GENERALINTRODUCTION
GENERALINTRODUCTION
37. A studyonFundFlowandTrendAnalysiswithreferenceto
KarnatakaStateOpenUniversity 37
FUND FLOW ANALYSIS
The fund flow analysis is undertaken to highlight changes in the financial
condition of a business concern over a given period of time. The fund flow
statement is a statement, which shows the movement of funds and is a report of
the financial operations of the business undertaking. It indicates various means
by which funds were obtained during a particular period and the ways in which
these funds were employed. In simple words, it is a statement of sources and
applications of funds.
This statement is derived from an analysis of the changes that have occurred in
the assets and liabilities items between the two balance sheet periods. With the
help of this statement, an analyst can judge the liquidity position of the
Company, and the spending and financing habits of the management. In several
instances, a Company has a fairly good earning record; yet it may experience a
shortage of liquid resources, which may often impel it towards liquidation.
Contrary to this, despite low profits, a Company may be placed comfortably
with respectto working capital. Furthermore, the funds flow statement provides
an insight into the financing pattern of an enterprise.
An analysis of the major sources of funds in the past reveals what portion of the
growth was financed by internal resources and what portion by external
resources. It shows whether the Company has been expanding its scale of
business by business by building up additional plant and equipment or by
increasing its sales, or whether it is involved in purely routine affairs of
distributing dividends and redeeming long-term debts.
38. A studyonFundFlowandTrendAnalysiswithreferenceto
KarnatakaStateOpenUniversity 38
'Funds’ refers to money values in whatever forms it may exit. Here ‘funds’
means all financial resources, used in business whether in the form of men,
material, money, machinery and others.
‘Funds’ also means ‘working capital’. The working capital conceptof fund has
emerged due to the fact that total resources of a business are invested partly in
fixed assets capital and partly kept as liquid assets as working capital. There are
three concepts ofthe term ‘funds’-the cash concept, the total resources concept,
and the working capital conceptand the working capital concept.
According to the “total resources concept”all the changes that result in an
increase in the funds of the firm constitute sources offunds. Generally, funds
flow in a business firm are from the following sources:
The earning of the enterprise.
Expansion in liabilities through increased use of borrowed funds or
increased trade credit.
Decrease in assets suchas liquidation of current assets, sales of fixed,
miscellaneous or tangible assets, and earned depreciation on such assets.
Contribution of additional funds by the owners of the firm.
The use of fund side of the funds statement depicts all such changes as cause a
decrease in the total funds of the business. The following items are shown on
the
‘Uses’ column of the statements:
Decrease in liabilities
Increase in assets
Decrease in capital funds
39. A studyonFundFlowandTrendAnalysiswithreferenceto
KarnatakaStateOpenUniversity 39
Net losses.
FLOW OF FUNDS
The term ‘flow’ means movement and includes both ‘inflow and outflow’. The
term ‘flow of funs’ means transfer of economic values from one asset of equity
to another. Flow of funds is said to have taken place when any transaction
makes changes in the amount of funds available before happening of the
transaction. If the effects of transaction results in the decrease of funds, it is
called a source of funds and if results in the decrease of funds, it is known as an
application of funds, further, in case the transaction does not change funds, it is
said to have not resulted in the flow of funds.
40. A studyonFundFlowandTrendAnalysiswithreferenceto
KarnatakaStateOpenUniversity 40
According to working capital conceptof funds, the term ‘flow of funds’ refers
to the movement of funds in the working capital. If any transaction results in the
increase in working capital, it is said to be a source or inflow of funds and if it
result in the decrease of working capital, it is said to be an application or
outflow of funds.
On the basis of the above description the conceptof flow can be summarized as
follows:
Category1: when a transition involves only current accounts, and there is no
flow of funds.
Category2: when the transition involves only non-current accounts, then also
there is no flow of funds.
Category3: when a transaction involves a current accountand a non-current
account, the next working capital increases or decreases and thus is a flow of
funds.
41. A studyonFundFlowandTrendAnalysiswithreferenceto
KarnatakaStateOpenUniversity 41
A fund flow statement is an essential toolfor the financial analysis and is of
primary importance to the financial management. Now-a-days it is being widely
used by the financial analysts, credit granting institutions and financial
managers. The basic purposeof a funds flow statement is to revel the changes in
the working capital on the two balance sheet dates.
It also describes the sources from which additional working capital has been
financed and the use to which working capital has been applied. Such a
statement is particularly useful in assessing the growth of the firm, its resulting
financial needs and in determining the best way of financing these needs.
By making use of projected funds flow statements, the management can come
to know the adequacy of working capital even in advance. One can plan the
intermediate and long-term financing if the firm, repayment of long-term debts,
expansion of the business, allocation of resources, etc.
42. A studyonFundFlowandTrendAnalysiswithreferenceto
KarnatakaStateOpenUniversity 42
USES OF FUNDS FLOW STATEMENT
Funds flow statement helps the financial helps the financial analyst in having a
more detailed analysis and understanding of changes in the distribution between
two balance sheet dates. In case such study is required regarding the future
working capital position of the company, a projected funds flow statement can
be prepared.
The uses of a funds flow statement can be put as follows: it explains the
financial consequences of business operations: funds flow statement provides a
ready answer to so many conflicting situations, such as
Why the liquid position of the business is becoming more and more
unbalanced in spite of business making more and more profits?
How was it possible to distribute dividends in excess of current earnings
or in the presence of a net loss for the period?
The financial analyst can find out answers to a number of intricate questions
What is the overall creditworthiness of the enterprises?
What is the souses ofrepayments of the loans taken?
How much funds are generated through normal business operations?
In what ways the management has utilized the funds in the past and what
are going to be likely uses of funds?
43. A studyonFundFlowandTrendAnalysiswithreferenceto
KarnatakaStateOpenUniversity 43
It acts as an instrument for allocation of resources:A projected funds flow
statement will help the analyst in finding out how the management is going to
allocate the scare resources for meeting the productive requirement of the
business.
The uses of funds should be phased in such an order that the available resources
are put to the bestuse of the enterprise. The funds should be managed in sucha
way that the business is in a position to make payment of interest and the loan
installment as per the agreed schedule.
It is a test as to effective or otherwise use of working capital: funds flow
statement is a test of effective use of working capital by the management during
a particular period.
The adequacy or inadequacy of working capital will tell the financial analyst
about the possible steps that the management should take for effective use of
surprise working capital or make arrangement in caseof inadequacy of working
capital.
ADVANTAGES OF FUNDS FLOW STATEMENT
The chief advantage of the Funds Flow Statement are the following:
Since it gives the figures of cashinflow from operations, it gives much
more reliable picture of the results of operations than the usual profit
and loss account. Changing the amount of depreciation can easily
change the figure of profit. Higher depreciation will mean lower profit
and vice versa.
44. A studyonFundFlowandTrendAnalysiswithreferenceto
KarnatakaStateOpenUniversity 44
Since cash (or funds) is the basis for carrying on operation, the funds
flow statement, prepared on an estimated basis for the next period will
enable a firm, to plan its financial operations properly. The firm will
know how much funds it requires, how much it should make
arrangements from outside. This is a process ofbudgeting.
The statement for the previous year compared with the budget prepared
before the year commenced will show to what extent the utilization was
unplanned or not proper.
The Funds Flow Statement cannot take the place of the final statements
of account the Balance Sheet or the Profit and Loss Account but it is
most useful supplementary statement.
LIMITATIONS OF THE FUNDS FLOW STATEMENT
It should be remembered that a funds flow statement is not a substitute of
an income statement of a balance sheet. It provides only some additional
information as regards changes in working capital.
It cannot reveal continuous changes.
It is not original statement for re-arrangement of data given in the
financial statement.
TREND ANALYSIS
The financial statements may be analyzed by computing treads of series of
information. This method determines the direction upwards or downwards and
involves the computation of the percentage relationship that each statement item
bears to the same item in base year.
45. A studyonFundFlowandTrendAnalysiswithreferenceto
KarnatakaStateOpenUniversity 45
The information for a number of years is taken up and one year, generally the
first year, is taken as a base year. The figures of the base year are taken as 100
and trend ratios for other years are calculated on the basis of base year.
CHAPTER:9
RESEARCHDESIGN
MEANING OF RESEARCHDESIGN:
A research design is the conceptual structure within which the research will be
conducted. It informs what, where, when, how much and by what means a
research study is to be conducted.
It is logical and systematic planning and it helps in directing a research work.
TITLE OF THE STUDY
A STUDY OF FUND FLOW AND TREND ANALYSIS WITH
REFERENCETO KARNATAKA HOUSING BOARD (KHB), Cauvery
Bhavan, Bangalore.
STATEMENTOF THE PROBLEM
Fund Flow is one of the crucial functions of the top level management. This
study is an attempt to understand the sources and development of funds y
Karnataka Housing Board. For example: we get answers to the following
questions
46. A studyonFundFlowandTrendAnalysiswithreferenceto
KarnatakaStateOpenUniversity 46
1. Does the business have adequate working capital to operate the business?
2. What are the sources from which funds are raised in the business?
3. How have the generated funds been utilized?
4. How much funds generation through normal business operation?
5. Where have the profit gone?
6. In what was the management has utilized the funds in the past what are
going to be the likely uses of the funds?
OBJECTIVESOF THE STUDY
To study the changes of working capital during the last few years in the
company and the reason for the changes in Working capital.
To study the various sources from which the funds are raised and the
application of those funds in the company.
To evaluate the financial statements of the board over the past5 years.
SCOPE OF THE STUDY
The study covers all financial activities of Karnataka Housing Board. The study
contributes towards understanding movement of funds that influence KHB. The
study is only about the analysis of funds flow statement and trend series of
KHB. It is confined to only KHB, Head Office, and Bangalore only.
SOURCES OF DATA
The study is based on the collection of secondarydata.
SecondaryData:This data was collected from previous annual reports of the
board, company brochures, magazines and websites.
47. A studyonFundFlowandTrendAnalysiswithreferenceto
KarnatakaStateOpenUniversity 47
METHODOLOGY
Type of Research:It is an analytical and descriptive research.
Tools ofData Collection:Through annual Reports and financial
statements
Method of Data collection:
Secondarydata was collected during the visit to the organization, using
published information like Annual Reports, Profile, Brochures, Company
records, etc.,
Method of Analysis:
The data collected form the financial statements and profile of company was
tabulated. The analysis is done by fund flow statements and trend series. Also
necessary tables and graphs are prepared.
LIMITATION OF THE STUDY
The findings of the study and recommendations are applicable only to
KARNATAKA HOUSING BOARD, Head office of Bangalore.
Analysis, projections and conclusion are arrived at depending on the
information provided by the Board.
48. A studyonFundFlowandTrendAnalysiswithreferenceto
KarnatakaStateOpenUniversity 48
CHAPTER:10
ANALYSIS AND INTERPRETATION
Analysis is the process ofcritically examining in detail accounting information
given in the financial statements.
Thus, the analysis of financial statements refers to the treatment of the
Information contained in the financial statements in a way so as to afford a full
diagnosis of the profitability and financial position of the Board. For this
purpose, financial statements are classified methodically, analyzed and
compared with the figures of the previous year with the current year.
In the words of Smith and Brown
“Fund Flow Statementis prepared to indicate in summary form, changes
(and trends, if prepared regularly) occurring in items of financial position
betweentwo different balance sheetdates”.
In the words of Kennedy and Memullur
49. A studyonFundFlowandTrendAnalysiswithreferenceto
KarnatakaStateOpenUniversity 49
“The analysis and interpretation of the financial statements are an attempt
to determine the significance and meaning of the financial statements data
so that a forecastmay be made of the prospects for future earnings, ability
to pay interest and debt maturities (both current & long term), and
profitability of a sound dividend policy”
Analysis and interpretation are closely related. Interpretation is not possible
without interpretation analysis is of no value. Interpretation is nothing but
drawing inference and stating what the figures in financial statements really
mean. This study is to analyze the fund flow statement of the Board.
This comparative study is also carried out by the analyzing the income and
expenditure accounts i.e., flow of funds (where the money come from and
where the money went)
The most important objective of the analysis and interpretation of financial
statements are to understand the significance and meaning of financial statement
data to know the strength and weaknesses of a business undertaking so that a
forecast may be made of the future prospects ofthe business undertaking.
50. A studyonFundFlowandTrendAnalysiswithreferenceto
KarnatakaStateOpenUniversity 50
Working Capital: Year ended 31.03.2012
Statement showing changes of working capital position for the year ended 31.03.2012
Particulars 31.03.2012 31.03.2011 INCREASE DECREASE
Current Assets
Cash inTransit 20,268 3,388,623 3,368,355
Bank balance 259,073,700 382,306,537 123,232,837
Land inpossession 2,240,554,572 1,528,712,798 711,841,774
FixedDeposit 82,146,046 305,298,616 223,152,570
OtherAssets 3,093,526,543 1,232,054,666 1,861,471,877
Interest 8,625,785 6,429,062 2,196,723
SundryDebtors 92,769,629 87,435,724 5,333,905
Loans & Advances 3,390,404,844 1,660,917,847 1,729,486,997
Capital WIP 1,251,764,242 3,524,944,155 2,273,179,913
TOTAL (A) 10,418,885,629 8,731,488,028 4,304,997,371 2,628,267,580
Current Liabilities
CurrentLiabilites 1,310,638,788 1,200,566,664 110,072,124
TOTAL (B) 1,310,638,788 1,200,566,664 110,072,124
51. A studyonFundFlowandTrendAnalysiswithreferenceto
KarnatakaStateOpenUniversity 51
WorkingCapital=(A-B) 9,108,246,841 7,530,921,364 4194925247 2617599770
NetIncrease inWorking
Capital 1577325477
Total 4194925247 4194925247
Source: Company Records
FUND FORM OPERATIONS For the year ended 31-3-2012
Amount in Rs
ClosingBalance toReserve &Surplus 1,440,229,046
Less: OpeningBalance of Reserve &Surplus 1,197,564,721
242,664,325
Add: Depreciationchargedonall assets 1,350,969
Less: Profitonsale of fixedassets 290,252
FUND FROM OPERATIONS 243,725,042
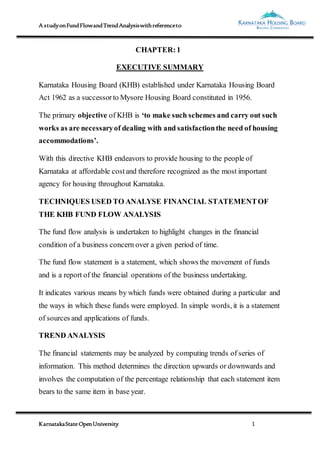
FUND FLOW STATEMENT For the year ended 31-3-2012
SOURCES OF FUNDS AMOUNT % APLICATIONSOF FUNDS AMOUNT %
Raise insecuredloans 766639188 48.6 Increase inWorkingCapital 1,577,325,477 100
52. A studyonFundFlowandTrendAnalysiswithreferenceto
KarnatakaStateOpenUniversity 52
Raise indeposits-Public 566,638,129 35.92
Sale of fixedAssets 323,118 0.03
FundFrom Operations 243,725,042 15.45
Total 1,577,325,477 100 Total 1,577,325,477 100
0
5
10
15
20
25
30
35
40
45
50
Raise in secured loans Raise in deposits-
Public
Sale of fixed Assets Fund From Operations
48.6%
35.92%
0.03%
15.45%
SOURCES Of FUNDS
53. A studyonFundFlowandTrendAnalysiswithreferenceto
KarnatakaStateOpenUniversity 53
ANALYSIS:
From the above table, it can be analyzed as on 31/2/2012
There is increase in working capital i.e., Rs. 1,577,325,477 comparing to
total funds proportion, it is 100%
The funds available through operations is Rs. 243,725,042 i.e., 15.45%
There is raise in public assets of 0.03%
Secured loans are raised up to 48.60%
INTERPRETATION:
The balance sheet of Karnataka Housing Board provides information on assets
and liabilities related to the board as at 31st march 2012. The changes in
carrying amount of assets and liabilities would reflect the outcome of operating,
0
20
40
60
80
100
100%
Increasein WorkingCapital
APPLICATION OF FUNDS
54. A studyonFundFlowandTrendAnalysiswithreferenceto
KarnatakaStateOpenUniversity 54
investing and financial decisions in previous year and current year. Also, it
reflects the effect of economic events of those periods.
There is an increase in working capital as there is increase in current assets. It is
nothing but current assets are more that the current liabilities. The position of
working capital is increasing from year to year. It indicates the financial health
of board where there is obligation of utilizing of working capital.
The current assets of the board are adequate to meet out the short term
requirements. It can be inferred through calculation of current ratio to know the
liquidity position of the board. Here, in the period of 2011-2012, it should be
noted that there is 100% of increase in working capital. The ideal industry
current ratio of 2:1 or more is considered to be satisfactory. In 2012, current
assets (CA) were Rs. 10,418,885,629 & current liabilities (CL) were Rs.
1,449,397,395 and Current Ratio = CA/CL = 10,418,885,629 /
1,449,397,395 = 7.94 times. So, it can be inferred that the higher the ratio, the
greater the margin of safety the larger the amount of current assets in relation to
current liabilities, the more Board’s ability to meet its current obligations.
Since the excess of current assets over current liabilities may show idle funds in
the board. However, further study is required to understand whether the high
current ratio is good or bad for the board by comparing its norms of
management policy so as to ensure no funds are kept idle.
Secured loans include – KHB schemes and debentures. The major source
of funds for the board-secured loans has increased that loans are drawn
from nationalized banks for the working capital requirements.
Debentures are constant and KHB schemes are increased from
Rs. 1,440,617,235 to Rs. 2,207,256,423 i.e., 48.60%
55. A studyonFundFlowandTrendAnalysiswithreferenceto
KarnatakaStateOpenUniversity 55
The board’s othersources of funds has also increased due to increase in
deposits from public rather than other deposits such as deposits from
contractors, security deposits and so on.
There is a sale of fixed assets found in a year i.e., 0.03%. The sale of
fixed assets are recorded as income. As it brought profit on sale of fixed
assets amounting Rs. 290,252. It is also sourceof fund.
Every year the depreciation is calculated on the basis of straight line
method.
Working Capital: Year ended 31.03.2013
Statement showing changes of working capital position for the year ended 31.03.2013
Particulars 31.03.2013 31.03.2012 INCREASE DECREASE
Current Assets
Cash inTransit 3,955,646 20,268 3,935,378
Bank balance 302,861,741 259,073,700 43,788,041
Land inpossession 3,433,566,992 2,240,554,572 1,193,012,420
FixedDeposit 97,883,601 82,146,046 15,737,555 630,072,369
OtherAssets 2,463,454,174 3,093,526,543
Interest 15,464,177 8,625,785 6,838,392
SundryDebtors 77,333,025 92,769,629 15,436,604
56. A studyonFundFlowandTrendAnalysiswithreferenceto
KarnatakaStateOpenUniversity 56
FUND FROM OPERATIONS For the year ended 31-3-2013
Amount is Rs.
ClosingBalance of Reserve & Surplus 1,656,481,606
Less: OpeningBalance of Reserve &Surplus 1,440,229,046
Add: Depreciationchargedonall assets 2,393,212
FUND FROM OPERATIONS 218,645,772
FUND FLOW STATEMENT For the year ended 31-3-2013
SOURCES OF FUNDS AMOUNT % APLICATIONSOF FUNDS AMOUNT %
Raise insecuredloans 663,208,093 75.2
Repaymentof Loansto
NationalizedBanks 217,910,446 24.71
Loans & Advances 3,952,249,997 3,390,404,844 561,845,153
Capital WIP 895,076,014 1,251,764,242 356,688,228
TOTAL (A) 11,241,845,367 10,418,885,629 1,825,156,939 1,002,197,201
Current Liabilities
CurrentLiabilities 1,490,882,351 1,310,638,788 180,243,563
TOTAL (B) 1,490,882,351 1,310,638,788
WorkingCapital=(A-B) 9,750,963,016 9,108,246,841 1,644,913,376 1,002,197,201
NetIncrease inWorking
Capital 642,716,175
Total 1,644,913,376 1,644,913,376
57. A studyonFundFlowandTrendAnalysiswithreferenceto
KarnatakaStateOpenUniversity 57
FundFrom Operations 218,645,772 24.8 Redemptionof Debentures 11,000,000 1.25
Purchase of FixedAssets 10,227,244 1.16
Increase inWorkingCapital 642,716,175 72.88
Total 881,853,865 100 Total 881,853,865 100
0
10
20
30
40
50
60
70
80
Raise in deposits-Public Fund From Operations
75.2%
24.8%
SOURCES OF FUNDS
58. A studyonFundFlowandTrendAnalysiswithreferenceto
KarnatakaStateOpenUniversity 58
ANALYSIS:
From the above table, it can be analyzed as on 31/3/2013:
There is increase in working capital i.e., Rs. 642716175 comparing to
total funds proportion, it is 72.88%
The funds available through operations is Rs. 218645772 i.e., 24.80%
There is raise in public deposits – 75.20% as compared to 35% previous
year.
Also, there is purchase of fixed assets of 1.16%
Secured loads as decreased to 24.71%
INTERPRETATION:
0
10
20
30
40
50
60
70
80
Repayment of Loans
to Nationalized Banks
Redemption of
Debentures
Purchase of Fixed
Assets
Increase in Working
Capital
24.71%
1.25% 1.16%
72.88%
APPLICATION OF FUNDS
59. A studyonFundFlowandTrendAnalysiswithreferenceto
KarnatakaStateOpenUniversity 59
The Balance sheet of Karnataka Housing Board provides information on assets
and liabilities related to the board as at 31st March 2009. The changes in
carrying amount of assets and liabilities would reflect the outcome of operating,
investing and financial decisions in previous year and current. Also, it reflects
the effect of economic events of those periods.
Working capital increased becauseof increase in current assets. That is, board’s
current assets are more than the current liabilities. The position of working
capital is increasing from 2 years consistently. It indicates the sound financial
position of the board. The utilization of working capital is decreasing. The
current assets of the board are very high to meet out the current requirements. It
can be inferred through calculation of current ratio to know the liquidity
position of the board. Here, in the period of 2012-2013, it should be noted that
there is 72.88% of increase in working capital.
The ideal industry current ratio of 2:1 or more is considered to be satisfactory.
In 2009, current Assets (CA) were Rs. 11,241,845,367 & current liabilities (CL)
were Rs. 1,490,882,351 & Current Ratio = CA/CL = 11241845367/1490882351
= 7.54 times. It is higher ratio. So, it can be inferred that the higher the ratio, the
greater the margin of safety the larger the amount of current assets in relation to
current liabilities, the more the board’s ability to meet its current obligations.
Since the excess of current assets over current liabilities is showing idle funds in
the board. However study is required to understand whether the high current
ratio is good or bad for the board by comparing its norms of management policy
so as to ensure no funds are kept idle.
60. A studyonFundFlowandTrendAnalysiswithreferenceto
KarnatakaStateOpenUniversity 60
Though increase in working capital means improvement in current financial
position, but over and above the generally acceptable ratio results in ineffective
utilization of funds in the board.
Secured loans include – KHB Schemes and debentures. The major sourceof
funds for the board secured loans has decreased. This could be possible due to
funds from operations generated throughout the period. It can be said that loans
taken from nationalized banks are repaid from fund from operations according
to the obligations of board. KHB schemes are decreased by 217910446 i.e.,
24.71%.
Debentures were constant over the previous year of Rs.110 lakhs (1.25%) has
also been repaid at par value which become due on 31st march 2013.
The board’s othersources of funds also increased. There is increase in deposit
from public rather than other deposits such as deposits from contractors,
security deposits and so on.
Purchase of fixed assets suchas vehicle and office equipments were made in a
year i.e., 1.16%
Every year the depreciation is calculated on the basis of straight line method.
The bound is also investing by ploughing back the incomes earned. Hence, the
costof capital is low comprising higher risk of return on investments. Since it is
generating higher income, the question of risk is low in this current reporting
period.
61. A studyonFundFlowandTrendAnalysiswithreferenceto
KarnatakaStateOpenUniversity 61
BALANCE SHEET
BALANCE SHEET AS ON
Sources of funds 31/3/2011 31/3/2012 31/3/2013
Capital Funds Amount in Rs
Housing Fund 1,198,302,027 1,198,302,027 1,198,302,027
Reserves & Surplus 2,265,855,196 2,350,657,107 2,992,074,369
Total 3,464,157,223 3,548,959,134 4,190,376,396
secured Loans and
Borrowings 0 499,999,504 3,495,735,468
62. A studyonFundFlowandTrendAnalysiswithreferenceto
KarnatakaStateOpenUniversity 62
Current Liabilities and
Provisions
Deposits from Public 15,953,794,671 11,473,400,818 12,130,680,182
Deposits from Contractors 487,806,526 843,376,635 1,160,163,614
Other current Liabilities 3,505,091,756 3,372,039,351 9,176,019,230
Provisions for Income Tax 0 108,189,978 321,307,443
Total 19,946,692,953 15,797,006,782 22,788,170,469
Provision and Gratuity 200,000,000
Grand Total 23,410,850,176 19,845,965,420 30,674,282,333
TREND ANALYSIS ON BALANCE SHEET
TREND ANALYSIS ON BALANCE SHEET AS ON
Sources of funds 31/3/2011 31/3/2012 31/3/2013
Capital Funds Trend in %
Housing Fund 100.00 100.00 100.00
Reserves & Surplus 100.00 103.74 132.05
Total 100.00 102.45 120.96
secured Loans and Borrowings 0.00 100.00 699.15
63. A studyonFundFlowandTrendAnalysiswithreferenceto
KarnatakaStateOpenUniversity 63
Current Liabilities and
Provisions
Deposits from Public 100.00 71.92 76.04
Deposits from Contractors 100.00 172.89 237.83
Other current Liabilities 100.00 96.20 261.79
Provisions for Income Tax 0.00 100.00 296.98
Total 100.00 79.20 114.25
Provision and Gratuity 0.00 0.00 100.00
Grand Total 100.00 84.77 131.03
0.00
20.00
40.00
60.00
80.00
100.00
120.00
140.00
2011 2012 2013
100.00 102.45
120.96
Trend%
Years
CAPITAL FUND
65. A studyonFundFlowandTrendAnalysiswithreferenceto
KarnatakaStateOpenUniversity 65
ANALYSIS:
From the above table and graph:
It can be analyzed that, there is regularly increasing trend in the capital fund i.e.,
120.96%. The trend percentage of the capital fund during the year 2011 is taken
as 100 as a base year. It shows an increasing trend from 100 to 120.96% from
2011 to 2013.
It can be analyzed that the secured loans from the year 2011 to 2013 it has
gradually increased. The trend percentage of the secured loans and borrowing
during the year 2012 is taken 100 as a base year because in 2011 there was no
secured loans and borrowings. By 2013 the secured loans and borrowings ends
at 699.15%
From the graph, it is clear that there is growth in deposit from 2011 to 2013.
The trend percentage of the deposit during the year 2011 is taken as 100 as a
base year. There was a dip in percentage in 2012 to 79.20% but it again
increased to 114.25% by the year 2013.
INTERPRETATION:
It can be inferred that, there is a gradual increasing trend in the capital fund over
a period of past3 years. Capital funds constitutes both housing find and reserves
and surplus. This shows the financial position of Karnataka Housing Board and
indicates the improvement in the profitability position.
It can be inferred that, secured loans of the board was zero in 2011, then
increased in 2013. So there is an increase in KHB debentures and schemes.
Debentures are constant for 3 years from 2011 to 2013.
66. A studyonFundFlowandTrendAnalysiswithreferenceto
KarnatakaStateOpenUniversity 66
From tabulations and graph, we can see that there is an increase in trend of base
year 100% in 2011, then decrease in 2012 of 79.20% and then again increase in
2013. i.e., from base year 100% to present 114.25%. This can be inferred that
there is maximum deposits taken by the Board through the public when
compared to other deposits suchas contractors and other deposits like security
deposits. Etc.
BALANCE SHEET
BALANCE SHEET AS ON
Application 31/3/2011 31/3/2012 31/3/2013
Fixed Assets Amount in Rs
Gross Block 153,847,619 158,145,995 165,330,577
Less: Depreciation
64,429,613
71,435,184 71,327,755.86
Net Block 89,418,006
86,710,811
94,002,821
Current Assets, loans, Advances.
Etc
67. A studyonFundFlowandTrendAnalysiswithreferenceto
KarnatakaStateOpenUniversity 67
Vacant Houses or Sites 1,233,954,488 8,440,684,380 12,246,697,218
Land in Possession 2,991,704,520 2,305,388,588 2,363,401,828
WIP 7,164,933,837 4,865,824,294 11,024,708,025
Debtors 90,731,381 91,864,999 100,180,935
Cash and bank Balances 2,379,896,225 749,201,066 1,065,718,539
Loan and Advances 9,460,211,719 3,306,291,282 3,779,572,967
Total 23,321,432,170 19,759,254,609 30,580,279,512
Grand Total 23,410,850,176 19,845,965,420 30,674,282,333
TREND ANALYSIS ON BALANCE SHEET
Trend Analysis on Balance sheet as on
Application 31/3/2011 31/3/2012 31/3/2013
Fixed Assets Trend in %
Gross Block 100.00 102.79 107.46
Less: Depreciation 100.00 110.87 110.71
Net Block 100.00 96.97 105.13
68. A studyonFundFlowandTrendAnalysiswithreferenceto
KarnatakaStateOpenUniversity 68
Current Assets, loans, Advances.
Etc
Vacant Houses or Sites 100.00 684.04 992.48
Land in Possession 100.00 77.06 79.00
WIP 100.00 67.91 153.87
Debtors 100.00 101.25 110.41
Cash and bank Balances 100.00 31.48 44.78
Loan and Advances 100.00 34.95 39.95
Total 100.00 84.73 131.13
Grand Total 100.00 84.77 131.03
92.00
94.00
96.00
98.00
100.00
102.00
104.00
106.00
2011 2012 2013
100.00
96.97
105.13
Trend%
Years
FIXED ASSET
69. A studyonFundFlowandTrendAnalysiswithreferenceto
KarnatakaStateOpenUniversity 69
ANALYSIS:
From the table and graph
It can be analyzed that the fixed assets in the year 2011 has been decreased form
100% to 96.97% but it has again increased in the year 2013 up to 105.13%
There was a decrease in current assets in 2012 of 84.73% compare to the base
Trent of 100% in year 2011 but it was increased in the year 2013 with 131.13%
of ratings.
0.00
20.00
40.00
60.00
80.00
100.00
120.00
140.00
2011 2012 2013
100.00
84.73
131.13
Trend%
Years
CURRENTASSETS
70. A studyonFundFlowandTrendAnalysiswithreferenceto
KarnatakaStateOpenUniversity 70
INTERPRETATION:
It can be inferred that there is lot of fluctuations in fixed assets trend. This
fluctuations show that the policy of the board is good in 2013. The purchase of
fixed assets is from the long term sources of finance.
From the above graph, it can be inferred that the current assets are more than the
current liabilities over the past 3 years. Higher the working capital, higher the
liquidity position of the company. Therefore the board as increasing trend which
indicates there is a good financial position and higher availability fund is there
in the board. Also there is increase in loans and advances which are given by the
board. Cash and bank balances are decreased and inventory is fluctuating from
2011 to 2013.
INCOME AND EXPENDITURE ACCOUNT
Income as on
Amount in Rs
Particulars 31.03.2011 31.03.2012 31.03.2013
Income fromSales/Service 1824647893 4648894761 6605311112
Income earnedfromPropertiesof the board 58175018 43818455 49216786
InterestIncome earned 86089984 103223274 49944542
OtherIncome (fromHousing schemes) 425306294 594213403 812220239
71. A studyonFundFlowandTrendAnalysiswithreferenceto
KarnatakaStateOpenUniversity 71
Total Income : A 2394219189 5390149893 7516692679
Expenditure as on
Amount in Rs
Particulars 31.03.2011 31.03.2012 31.03.2013
EstablishmentExpenses 184962122 520118010 481331822
OtherAdministrationExpenses 320947083 259193009 218869033
Total B 505909205 779311019 700200855
NetExpenditure forthe year 505909205 779311019 700200855
Financial charges/Interest 859973 1725531 181412713
Depreciation 6834606 7006121 278706
Cost of salesof housesandsites 1625146571 4409115332 5945099871
Sub Total C 1632841150 4417846985 6126791290
Total Expenditure B+C 2138750355 5197158004 6826992145
Excessbalance of income over Expenditure (A-B) 255468834 192991889 689700534
Income related to Prior Period 48150984 0 0
Provisionfor taxation 0 108189978 213117465
Balance beingSurplus transferred 0 84801911 476583069
Total 2394219189 5390149893 7516692679
TREND ANALYSIS ON INCOME AND EXPENDITURE ACCOUNT
Trend analysis on Income:
Income as on
Particulars 31.03.2011 31.03.2012 31.03.2013
Income fromSales/Service 100.00 254.78 362.00
Income earnedfromPropertiesof the board 100.00 75.32 84.60
InterestIncome earned 100.00 119.90 58.01
72. A studyonFundFlowandTrendAnalysiswithreferenceto
KarnatakaStateOpenUniversity 72
OtherIncome (fromHousing schemes) 100.00 139.71 190.97
Total Income : A 100.00 225.13 313.95
Trend analysis on Expenditure:
Expenditure as on
Particulars 31.03.2011 31.03.2012 31.03.2013
EstablishmentExpenses 100.00 281.20 260.23
OtherAdministrationExpenses 100.00 80.76 68.19
Total B 100.00 154.04 138.40
NetExpenditure forthe year 100.00 154.04 138.40
Financial charges/Interest 100.00 200.65 210.95
Depreciation 100.00 102.51 4.08
Cost of salesof housesandsites 100.00 271.31 365.82
Sub Total C 100.00 270.56 375.22
Total Expenditure B+C 100.00 243.00 319.20
Total 100.00 225.13 313.95
74. A studyonFundFlowandTrendAnalysiswithreferenceto
KarnatakaStateOpenUniversity 74
ANALYSIS:
Sales has been increased from the year 2011 to 2013
Interest income has been decreased to 58.01%
Income earned from the properties of the Board has been on lower side
Other incomes has been increased from base Trend of 100% in 2011 to
190.97% in the year 2013
INTERPRETATION:
It can be interpreted that during the year 2011 to 2013 the total income of the
board has been increased from 100% to 313.95%
Other administration expenses has been decreasing from 100% in 2011 to
68.19% in 2013, this is a positive indication for the KHB.
Due to increase in the properties and land cost, the company’s operating profit
percentage have been decreasing, but in 2008 irrespective of increase in the both
the costa slight increase in the operating profit percentage.
Net expenditure was increased from 100% in 2011 to 154.04% in 2012, but the
net expenditure was decreased from 154.04% in 2012 to 138.40% in 2013
giving the positive signs to the KHB.
CHAPTER:11
75. A studyonFundFlowandTrendAnalysiswithreferenceto
KarnatakaStateOpenUniversity 75
SUMMARY OF FINDINGS, SUGGESTIONSAND CONCLUSION
FINDINGS:
The final stage in the statistical enquiry relates to the interpretation of the data
i.e., drawing local and meaningful conclusion from data collected. Interpretation
is concerned with establishing relationships with in the collected data and it is
essential for research findings.
The balance sheet of Karnataka Housing Board provides information on assets
and liabilities related to the board as at 31st March 2011 to 31st March 2012. The
changes in carrying amount of assets and liabilities would reflect the outcome of
operating, investing and financial decisions in previous year and current year.
Also, it reflects the effect of economic events of those periods.
The Income and Expenditure Account summarizes the outcome of excess of
income over expenditure during the current period. The Balance sheet and the
income and expenditure account is prepared on the basis of accrual accounting
concept. In research, two tools are used to interpret the board’s position namely:
Fund Flow Statement:
The analysis and interpretation includes statement of working capital changes,
fund from operations and fund flow statement is calculated for the years 2011-
2012, 20012-2013.
76. A studyonFundFlowandTrendAnalysiswithreferenceto
KarnatakaStateOpenUniversity 76
Trend Analysis:
The analysis and interpretation is dome by means of balance sheet and income
and expenditure accounts of 2011 to 2013.
FUND FLOW ANALYSIS
In 2011, there was increase in working capital i.e., Rs. 2724545082
comparing to total funds proportion, it is 95.88%
The funds available through operations is Rs. 339845172 i.e., 11.95% and
there is raise in public deposits around 87.94% and increase in housing
fund about 0.11%.
Also, purchase of fixed assets of 0.21% and loans are taken through
nationalized banks around 3.91%.
In 2012, there was increase in working capital i.e., Rs. 1577325477
comparing to 87.94%.
The funds available through operations is Rs. 243725042 i.e., 15.45%
there is raise in public deposits – 35.92% as compared to 87.94%
Also, sale of fixed assets of 0.03% Secured loans are raised up to 48.60%
In 2013, there was increase in working capital i.e., Rs. 642716175
comparing to total funds proportion, it is 72.88%
The funds available through operations is Rs. 218645772 i.e., 24.80%
There is raise in public deposits – 75.20% as compared to 35% previous
year and purchase of fixed assets are made to 1.16%
Secured loans have decreased to 24.71%
77. A studyonFundFlowandTrendAnalysiswithreferenceto
KarnatakaStateOpenUniversity 77
TREND ANALYSIS
It is found that an increase trend in the capital fund is 120.96%. The trend
percentage of the capital fund during the year 2011 is taken as 100 as a
base year. It shows an increased trend by 38.77% from 2010 to 2013.
The secured loans from the year 2010 to 2013 has been decreasing in
2012 and is increased in 2013 from 100% to 699.15% over the past3
years
It is clear that there is a growth in deposits from the year 2010 to 2013.
The base is fixed at 100% in 2011. Then there is a decrease to 79.20% in
2012 later we can see the increase to 114.25% in 2013
It can be found out that the fixed assets in the years 2010 has been
decreased from 100% to 96.97% but it has increased in the year 2013 up
to 105.13%
There is an decrease in current assets from 100% to 84.73% in 2012 later
it increased to 131.13% in 2013
It can be seen that the working capital has been increased from 156.68%
in 2011 to 202.87% in 2013.
In income and expenditure account, sales are increased from the year
2010 to 2013, Interest income has been decreased to 58.01%
Rend and lease rent has decreased over the years. Other incomes also
decreased.
Coston sales of house and sites has been Increased.
Financial charges has been increased and other Administration expenses
has been decreased from 2010-2013.
It is clear that there is a growth in deposits from the year 2010 to 2013.
The base is fixed at 100% in 2011. Then there is a decrease to 79.20% in
2012 later we can see the increase to 114.25% in 2013
78. A studyonFundFlowandTrendAnalysiswithreferenceto
KarnatakaStateOpenUniversity 78
SUGGESTIONS:
The increase in working capital means improvement in current financial
position, but over and above the generally acceptable ratio results in
ineffective utilization of funds in the board. Funds should be deployed in
the business to avoid idling of funds.
The board is required to understand whether the high current ratio is good
or bad for the board by comparing its norms of management policy so
that the funds are kept idle.
As sales are fluctuating from years, the costof works sold should be
controlled properly in earn higher operating profit.
It should adoptmore sophisticated technology in constructions.
CONCLUSIONS:
The Project report “A STUDY OF FUND FLOW AND TREND ANALYSIS
WITH REFERENCE TO KARNATAKA HOUSING BOARD” was carried
out by taking its using important objectives. The financial analysis of the KHB
is made by using various techniques like fund flow and trend analysis, financial
statement as published report of annual accounts gives clear and correct data.
The financial analysis of the KH is very sound and it’s performing well over the
years. Thus, after evaluating and analyzing the flow of funds of the KHB. It is
found that the liquidity position of the KHB is very sound.
ANNEXURES
100-HOUSING PROJECTS COMPLETED
86. A studyonFundFlowandTrendAnalysiswithreferenceto
KarnatakaStateOpenUniversity 86
28
LIG high rise
apartments Kengeri
Block-II (Hoskote)
29
Construction of
Staff Qtrs at
Vijayanagar
(Kolar)
Bangalore 0.82 79 2200.00
Grand Total 1457.24 17639 16806 2156 132260.71
SUVARNA KARNATAKA PROJECTS UNDER FORMULATION
Sl.
No
Place District
Extent of
land in
Acres
Total
No. of
Plots
No. of
Sites
No. of
Houses
Project
Cost
1
Hesaraghatta
Hobli, Bangalore
North Tq.
Bangalore
Urban
300.00 4200 3780 420 23940.00
2
Tavarekere Hobli,
Bangalore South
Bangalore
Urban
200.00 2800 2520 280 15960.00
3 Ramanagar
Bangalore
Rural
20.00 280.00 250.00 30.00 570.00
4 Shikharipura Shimoga 10.00 140.00 125.00 15.00 285.00
5 Udupi Udupi 10.00 140.00 125.00 15.00 285.00
6 D.N. Koppa Dharwad 10.00 140 125 15 285.00
7
Thakkalekoti,
Siraguppa
Bellary 10.00 140 125 15 285.00
Grand Total 560 7840 7050 790 41610
87. A studyonFundFlowandTrendAnalysiswithreferenceto
KarnatakaStateOpenUniversity 87
225 HOUSING SCHEMES ON GOING PROJECTS
Sl.
No.
Place District
Extent of
Land
A-G
Total
No.of
plots
No. of
Sites
No.of
Houses
Project
Cost Rs. in
lakhs
1 CHS at Bydagi Haveri 19.13 291 261 30 1101.00
2
CHS at Suryanagar
phase-II Block-V
Bangalore
(U)
86.13 863 863 46
45180.00
CHS at Suryanagar
phase-II Block-VI
Bangalore
(U)
110.12 150 100 50
Suryanagar phase-II
Block-VII
Bangalore
(U)
80.12 2783 2667 50
CHS atSuryanagar
phase-II Block-VIII
Bangalore
(U)
75.90 2732.00 2667.00 65
CHS atSuryanagar
phase-II Block-IX
Bangalore
(U)
89.10 2798 2759 39
3
CHS at
Hiremalligewada
Dharwad 57.05 632.00 632.00 42.00 2900.00
4 CHS at Gunahalli Bidar 49.39 1728 1728 28 2018.00
5
CHS at Amargol
Phase-II
Dharwad 109.21 1403.00 1403.00 47.00 4800.00
88. A studyonFundFlowandTrendAnalysiswithreferenceto
KarnatakaStateOpenUniversity 88
6
CHS at Talikote
Phase II Bijapur
Bijapur 29.00 377.00 377.00 55.00 1805.00
7 CHS at Gaddanakeri Bagalkot 17.31 277.00 277.00 25.00 938.00
8
CHS at Gulbarga
(Shiekroza)
Gulbarga 25.00 832.00 13685.00
9
CHS at
Mahalabagayath
Phase-I
Bijapur 170.00 1960 1860 100 8688.50
CHS at Bijapur Bijapur 175.00 2751 2703 48 10142.00
CHS at Bijapur Bijapur 100.00 1317 1304 13 4801.00
Housing scheme at
Mahalabagayath
Phase-II
Bijapur 100 3578.72
10
Proposed
construction of LIG
high rise
apartments at
Suryanagar Ph-I
Bangalore
(U)
5.00 192 3400.00
Proposed
construction of MIG
high rise
apartments at
Suryanagar Ph-I
Bangalore
(U)
5.00 192 5800.00
11
Proposed
Construction of 10
LIG & 10 MIG
Tumkur 20 290.00
89. A studyonFundFlowandTrendAnalysiswithreferenceto
KarnatakaStateOpenUniversity 89
houses at
Idenahally -Tiptur in
Tumkur district
12 CHS at Babaleshvara Bijapur 23.11 388 385 3 855.00
13 CHS at Manvi Raichur 82.12 1171 1091 80 4310.00
14
CHS at Shorapur
2nd Phase
Yadgir 11.03 333 303 30 1300.00
15
CHS at Gokak 2nd
Ph
Belgaum 9.15 140 110 30 1280.00
16
CHS at Yaradakatte
in Hiriyur
Chitradurga 28.00 367 342 25 1273.00
17
CHS at
Kalaganur Kushnur
Gulbarga 84.23 934 794 140 5055.00
18
Proposed CHS at
Suryanagar Ph-III of
Block-I at Jigala in
Anekal talluk.
Bangalore 102.06 985 885 100
52875.00
Proposed CHS at
Suryanagar Ph-III of
Block-II at Jigala in
Anekal talluk.
Bangalore 108.20 1110 1010 100
Proposed CHS at
Suryanagar Ph-III of
Block-III at Jigala in
Anekal talluk.
Bangalore 118.87 1215 1115 100
90. A studyonFundFlowandTrendAnalysiswithreferenceto
KarnatakaStateOpenUniversity 90
Proposed CHS at
Suryanagar Ph-III of
Block-V at Jigala in
Anekal talluk.
Bangalore 102.77 350 330 20
Proposed CHS at
Suryanagar Ph-III of
Block-VII at Jigala in
Anekal talluk.
Bangalore 664.56 869 829 40
19
CHS at Muddapura
and
Kakaramanahalli
Bidadi Hobli,
Ramanagar dist.
Ramanagar 99.35 1072 1056 16 9890.00
20
Composite Housing
Scheme at
Muddebihal
Bijapur 69.00 1007 977 30 3730.00
21
Composite Housing
Scheme at Huskur
Bangalore 28.00 163 79 84 4102.00
22
Composite Housing
Scheme at
Chellakere
Chitradurga 50.00 771 762 9 1870.00
TOTAL 3016.08 33190.00 31737 2966 197437.22
Source: Company Record
91. A studyonFundFlowandTrendAnalysiswithreferenceto
KarnatakaStateOpenUniversity 91
BIBLIOGRAPHY
MANAGEMENT ACCOUNTING, FIRST EDITION, KALYANI
PUBLISHERS BY SHASHI.K.GUPTA AND R.K.SHARMA
ACCOUNTING FOR MANAGEMENT,4TH
EDITION,
HIMALAYA PUBLISHING HOUSE BY DR.JAWAHAR LAL
MANAGEMENT ACCOUNTING, 2006EDITION,HIMALAYA
PUBLISHING HOUSE BY M.N.ARORA
FINANCIAL STATEMENT ANALYSIS, 2007 DEITION, BY
ASISH.K.BHATTACHARYA.
CITATIONS
WWW.KHBONLINE.COM
WWW.KARNATAKAHOUSING.COM
WWW.KARNATAKAHOUSING.ORG