
Recommended
More Related Content
What's hot
What's hot (20)
Viewers also liked
Similar to Mackie Research: Northern Graphite & Refactory Market Dynamics (Feb 21, 2012)
Similar to Mackie Research: Northern Graphite & Refactory Market Dynamics (Feb 21, 2012) (20)
More from Graphite Graphite
More from Graphite Graphite (20)
Recently uploaded
Recently uploaded (20)
Mackie Research: Northern Graphite & Refactory Market Dynamics (Feb 21, 2012)
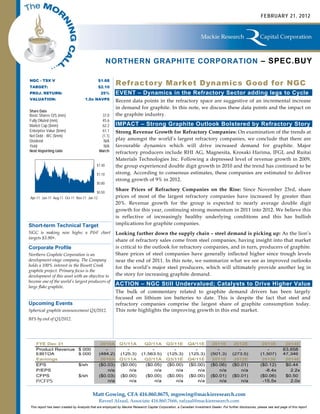
- 1. FEBRUARY 21, 2012 NORTHERN GRAPHITE CORPORATION – SPEC.BUY NGC - TSX V TARGET: $1.68 $2.10 Refractory Market Dynamics Good for NGC PROJ. RETURN: 25% EVENT – Dynamics in the Refractory Sector adding legs to Cycle VALUATION: 1.0x NAVPS Recent data points in the refractory space are suggestive of an incremental increase in demand for graphite. In this note, we discuss these data points and the impact on Share Data Basic Shares O/S (mm) 37.0 the graphite industry. Fully Diluted (mm) 45.6 Market Cap ($mm) 62.2 IMPACT – Strong Graphite Outlook Bolstered by Refractory Story Enterprise Value ($mm) 61.1 Strong Revenue Growth for Refractory Companies: On examination of the trends at Net Debt - WC ($mm) (1.1) Dividend N/A play amongst the world’s largest refractory companies, we conclude that there are Yield N/A favourable dynamics which will drive increased demand for graphite. Major Next Reporting Date March refractory producers include RHI AG, Magnesita, Krosaki Harima, IFGL and Ruitai Materials Technologies Inc. Following a depressed level of revenue growth in 2009, $1.40 the group experienced double digit growth in 2010 and the trend has continued to be $1.10 strong. According to consensus estimates, these companies are estimated to deliver strong growth of 9% in 2012. $0.80 Share Prices of Refractory Companies on the Rise: Since November 23rd, share $0.50 Apr-11 Jun-11 Aug-11 Oct-11 Nov-11 Jan-12 prices of most of the largest refractory companies have increased by greater than 20%. Revenue growth for the group is expected to nearly average double digit growth for this year, continuing strong momentum in 2011 into 2012. We believe this is reflective of increasingly healthy underlying conditions and this has bullish Short-term Technical Target implications for graphite companies. NGC is making new highs; a P&F chart Looking further down the supply chain – steel demand is picking up: As the lion’s targets $3.90+. share of refractory sales come from steel companies, having insight into that market Corporate Profile is critical to the outlook for refractory companies, and in turn, producers of graphite. Northern Graphite Corporation is an Share prices of steel companies have generally inflected higher since trough levels development-stage company. The Company near the end of 2011. In this note, we summarize what we see as improved outlooks holds a 100% interest in the Bissett Creek for the world’s major steel producers, which will ultimately provide another leg in graphite project. Primary focus is the development of this asset with an objective to the story for increasing graphite demand. become one of the world’s largest producers of large flake graphite. ACTION – NGC Still Undervalued; Catalysts to Drive Higher Value The bulk of commentary related to graphite demand drivers has been largely focused on lithium ion batteries to date. This is despite the fact that steel and Upcoming Events refractory companies comprise the largest share of graphite consumption today. Spherical graphite announcement Q1/2012. This note highlights the improving growth in this end market. BFS by end of Q1/2012. FYE Dec 31 2010A Q1/11A Q2/11A Q3/11E Q4/11E 2011E 2012E 2013E 2014E Product Revenue $ 000 - - - - - - - - 63,658 EBITDA $ 000 (484.2) (125.3) (1,563.5) (125.3) (125.3) (501.3) (273.5) (1,507) 47,346 Earnings 2010A Q1/11A Q2/11A Q3/11E Q4/11E 2011E 2012E 2013E 2014E EPS $/sh ($0.03) ($0.00) ($0.05) ($0.00) ($0.00) ($0.06) ($0.01) ($0.12) $0.44 P/EPS n/a n/a n/a n/a n/a n/a n/a -8.4x 2.2x CFPS $/sh ($0.03) ($0.00) ($0.00) ($0.00) ($0.00) ($0.01) ($0.01) ($0.06) $0.50 P/CFPS n/a n/a n/a n/a n/a n/a n/a -15.5x 2.0x Matt Gowing, CFA 416.860.8675, mgowing@mackieresearch.com Raveel Afzaal, Associate 416.860.7666, rafzaal@mackieresearch.com This report has been created by Analysts that are employed by Mackie Research Capital Corporation, a Canadian Investment Dealer. For further disclosures, please see last page of this report.
- 2. www.mackieresearch.com The MORNING CALL – NORTHERN GRAPHITE CORPORATION Page 2 REFRACTORIES ANOTHER KEY DRIVER IN GROWING GRAPHITE DEMAND In the points below, we summarize the key trends taking place in the refractory and steel markets as they relate to demand for graphite. What are refractory products? Refractories are essentially fire bricks that line blast furnaces which are used predominantly in steel making. Due to graphite’s ability to withstand high temperatures, it is added to the bricks to provide strength and resistance to wear and corrosion. On page 2, we provide a table listing some of the largest refractory companies. The data that we have gathered suggests a positive outlook for these companies. Key refractory trends include vertical integration, rising raw material costs, and increasing market fragmentation: In our October 6, 2011 note, we provided an update on trends in the refractory market as it related to large flake graphite producers. In this note, we revisit these trends, and present our view that dynamics at play in the refractory market bode well for producers and project developers of high-purity, large flake graphite. Over the near to mid-term, we expect growth in the refractory market to accelerate to compliment a continuation of strong trends in the lithium ion battery market, where approximate growth is running at 25-30% per year. The key refractory trends that we are referring to are discussed in greater detail below: A scarcity has contributed to refractory raw material input cost inflation, and has been a key driver in graphite prices nearly tripling over the past 18 months or so. Based on our discussions with refractory companies, we understand that one of the key drivers to rising graphite prices has been the emergence of new technologies such as the lithium ion battery, and the manufacturers of these products are competing to access graphite supply with the major traditional buyers of the material. To combat escalating costs for a key input, graphite, the refractory manufacturers are exploring avenues to vertically integrate their access to graphite resources by pursuing investments in graphite mines directly. With over 70% of the world’s graphite produced in China, the refractory companies are particularly interested in graphite mines located in the western hemisphere. The largest refractory companies are mainly located in South America, Europe, and the United States, and thus there is a concerted effort to reduce China’s control on the graphite market. Magnesita Refratarios S.A. (MAGG3-BR) is one of the world’s largest producers of refractory products and its initiative to develop its Almenara graphite mine is an example of this. However, we believe one of the issues that developers of these new graphite mines are going to have is an inadequate amount of large flake content. Like manufacturers of lithium ion batteries, we believe the refractory makers also benefit from the greater production yields and therefore lower costs provided by using larger flake natural graphite. Furthermore, to make the development of these new graphite mines economic for the refractory company, it is likely that a substantial amount of the mine’s graphite concentrate will have to be sold to other purchasers, rather than be used entirely in one refractory company’s supply chain, the mine developer. Because most of the graphite mines being developed worldwide are small flake and amorphous in nature, the prices that may be realized from graphite concentrate sales will be much lower than those prices realized on large flake graphite sales, and many times, barely cover the cost of production. Northern Graphite Corporation is an attractive take-out candidate, in part, for this reason. 80% of the graphite at its mine is large flake, and therefore NGC should generate premium gross profit margins when it starts production. The graphite mineralization at the Bissett Creek mine comes to surface which contributes to a highly economic operation. Furthermore, the asset is located in Central Ontario, Canada, close to important manufacturing supply chains in Canada and the United States. A flood of new entrants into the refractory business, and an increasingly fragmented competitive landscape has been another factor in gross margin pressures for refractory producers. This factor positively impacts margins of raw material suppliers into the refractory supply chain, including graphite producers. An increasing number of refractory producers requiring an increasing amount of raw materials to feed their busy facilities has clearly positive implications for their raw material suppliers. As we observe a number of the refractory companies complain of increasing competition pressuring their margins, we believe a weak bargaining position of the refractory makers relative to their graphite suppliers will continue. While some of the larger refractory companies would like to merge, in part, to increase their
- 3. www.mackieresearch.com The MORNING CALL – NORTHERN GRAPHITE CORPORATION Page 3 bargaining power with raw material providers, recent comments by the CEO of RHI indicate that anti-trust limitations make the prospect of large scale industry consolidation doubtful. BACKGROUND: GRAPHITE AND THE REFRACTORY INDUSTRY Graphite use: Graphite is used in several industries due to its metallic and non-metallic properties. As shown in figure 1, refractories and steel together account for about 41% of the total graphite market. It is estimated that 70% of the refractory output is used by the steel industry. Therefore, we focus on the demand outlook for the refractory industry as well as the steel industry in this note to analyze the demand outlook for the graphite industry. Figure 1. Natural Graphite Demand By Industry Natural Graphite Dem and By Application Other, 10% Lubricants, 14% Steel & Refractories, 41% Automotive parts, 14% Batteries, 10% Carbon brushes , Steel & Refractories 11%Carbon brushes Batteries Automotive parts Lubricants Other Source: Northern Graphite Corporation, Mackie Research Capital The following points support our investment thesis for robust demand outlook for the refractory industry: Positive company guidance and analyst expectations: In figure 2, we summarize consensus analyst estimates for large multinational refractory operators around the world. After a steep decline in sales growth in 2009, we have witnessed a sharp rebound in sales growth which is expected to continue into 2012. Figure 2. Consensus Sales Estimates For Major Companies In The Refractory Industry Refractory Comps Market Cap 2008A 2009A 2010A 2011E 2012E 2013E Consensus Estimates Location Ticker ($m) Sales (mm) Sales (mm) Sales (mm) Sales (mm) Sales (mm) Sales (mm) RHI AG Austria RHI AV 762 1,597 1,237 1,523 1,683 1,656 1,702 Magnesita Refratarios Brazil MAGG3 BZ 2,015 1,466 1,927 2,276 2,315 2,502 2,703 IFGL Refractories Ltd India IFGL IN 26 3,780 3,982 4,152 5,130 6,150 - Ruitai Materials Technologies Inc. Japan 002066 CH 1,444 420 490 841 1,876 2,316 - Krosaki Harima Corporation Japan 5352 JT Yen 95,376 96,322 82,874 - - - RHI Annual Growth (%) -23% 23% 11% -2% 3% Vesuvius Annual Growth (%) 3% 22% Magnesita Annual Growth (%) 31% 18% 2% 8% 8% IFGL Annual Growth (%) 5% 4% 24% 20% Krosaki Annual Growth (%) 1% -14% Average Annual Growth (%) 4% 11% 12% 9% 5% Source: Bloomberg (sales numbers are in company reporting currency) Japan as an additional growth catalyst: The devastating earthquake in Japan had a negative impact on important steel consuming industries such as automotive and electronic sectors. We are expecting a strong rebound in steel demand out of Japan as reconstruction efforts ramp up. This should help supplement the robust demand growth expected in China, India and other emerging economies.
- 4. www.mackieresearch.com The MORNING CALL – NORTHERN GRAPHITE CORPORATION Page 4 U.S. demand for refractory products to increase at 8% per annum until 2014: Freedonia Group in its December 2010 report forecasts an 8% annual increase in demand for refractory products until 2014. The robust growth is expected to be driven by a recovery in U.S. crude steel production which plummeted between 2004 and 2009. EU expects positive growth in the steel industry: European Confederation of Iron and Steel Industries (EUROFER) predicts that steel production will increase by 6% and 4% in 2011 and 2012, respectively in its July 2011 report. We believe that a positive outlook on steel production out of Europe is an important indicator as it is currently suffering the brunt of economic uncertainty. This implies that steel industry growth outlook for China and India should be much higher than 4% for 2012. These factors have played an important role in driving the share prices up for the refractory companies discussed above. We note that with the exception of Ruitai Materials Technologies Inc, RHI AG, Magnesita, Krosaki Harima Corporation and IFGL Refractories Ltd have all experienced share price percentage increases well into double digits compared to November 23rd, 2011 prices. Figure 3. Share Price Performance of Major Companies In The Refractory Industry Relative Share Price Performance Change in Share Prices (Indexed to Nov 23 '11 Prices 50% 40% 30% 20% RHI AG IFGL Refractories Ltd 10% Ruitai Materials Technologies Inc. Krosaki Harima Corporation 0% Magnesita Refratarios 11/23/2011 11/30/2011 12/7/2011 12/14/2011 12/21/2011 12/28/2011 1/4/2012 1/11/2012 1/18/2012 1/25/2012 2/1/2012 2/8/2012 2/15/2012 -10% -20% -30% Source: Thomson One RECOVERY IN THE STEEL INDUSTRY POSITIVE FOR REFRACTORY DEMAND ArcelorMittal (MT NA, Unrated), a global steel company with particular focus in Europe and North America said in its 2012 guidance that it expects 1H 2012 EBITDA to represent an improvement over the 2H 2011 level. The CEO commented that “Despite the continued uncertainty in this market, we are seeing an improvement in sentiment compared with the fourth quarter.” Tata Steel (TATA IN, Unrated), another global steel company with a focus in Asia stated that Steel demand in India is expected to rebound and reconstruction activities in Thailand should boost long products demand in South East Asia. Voestalpine AG (BOE VI, Unrated), Austria’s largest steelmaker commented in February that “a negative trend in its steel unit reversed at the start of 2012.” Economic development is characterized by strong, early phase demand growth in steel. Therefore, below, we present a chart showing that global economic indicators have rebounded in 2012. After an extended period of difficult conditions for the steel producers, we are encouraged to hear the outlooks improve of the major companies operating in this sector. Preliminary economic data points
- 5. www.mackieresearch.com The MORNING CALL – NORTHERN GRAPHITE CORPORATION Page 5 are also suggestive of a broad geographic recovery. Because the steel market comprises over 70% of demand from refractory customers, we expect this recovery to benefit this sector as well, and further, provide an uptick in raw material demand for items such as graphite, alumina, and magnesia. Figure 4: Global Economic Indicators Showing Signs Of Improvement Source: Bloomberg, TATA Steel
- 6. www.mackieresearch.com The MORNING CALL – NORTHERN GRAPHITE CORPORATION Page 6 RISKS TO TARGET Risks include events that lead to graphite price cyclicality such as actions by Chinese producers who supply up to 80% of the world’s graphite and have dumped product onto the markets in the past and pressured prices. Furthermore, 9.75mm of NGC shares are owned by Industrial Minerals Inc, a bulletin board listed Company whose value is entirely comprised of this ownership stake. RELEVANT DISCLOSURES APPLICABLE TO: NORTHERN GRAPHITE CORPORATION 1. None Applicable. ANALYST CERTIFICATION Each analyst of Mackie Research Capital Corporation whose name appears in this report hereby certifies that (i) the recommendations and opinions expressed in this research report accurately reflect the analyst’s personal views and (ii) no part of the research analyst’s compensation was or will be directly or indirectly related to the specific conclusions or recommendations expressed in this research report. Information about Mackie Research Capital Corporation’s Rating System, the distribution of our research to clients and the percentage of recommendations which are in each of our rating categories is available on our web site at www.mackieresearch.com. The information contained in this report has been drawn from sources believed to be reliable but its accuracy or completeness is not guaranteed, nor in providing it does Mackie Research Capital Corporation assume any responsibility or liability. Mackie Research Capital Corporation, its directors, officers and other employees may, from time to time, have positions in the securities mentioned herein. Contents of this report cannot be reproduced in whole or in part without the express permission of Mackie Research Capital Corporation. (US Institutional Clients - Mackie Research USA Inc., a wholly owned subsidiary of Mackie Research Capital Corporation, accepts responsibility for the contents of this report subject to the terms and limitations set out above. US firms or institutions receiving this report should effect transactions in securities discussed in the report through Mackie Research USA Inc., a Broker-Dealer registered with the Financial Industry Regulatory Authority (FINRA)). Toronto 416.860.7600 - Montreal 514.399.1500 - Vancouver 604.662.1800 - Calgary 403.218.6375 - Regina 306.566.7550 - St. Albert 780.460.6460