SlideShare a Scribd company logo
1 of 9
Download to read offline
The data is based on 2013 emissions submitted to the European Pollution Release and Transfer Registry, except for 2015 CO2 data which is from EU ETL.
Grey = data is not reported or emissions are below the reporting threshold.
Austria Pollution Emitted (tonnes)
Power station name
Premature
deaths
# out of
257
Chronic
bronchitis
Hospital
admissions
Lost working
days
Child
asthma
attacks
€m health cost high
range*
CO2 emissions,
tonnes (2015)
# out of
243
SO2
# out of
237
NOx
# out of
252
PM10
# out of
116
Mercury
# out of
152
Duernrohr 10 189 0 10 2 430 180 20 565 110 175 258 227 648 181 76 95 0,00
Mellach 10 189 10 10 2 040 210 20 869 484 147 0 587 188 0 0,00
Belgium Pollution Emitted (tonnes)
Power station name
Premature
deaths
# out of
257
Chronic
bronchitis
Hospital
admissions
Lost working
days
Child
asthma
attacks
€m health cost high
range*
CO2 emissions,
tonnes (2015)
# out of
243
SO2
# out of
237
NOx
# out of
252
PM10
# out of
116
Mercury
# out of
152
Genk-Langerlo 40 123 20 30 11 240 740 100 1 904 278 101 965 170 1 510 132 0 0,05 65
Bulgaria Pollution Emitted (tonnes)
Power station name
Premature
deaths
# out of
257
Chronic
bronchitis
Hospital
admissions
Lost working
days
Child
asthma
attacks
€m health cost high
range*
CO2 emissions,
tonnes (2015)
# out of
243
SO2
# out of
237
NOx
# out of
252
PM10
# out of
116
Mercury
# out of
152
Maritsa East 2 730 2 370 640 192 820 18 150 2 000 11 293 658 10 54 100 2 11 500 20 0 0,00
Bobov Dol 470 6 240 390 123 280 11 680 1 290 2 458 329 81 36 600 3 3 470 63 2 230 5 0,00
ContourGlobal Maritsa East 3 140 48 70 130 37 140 3 510 380 5 759 680 32 10 300 27 2 450 92 0 0,00
Republika 70 90 40 60 18 930 1 800 200 456 894 181 5 180 65 1 380 139 0 0,00
Deven 50 108 20 50 10 340 1 150 130 1 455 781 123 1 750 122 2 840 81 163 60 0,00
AES Galabovo 50 108 20 50 11 240 1 130 130 4 187 675 53 2 580 94 1 780 119 0 0,00
Maritsa 3 20 161 10 20 4 700 460 50 20 014 237 1 180 152 550 194 0 0,00
Ruse Iztok 20 161 10 20 3 650 420 50 430 510 183 524 197 1 180 151 60 106 0,00
Brikel 20 161 10 20 4 170 410 50 956 267 140 1 030 165 520 201 0 0,00
Sliven 20 161 10 20 4 490 420 50 0 1 250 148 287 225 0 0,00
Plovdiv North 10> 232 0 0 190 20 0 0 0 115 251 0 0,00
At the end of 2015 there were approximately 280 coal power stations in operation in the EU. For 257 out of these 280 the relevant pollution data from 2013 is the most recent and complete official dataset available, and so it was this which formed the basis of the
modelling undertaken for the ‘Europe’s Dark Cloud’ report1. Below is the list of these 257 plants and their associated health impacts as well as CO2 emissions2
.
Supplement to Europe's Dark Cloud report
List of EU coal power plants
# Gives the number of power stations for which emissions data was available for the
respective pollutant.
Czech Republic Pollution Emitted (tonnes)
Power station name
Premature
deaths
# out of
257
Chronic
bronchitis
Hospital
admissions
Lost working
days
Child
asthma
attacks
€m health cost high
range*
CO2 emissions,
tonnes (2015)
# out of
243
SO2
# out of
237
NOx
# out of
252
PM10
# out of
116
Mercury
# out of
152
Pocerady 160 40 80 150 48 700 3 270 430 5 135 531 38 5 970 52 10 300 22 321 36 0,21 16
Prunerov 150 45 80 130 48 780 3 120 390 2 634 945 75 7 180 38 6 350 41 370 31 0,25 12
Ledvice 110 59 60 90 40 540 2 440 300 708 564 164 6 810 44 2 500 90 116 75 0,10 37
Opatovice 100 63 50 80 37 260 2 260 280 1 467 416 121 6 220 51 2 430 93 157 61 0,01 134
Melnik II / III 100 63 50 80 34 420 2 140 260 1 807 893 103 5 480 59 3 120 72 258 44 0,07 52
Trebovice 80 79 40 80 21 490 1 720 210 1 153 778 131 3 270 82 3 030 74 100 86 0,00
Chvaletice 60 96 30 60 18 020 1 230 160 3 413 197 62 2 260 101 3 640 62 299 39 0,09 40
Tisova 60 96 30 50 23 160 1 400 170 1 562 430 118 3 900 74 1 400 137 98 87 0,06 57
Detmarovice 50 108 30 60 13 730 1 180 140 2 351 694 84 1 460 134 2 960 76 88 89 0,02 124
Tusimice 50 108 20 50 14 570 1 000 130 4 658 430 45 1 770 121 3 130 71 234 46 0,12 26
Plzen 50 108 30 40 19 690 1 170 140 699 517 165 3 360 80 1 040 157 0 0,04 72
Kladno 50 108 30 40 17 590 1 090 140 1 912 128 100 2 750 90 1 760 120 56 110 0,02 114
Melnik I 40 123 20 40 14 640 950 120 1 568 591 116 2 070 107 2 190 101 138 68 0,06 55
Otrokovice 40 123 20 40 10 670 780 100 358 228 192 2 170 105 612 183 0 0,01 150
Trmice 30 140 20 20 10 750 650 80 531 579 176 1 740 123 880 163 0 0,08 43
Budejovice 30 140 10 20 10 280 610 80 299 890 200 1 740 123 589 187 0 0,02 117
Prerov 30 140 10 30 7 590 580 70 406 498 189 1 300 143 835 170 0 0,00
Plana 20 161 10 20 8 100 480 60 115 310 220 1 390 138 407 209 0 0,00
Plzenska 20 161 10 20 7 600 450 60 318 285 198 1 280 145 454 204 0 0,06 53
Karvina 20 161 10 20 5 190 400 50 314 451 199 919 173 522 200 0 0,00
Kolin 20 161 10 10 6 540 390 50 174 560 212 1 120 159 330 217 0 0,02 125
Vitkovice 20 161 10 20 4 810 370 50 148 122 215 796 183 572 190 0 0,00
Porici II 20 161 10 10 6 190 380 50 479 000 179 995 168 532 199 0 0,01 139
Pribram 10 189 10 10 5 450 330 40 0 243 902 175 384 212 0 0,00
Hodonin 10 189 10 10 4 200 300 40 183 320 211 873 177 211 235 0 0,00
Ceskoslovenske Armady (CSA) 10 189 10 10 3 890 290 40 136 391 218 717 188 344 215 0 0,00
Olomouc 10 189 10 10 3 760 290 40 327 122 195 655 190 396 210 0 0,00
Chomutov 10 189 10 10 4 870 290 40 142 923 216 826 181 275 226 0 0,01 142
Zlin 10 189 0 10 2 510 190 20 204 599 209 440 208 257 231 0 0,03 95
Usti nad Labem 10 189 0 10 2 980 180 20 104 597 223 479 201 258 230 0 0,00
Privoz 10 189 0 10 2 160 170 20 0 320 221 320 220 0 0,00
Krnov 10 189 0 10 1 460 110 10 0 286 225 100 252 0 0,00
Ostrov 10> 232 0 0 1 970 110 10 0 368 214 0 0 0,00
Dvur Kralove 10> 232 0 0 1 950 110 10 30 769 235 364 215 0 0 0,00
Frydek-Mistek 10> 232 0 0 1 150 90 10 0 188 233 142 242 0 0,00
Malesice 10> 232 0 0 1 300 80 10 2 803 239 204 231 128 248 0 0,00
Koprivnice 10> 232 0 0 850 60 10 0 204 231 0 0 0,00
Brno Spitalka 10> 232 0 0 300 30 0 96 886 224 0 118 250 0 0,00
Denmark Pollution Emitted (tonnes)
Power station name
Premature
deaths
# out of
257
Chronic
bronchitis
Hospital
admissions
Lost working
days
Child
asthma
attacks
€m health cost high
range*
CO2 emissions,
tonnes (2015)
# out of
243
SO2
# out of
237
NOx
# out of
252
PM10
# out of
116
Mercury
# out of
152
Avedore 10 189 10 10 3 840 250 30 721 170 162 440 208 706 178 65 101 0,00
Asnaes 10 189 10 10 2 600 220 30 695 549 166 0 1 610 126 0 0,01 140
Studstrup 10 189 0 10 2 660 170 20 1 477 579 120 310 222 471 203 69 99 0,02 121
Fyns 10 189 0 10 2 340 150 20 901 683 144 273 226 411 208 0 0,01 130
Amager 10 189 0 0 1 920 120 10 862 186 149 229 229 317 221 0 0,01 148
Esbjerg 10> 232 0 0 1 110 90 10 875 783 145 0 691 179 0 0,01 138
Nordjylland 10> 232 0 0 210 20 0 1 269 764 127 0 132 247 0 0,02 116
Finland Pollution Emitted (tonnes)
Power station name
Premature
deaths
# out of
257
Chronic
bronchitis
Hospital
admissions
Lost working
days
Child
asthma
attacks
€m health cost high
range*
CO2 emissions,
tonnes (2015)
# out of
243
SO2
# out of
237
NOx
# out of
252
PM10
# out of
116
Mercury
# out of
152
Suomenoja 20 161 10 10 4 000 270 40 744 633 159 1 790 120 1 590 128 55 112 0,00
Naantali-1 20 161 10 20 3 480 250 40 1 106 338 134 1 070 162 2 830 82 54 113 0,00
Kymijarvi 10 189 10 10 3 080 210 30 387 785 191 1 310 142 1 440 134 0 0,00
Hanasaari B 10 189 10 10 2 790 200 30 715 833 163 1 060 163 1 670 124 107 79 0,00
Salmissari 10 189 0 10 2 410 160 20 635 540 170 1 110 161 862 167 0 0,00
Martinlaakso 10 189 0 10 2 280 150 20 425 895 187 930 172 1 170 152 0 0,00
Vaskiluoto 10 189 0 10 1 890 140 20 724 592 161 488 200 1 810 117 0 0,00
Meri-Pori 10 189 0 10 2 010 130 20 356 485 193 888 176 835 170 0 0,00
Kristiina 10 189 0 10 1 230 80 10 115 503 219 451 205 786 175 0 0,00
Tahkoluoto (Pori) 10> 232 0 0 630 50 10 115 090 221 172 236 569 192 0 0,00
France Pollution Emitted (tonnes)
Power station name
Premature
deaths
# out of
257
Chronic
bronchitis
Hospital
admissions
Lost working
days
Child
asthma
attacks
€m health cost high
range*
CO2 emissions,
tonnes (2015)
# out of
243
SO2
# out of
237
NOx
# out of
252
PM10
# out of
116
Mercury
# out of
152
Emile-Houchet 160 40 70 120 49 890 3 230 420 2 818 871 71 4 660 68 5 030 49 155 62 0,03 92
Provence 90 69 60 80 28 900 2 400 250 1 524 609 119 2 170 105 2 830 82 71 97 0,02 119
Le Havre II 80 79 40 60 21 660 2 120 220 832 291 153 5 370 61 3 340 66 263 43 0,02 109
Cordemais 60 96 30 50 15 200 1 550 170 2 135 950 94 3 430 79 4 270 54 0 0,02 111
Bois-Rouge 10> 232 0 0 0 0 0 0 2 580 94 1 560 129 0 0,00 152
Germany Pollution Emitted (tonnes)
Power station name
Premature
deaths
# out of
257
Chronic
bronchitis
Hospital
admissions
Lost working
days
Child
asthma
attacks
€m health cost high
range*
CO2 emissions,
tonnes (2015)
# out of
243
SO2
# out of
237
NOx
# out of
252
PM10
# out of
116
Mercury
# out of
152
Jaenschwalde 470 6 240 420 157 000 10 080 1 270 23 325 104 4 23 100 12 20 500 5 675 15 0,33 9
Niederaussem 450 9 190 340 125 320 8 500 1 210 27 330 240 3 10 200 28 19 300 7 409 25 0,53 2
Grevenbroich-Neurath 410 11 160 320 98 180 7 110 1 100 32 069 617 2 6 260 49 22 800 4 401 27 0,67 1
Boxberg 300 17 150 270 97 720 6 340 800 8 615 210 16 14 000 20 14 000 16 460 21 0,37 8
Eschweiler-Weisweiler 270 18 110 200 71 070 4 930 710 18 139 249 5 5 390 60 12 700 18 277 41 0,23 13
Lippendorf 220 27 120 190 77 680 4 860 600 10 285 560 13 12 100 24 7 910 33 229 47 0,41 5
Schwarze Pumpe 160 40 90 140 56 900 3 520 430 12 244 201 8 9 000 31 5 350 47 101 83 0,19 17
Scholven/Buer 150 45 70 110 43 900 2 960 410 4 720 436 42 3 720 77 6 110 43 203 53 0,16 22
Schkopau 130 52 70 110 47 560 2 900 360 5 351 933 37 7 760 36 3 670 59 69 98 0,43 4
Voerde West 100 63 50 80 31 050 2 040 280 1 623 293 113 2 710 91 3 970 56 53 114 0,09 41
Bergkamen 90 69 40 70 30 780 1 950 250 2 744 777 73 2 990 84 2 590 86 52 116 0,03 90
Mehrum 90 69 40 70 30 860 1 930 240 2 540 432 79 3 010 83 2 540 88 0 0,06 58
Mannheim 90 69 40 60 23 800 1 640 230 7 316 094 22 1 940 115 3 650 60 142 66 0,15 23
Petershagen Heyden 80 79 40 60 25 130 1 630 220 2 757 365 72 2 240 104 3 010 75 0 0,05 60
Karlsruhe 70 90 30 50 23 940 1 510 190 3 874 679 55 2 300 100 2 130 102 0 0,03 83
Heilbronn 70 90 30 60 22 200 1 450 200 3 178 511 64 1 910 116 2 960 76 0 0,07 46
Wilhelmshaven 70 90 30 50 21 770 1 400 190 2 931 068 67 1 990 114 2 390 95 0 0,00
Grevenbroich-Frimmersdorf 60 96 20 50 15 820 1 110 160 4 752 557 40 1 210 150 2 780 84 89 88 0,07 49
Voerde 60 96 30 40 19 580 1 240 160 4 430 371 49 1 850 119 1 880 114 0 0,03 84
Herne 60 96 30 40 18 670 1 190 160 2 654 608 74 1 730 126 1 940 110 0 0,04 70
Duisburg-Walsum 60 96 30 50 20 150 1 280 170 4 307 843 50 1 890 117 1 990 108 0 0,08 42
Bexbach 60 96 20 40 17 180 1 110 150 2 174 385 92 1 530 132 2 060 105 0 0,07 45
Quierschied-Weiher 50 108 20 30 14 930 950 120 1 678 806 110 1 400 137 1 480 133 0 0,00
Voelklingen-Fenne 50 108 20 30 15 240 960 120 929 698 142 1 470 133 1 330 142 0 0,03 89
Altbach/Deizisau 50 108 20 30 14 210 920 120 1 661 245 111 1 280 145 1 640 125 0 0,04 78
Marl 40 123 20 30 12 800 850 120 428 444 185 1 060 163 1 890 112 0 0,04 74
Ensdorf 40 123 20 30 14 700 930 120 1 186 435 129 1 410 135 1 320 143 0 0,00
Werdohl-Elverlingsen 40 123 20 30 13 750 880 120 600 596 173 1 250 148 1 540 130 0 0,03 93
Luenen 40 123 20 30 12 560 800 110 1 657 015 112 1 170 153 1 280 147 0 0,02 122
Helmstedt Buschhaus 40 123 20 30 13 690 850 100 2 278 643 89 1 380 139 930 161 0 0,03 96
Ibbenbueren 40 123 20 30 10 560 730 110 3 334 278 63 762 185 2 060 105 0 0,01 135
Hannover 30 140 20 30 11 550 720 90 1 726 850 109 1 130 158 934 160 0 0,02 118
Grosskrotzenburg Staudinger 30 140 10 30 8 390 580 90 2 182 690 91 589 194 1 710 123 0 0,03 86
Luenen-Stummhafen 30 140 10 20 9 100 580 70 2 078 468 96 848 178 924 162 0 0,00
Bremen-Hafen 30 140 10 20 8 870 580 80 0 786 184 1 080 155 0 0,05 66
Hamm Westfalen 30 140 10 20 8 000 530 70 421 504 188 672 189 1 140 153 0 0,00
Berlin-Reuter West 30 140 10 30 7 920 550 70 2 976 143 66 803 182 2 230 100 0 0,03 85
Huerth Goldenberg 30 140 10 20 8 230 530 70 1 164 166 130 762 185 856 168 0 0,04 69
Zolling-Leininger 20 161 10 20 7 840 510 70 1 740 813 108 998 167 1 540 130 0 0,01 145
Chemnitz North II 20 161 10 20 6 890 450 60 942 323 141 1 030 165 844 169 57 109 0,05 62
Bremen-Farge 20 161 10 10 6 690 420 50 1 463 745 122 655 190 536 197 0 0,11 29
Rostock 20 161 10 20 5 810 410 50 2 339 152 86 450 206 1 890 112 0 0,02 111
Frankfurt/Main West 20 161 10 10 5 280 350 50 845 066 150 439 210 773 176 0 0,03 100
Kiel East 20 161 10 10 5 510 360 40 1 438 502 124 561 195 1 280 147 0 0,03 105
Munich North 20 161 10 20 4 190 320 50 682 242 215 230 1 870 115 0 0,04 73
Walheim 20 161 10 10 4 970 320 40 57 780 232 453 204 553 193 0 0,00
Dessau 10 189 10 10 5 060 300 40 155 595 214 837 180 355 214 0 0,00
Bremen-Hastedt 10 189 10 10 4 190 280 40 779 277 155 358 217 572 190 0 0,01 135
Duisburg-Hochfeld II 10 189 0 10 3 110 200 30 515 122 178 288 224 321 219 0 0,02 108
Hamburg-Tiefstack 10 189 0 10 2 920 180 20 1 295 279 125 341 220 512 202 0 0,03 103
Schweinfurt 10 189 0 10 2 660 170 20 84 293 226 249 228 266 228 0 0,00
Flensburg 10 189 0 10 2 630 160 20 668 226 167 345 219 317 221 0 0,00
Wuppertal-Elberfeld 10 189 0 0 1 940 120 20 446 963 182 177 235 215 234 0 0,00
Waehlitz 10 189 0 0 2 160 130 20 319 041 197 363 216 134 246 0 0,00
Berlin-Moabit 10 189 0 0 1 900 120 10 292 414 201 307 223 155 241 0 0,02 120
Ulm Magirusstrasse 10> 232 0 0 560 50 10 78 274 227 0 291 223 0 0,00
Stuttgart-Muenster 10> 232 0 0 520 40 10 225 969 205 0 267 227 0 0,00
Berlin-Reuter 10> 232 0 0 580 50 10 471 540 180 0 358 213 0 0,00
Pforzheim 10> 232 0 0 300 30 10 112 501 222 0 156 240 0 0,00
Kassel 10> 232 0 0 270 20 0 33 854 234 0 137 245 0 0,00
Offenbach 10> 232 0 0 240 20 0 236 129 204 0 121 249 0 0,01 140
Erlangen 10> 232 0 0 290 20 0 161 663 213 0 179 237 0 0,00
Frankfurt/Oder 10> 232 0 0 230 20 0 0 0 140 244 0 0,00
Greece Pollution Emitted (tonnes)
Power station name
Premature
deaths
# out of
257
Chronic
bronchitis
Hospital
admissions
Lost working
days
Child
asthma
attacks
€m health cost high
range*
CO2 emissions,
tonnes (2015)
# out of
243
SO2
# out of
237
NOx
# out of
252
PM10
# out of
116
Mercury
# out of
152
Agios Dimitrios 270 18 160 280 84 390 9 500 750 10 558 256 12 28 200 8 14 700 13 365 32 0,41 6
Kardia 90 69 60 110 16 080 3 210 260 8 870 729 14 3 790 76 9 920 23 4 470 2 0,09 39
Amintaio 80 79 50 80 24 580 2 620 220 3 743 116 59 8 560 32 2 720 85 304 37 0,18 18
Ptolemaida 80 79 50 70 15 020 2 240 210 2 541 516 78 5 200 64 1 810 117 4 500 1 0,07 50
Megalopoli B 20 161 10 20 4 260 610 40 2 205 148 90 1 170 153 1 870 115 87 90 0,14 24
Megalopoli A 10 189 10 10 2 840 370 30 2 422 022 82 842 179 963 158 0 0,08 44
Melitis (Florina) 10 189 0 10 1 850 270 20 1 605 506 114 494 199 877 164 0 0,03 104
Hungary Pollution Emitted (tonnes)
Power station name
Premature
deaths
# out of
257
Chronic
bronchitis
Hospital
admissions
Lost working
days
Child
asthma
attacks
€m health cost high
range*
CO2 emissions,
tonnes (2015)
# out of
243
SO2
# out of
237
NOx
# out of
252
PM10
# out of
116
Mercury
# out of
152
Matra 160 40 80 170 45 230 3 660 440 6 363 197 27 6 280 48 7 360 38 0 0,00
Oroszlany 30 140 10 30 8 150 660 80 427 101 186 1 160 155 1 280 147 0 0,00
Bakony 10 189 0 10 2 690 210 30 72 258 228 435 211 336 216 0 0,00
Ireland Pollution Emitted (tonnes)
Power station name
Premature
deaths
# out of
257
Chronic
bronchitis
Hospital
admissions
Lost working
days
Child
asthma
attacks
€m health cost high
range*
CO2 emissions,
tonnes (2015)
# out of
243
SO2
# out of
237
NOx
# out of
252
PM10
# out of
116
Mercury
# out of
152
Moneypoint 110 59 60 80 29 150 2 790 290 4 528 857 46 7 160 39 4 890 50 213 51 0,01 143
Italy Pollution Emitted (tonnes)
Power station name
Premature
deaths
# out of
257
Chronic
bronchitis
Hospital
admissions
Lost working
days
Child
asthma
attacks
€m health cost high
range*
CO2 emissions,
tonnes (2015)
# out of
243
SO2
# out of
237
NOx
# out of
252
PM10
# out of
116
Mercury
# out of
152
Fiume Santo 120 58 70 100 37 750 2 980 320 2 404 218 83 3 300 81 2 520 89 0 0,02 122
La Spezia 100 63 60 90 33 550 2 680 280 2 532 872 80 2 920 87 2 270 99 100 85 0,03 101
Fusina 90 69 50 80 26 610 2 190 230 5 779 411 31 2 020 111 2 550 87 0 0,03 91
Torrevaldaliga Nord 80 79 50 80 23 980 2 050 220 10 736 213 11 1 590 130 2 880 79 61 103 0,02 110
Sulcis 70 90 40 60 22 500 1 750 190 1 294 280 126 2 070 107 1 240 150 0 0,00
Brindisi Sud 70 90 40 80 18 650 2 450 180 13 112 244 7 5 560 58 6 280 42 105 80 0,02 107
Monfalcone 60 96 40 60 15 420 1 480 160 2 037 302 98 466 203 3 260 68 72 96 0,00
Genova 20 161 10 20 7 010 570 60 807 445 154 557 196 608 184 0 0,00
Bastardo 10 189 10 10 4 610 380 40 37 150 233 354 218 431 205 0 0,00
Brescia 10> 232 0 0 580 60 10 219 311 208 0 167 239 0 0,00
Netherlands Pollution Emitted (tonnes)
Power station name
Premature
deaths
# out of
257
Chronic
bronchitis
Hospital
admissions
Lost working
days
Child
asthma
attacks
€m health cost high
range*
CO2 emissions,
tonnes (2015)
# out of
243
SO2
# out of
237
NOx
# out of
252
PM10
# out of
116
Mercury
# out of
152
Amer 100 63 50 80 31 280 2 050 270 5 669 492 33 2 760 89 3 870 57 56 111 0,03 93
Maasvlakte 80 79 40 60 26 130 1 670 220 5 895 070 29 2 500 97 2 370 97 58 108 0,03 82
Gelderland 13 40 123 20 30 14 190 900 120 2 885 312 70 1 330 141 1 410 135 0 0,01 146
Hemweg 30 140 20 30 11 580 740 90 4 195 699 52 1 150 156 865 166 62 102 0,02 127
Borssele 12 30 140 10 20 9 270 580 70 2 054 544 97 904 174 763 177 0 0,00
Poland Pollution Emitted (tonnes)
Power station name
Premature
deaths
# out of
257
Chronic
bronchitis
Hospital
admissions
Lost working
days
Child
asthma
attacks
€m health cost high
range*
CO2 emissions,
tonnes (2015)
# out of
243
SO2
# out of
237
NOx
# out of
252
PM10
# out of
116
Mercury
# out of
152
Belchatow 1 270 1 630 1 310 359 200 27 830 3 450 37 051 920 1 61 000 1 40 300 1 1 010 7 0,16 20
Kozienice 650 3 320 660 186 500 14 140 1 770 11 393 513 9 33 400 5 18 100 9 0 0,22 14
Rybnik 480 5 240 490 134 660 10 380 1 290 6 548 392 25 23 300 11 14 400 15 381 29 0,18 19
Turow 360 14 190 300 129 510 7 940 970 7 595 544 18 21 400 13 9 180 25 911 9 0,05 64
Adamow 270 18 140 280 76 740 5 960 740 3 908 045 54 13 500 22 7 830 34 679 14 0,44 3
Ostroleka 190 31 100 200 54 290 4 210 520 1 403 241 9 440 30 5 730 45 342 34 0,03 87
Polaniec 180 32 90 200 47 220 4 120 490 6 299 450 28 4 890 66 10 400 21 515 18 0,07 47
Patnow II 170 36 80 180 46 910 3 800 470 5 371 308 36 6 630 46 7 430 37 104 81 0,38 7
Jaworzno 3 170 36 90 190 47 740 3 900 470 4 519 062 47 6 410 47 8 120 31 66 100 0,10 36
Opole 160 40 80 180 43 590 3 750 440 5 821 226 30 4 530 71 9 570 24 198 54 0,21 15
Zeran 150 45 70 150 41 610 3 150 400 2 324 804 88 7 990 34 3 160 70 385 28 0,03 97
Dolna Odra 140 48 70 130 45 240 2 960 390 4 691 837 43 5 920 53 8 340 30 136 70 0,09 38
Laziska 140 48 70 150 38 300 3 100 380 3 784 947 58 5 580 56 5 800 44 189 55 0,10 32
Skawina 130 52 70 130 37 040 2 830 370 1 564 082 117 6 840 41 3 260 68 267 42 0,03 81
Lagisza 130 52 70 140 36 910 2 970 360 2 912 395 69 5 570 57 5 280 48 248 45 0,00
Krakow 130 52 60 130 34 930 2 810 360 1 782 340 105 5 760 55 4 200 55 637 16 0,01 143
Siersza 100 63 50 100 27 740 2 080 260 1 816 763 102 5 330 62 2 100 103 138 68 0,04 77
Wroclaw 90 69 40 90 25 390 1 930 240 1 081 987 137 4 600 70 2 380 96 81 93 0,00
Stalowa Wola 90 69 50 90 25 700 1 960 250 832 521 151 4 660 68 2 400 94 139 67 0,05 63
Gdansk 2 80 79 40 80 22 140 1 720 210 1 088 560 135 3 830 75 2 370 97 145 64 0,05 67
Bydgoszcz II 80 79 40 80 21 400 1 630 200 754 880 158 3 910 73 1 950 109 134 71 0,03 98
Lodz 3 60 96 30 60 16 740 1 280 160 656 150 169 2 940 85 1 720 122 0 0,01 128
Poznan-Karolin 60 96 30 60 16 110 1 280 160 1 144 354 132 2 660 92 1 930 111 184 56 0,03 99
Bedzin 50 108 20 50 13 750 1 050 130 520 833 177 2 600 93 1 110 154 178 58 0,00
Patnow II 50 108 20 50 12 530 1 020 120 2 350 415 85 1 700 127 2 100 103 0 0,12 27
Pomorzany 40 123 20 40 15 340 960 120 763 880 157 2 440 98 1 400 137 122 73 0,01 137
Gdynia 40 123 20 40 12 080 950 120 660 491 168 2 060 109 1 340 141 112 77 0,03 102
Lodz 4 40 123 20 40 12 010 930 110 769 004 156 2 020 111 1 380 139 0 0,01 133
Zabrze 40 123 20 30 9 830 750 100 223 731 207 1 860 118 794 174 114 76 0,00
Katowice 40 123 20 30 10 000 740 100 867 301 148 2 030 110 582 189 84 92 0,02 115
Jaworzno 2 40 123 20 40 10 070 770 100 870 727 146 1 740 123 1 080 155 0 0,01 147
Chorzow 2 30 140 20 30 9 150 700 90 1 082 121 136 1 650 128 868 165 60 104 0,02 111
Konin 30 140 20 30 8 790 700 90 628 153 171 1 300 143 1 300 145 0 0,04 76
Czechnica 30 140 10 30 7 750 590 70 280 217 203 1 360 140 798 173 0 0,00
Zofiowka 20 161 10 20 6 930 530 70 21 409 236 1 280 145 608 184 60 105 0,00
Miechowice 20 161 10 20 6 110 460 60 201 533 210 1 200 151 422 206 77 94 0,00
Bialystok 20 161 10 20 5 050 420 50 326 380 196 629 193 936 159 0 0,04 71
Mielec 10 189 10 10 3 790 280 40 138 643 217 745 187 261 229 0 0,00
Bielsko-Biala 10 189 10 10 3 240 250 30 0 243 649 192 204 236 52 115 0,00
Tychy 10 189 10 10 3 170 250 30 64 889 230 519 198 388 211 0 0,00
Zofiowka Moszczenica 10 189 0 10 2 370 180 20 0 427 212 227 233 0 0,00
Blachownia 10 189 0 10 1 580 160 20 284 908 202 0 615 182 0 0,00
Szczecin 10> 232 0 0 880 70 10 1 470 240 0 544 196 0 0,00
Zgierz 10> 232 0 0 780 50 10 0 243 185 234 0 0 0,00
Czestochowa 10> 232 0 0 710 50 10 341 676 194 170 237 0 0 0,00
Portugal Pollution Emitted (tonnes)
Power station name
Premature
deaths
# out of
257
Chronic
bronchitis
Hospital
admissions
Lost working
days
Child
asthma
attacks
€m health cost high
range*
CO2 emissions,
tonnes (2015)
# out of
243
SO2
# out of
237
NOx
# out of
252
PM10
# out of
116
Mercury
# out of
152
Sines 80 79 50 90 26 980 2 540 220 8 683 899 15 4 180 72 4 660 52 0 0,10 33
Pego 30 140 20 40 10 560 1 020 90 3 615 854 60 1 610 129 2 040 107 0 0,03 80
Romania Pollution Emitted (tonnes)
Power station name
Premature
deaths
# out of
257
Chronic
bronchitis
Hospital
admissions
Lost working
days
Child
asthma
attacks
€m health cost high
range*
CO2 emissions,
tonnes (2015)
# out of
243
SO2
# out of
237
NOx
# out of
252
PM10
# out of
116
Mercury
# out of
152
Drobeta 430 10 220 350 118 170 10 840 1 180 978 674 139 35 900 4 1 750 121 445 22 0,03 88
Mintia 340 15 170 310 80 970 8 260 910 918 725 143 21 100 14 7 950 32 2 590 3 0,00
Rovinari 250 23 120 240 58 510 6 000 680 5 412 542 35 13 600 21 8 920 27 744 12 0,06 56
Oradea II 240 24 120 200 61 250 5 990 660 987 568 138 18 400 16 1 310 144 2 330 4 0,00
Govora 230 25 120 200 59 980 5 820 630 1 126 695 133 17 200 17 2 860 80 1 360 6 0,00
Turceni 180 32 90 190 40 450 4 310 490 4 454 326 48 7 870 35 9 120 26 303 38 0,05 68
Paroseni 170 36 90 140 46 500 4 240 460 832 470 152 14 200 19 550 194 103 82 0,00
Craiova II 170 36 90 140 46 020 4 300 470 1 241 520 128 13 500 22 1 610 126 284 40 0,00
Isalnita 90 69 40 70 22 920 2 140 230 2 608 863 76 6 830 42 595 186 227 48 0,00
Iasi II 50 108 20 40 11 590 1 140 130 17 271 238 2 940 85 1 290 146 59 107 0,00
Bacau 30 140 10 20 7 150 690 70 70 567 229 2 010 113 419 207 86 91 0,00
Slovakia Pollution Emitted (tonnes)
Power station name
Premature
deaths
# out of
257
Chronic
bronchitis
Hospital
admissions
Lost working
days
Child
asthma
attacks
€m health cost high
range*
CO2 emissions,
tonnes (2015)
# out of
243
SO2
# out of
237
NOx
# out of
252
PM10
# out of
116
Mercury
# out of
152
Novaky 470 6 230 450 138 320 9 700 1 240 2 143 125 93 31 000 7 3 270 67 0 0,00
Teko 30 140 20 30 8 440 690 80 429 166 184 1 150 156 1 410 135 0 0,00
Zvolenska 20 161 10 20 6 060 460 60 96 610 225 1 120 159 533 198 0 0,00
Martinska 10 189 0 10 2 610 200 20 0 475 202 240 232 0 0,02 126
Vojany I 10 189 0 10 2 020 150 20 390 409 190 378 213 171 238 0 0,00
Slovenia Pollution Emitted (tonnes)
Power station name
Premature
deaths
# out of
257
Chronic
bronchitis
Hospital
admissions
Lost working
days
Child
asthma
attacks
€m health cost high
range*
CO2 emissions,
tonnes (2015)
# out of
243
SO2
# out of
237
NOx
# out of
252
PM10
# out of
116
Mercury
# out of
152
Sostanj 180 32 110 170 53 430 4 550 500 3 791 039 57 3 550 78 6 400 40 147 63 0,01 149
Te-Tol 20 161 10 20 6 800 580 60 565 901 174 446 207 828 172 0 0,00
Spain Pollution Emitted (tonnes)
Power station name
Premature
deaths
# out of
257
Chronic
bronchitis
Hospital
admissions
Lost working
days
Child
asthma
attacks
€m health cost high
range*
CO2 emissions,
tonnes (2015)
# out of
243
SO2
# out of
237
NOx
# out of
252
PM10
# out of
116
Mercury
# out of
152
Andorra 400 12 260 360 150 370 11 970 1 100 4 663 461 44 25 500 10 7 520 36 371 30 0,07 51
Litoral 180 32 120 190 63 080 5 550 480 6 440 967 26 10 200 28 7 330 39 329 35 0,06 54
Abono 140 48 100 160 46 740 4 540 380 7 545 959 19 7 150 40 8 850 28 350 33 0,05 59
As Pontes 130 52 90 160 44 660 4 350 360 7 542 286 20 6 830 42 8 480 29 435 23 0,05 61
Compostilla II 130 52 90 150 43 780 4 190 350 4 233 843 51 6 780 45 7 580 35 561 17 0,14 25
Anllares 110 59 70 120 38 730 3 440 300 729 054 160 6 230 50 4 770 51 221 49 0,01 131
Meirama 90 69 60 90 32 430 2 810 250 3 016 683 65 5 280 63 3 470 63 108 78 0,04 78
Alcudia II 80 79 60 80 29 850 2 580 230 1 987 163 99 4 870 67 3 100 73 166 59 0,01 131
La Robla 60 96 40 80 16 550 1 940 160 2 587 314 77 2 250 103 5 500 46 506 19 0,01 129
Los Barrios 50 108 40 70 15 820 1 710 140 3 499 191 61 2 260 101 4 350 53 183 57 0,00
Soto de Ribera 50 108 30 50 15 530 1 460 120 2 925 818 68 2 430 99 2 490 91 143 65 0,00
Velilla 40 123 30 50 11 290 1 290 100 1 781 042 106 1 540 131 3 720 58 123 72 0,00
Lada 30 140 20 40 10 020 1 100 90 1 761 226 107 1 410 135 2 930 78 101 83 0,00
Narcea 30 140 20 40 7 860 990 80 1 786 748 104 973 169 3 410 65 0 0,02 106
Puente Nuevo 20 161 10 20 5 860 510 40 1 593 746 115 948 171 683 180 0 0,00
Sweden Pollution Emitted (tonnes)
Power station name
Premature
deaths
# out of
257
Chronic
bronchitis
Hospital
admissions
Lost working
days
Child
asthma
attacks
€m health cost high
range*
CO2 emissions,
tonnes (2015)
# out of
243
SO2
# out of
237
NOx
# out of
252
PM10
# out of
116
Mercury
# out of
152
Vaerta 10> 232 0 0 190 20 0 608 308 172 0 330 217 0 0,00
Vaesteras 10> 232 0 0 170 10 0 225 314 206 0 290 224 0 0,00
Linkoeping 10> 232 0 0 80 10 0 61 239 231 0 141 243 0 0,00
United Kingdom Pollution Emitted (tonnes)
Power station name
Premature
deaths
# out of
257
Chronic
bronchitis
Hospital
admissions
Lost working
days
Child
asthma
attacks
€m health cost high
range*
CO2 emissions,
tonnes (2015)
# out of
243
SO2
# out of
237
NOx
# out of
252
PM10
# out of
116
Mercury
# out of
152
Drax 590 4 300 480 142 590 14 630 1 590 13 192 780 6 32 300 6 39 300 2 752 11 0,31 10
Longannet 380 13 210 290 105 240 10 100 1 040 7 457 176 21 25 800 9 17 900 11 489 20 0,11 30
Eggborough 340 15 180 260 87 080 8 620 920 4 748 504 41 20 800 15 17 900 11 820 10 0,26 11
Aberthaw 270 18 120 240 41 490 5 540 710 6 703 696 24 5 860 54 31 500 3 432 24 0,10 35
Ferrybridge 260 22 130 200 64 600 6 490 690 2 328 454 87 15 200 18 14 600 14 680 13 0,10 34
Ratcliffe 230 25 110 190 51 580 5 510 640 4 774 148 39 11 000 26 18 100 9 119 74 0,11 31
Cottam 220 27 100 190 40 580 4 850 580 6 756 444 23 7 620 37 20 100 6 928 8 0,12 28
Fiddler’s Ferry 210 29 110 170 52 440 5 330 570 5 556 750 34 12 100 24 13 200 17 405 26 0,07 48
West Burton 210 29 100 180 42 380 4 760 550 7 724 207 17 8 430 33 18 300 8 217 50 0,16 21
Rugeley 110 59 50 100 17 290 2 270 300 3 854 947 56 2 570 96 12 400 19 206 52 0,04 75
Kilroot 50 108 30 40 12 510 1 280 140 2 079 830 95 2 800 88 3 650 60 0 0,00 151
* Depending on the monetary valuation applied for mortality, the cost attributed to one premature death is either the median value of 1.26 million Euros or the high value of 2.56 million Euros (2013 prices). See Holland (2014), Cost-benefit Analysis of Final Policy
Scenarios for the EU Clean Air Package. http://ec.europa.eu/environment/air/pdf/TSAP%20CBA.pdf
1. A few coal stations from this list have closed in the meantime: Genk-Langerlo in Belgium, Varna in Bulgaria, Huerth Goldenberg in Germany, Oroszlany in Hungary, Borssele 12 in Netherlands, Gelderland 13 in Netherlands, Zgierz in Poland, Ferrybridge in UK,
Rugeley in UK, Longannet in UK.
2. All health impacts numbers were rounded to closest 10

More Related Content

More from FunkeBerlin

Meuthens Unterschrift unter Freistellungserklärung für Anzeige
Meuthens Unterschrift unter Freistellungserklärung für AnzeigeMeuthens Unterschrift unter Freistellungserklärung für Anzeige
Meuthens Unterschrift unter Freistellungserklärung für AnzeigeFunkeBerlin
 
Fake-Anweisung für die NRW-Polizei
Fake-Anweisung für die NRW-PolizeiFake-Anweisung für die NRW-Polizei
Fake-Anweisung für die NRW-PolizeiFunkeBerlin
 
Post warnt umziehen.de-Kunden
Post warnt umziehen.de-KundenPost warnt umziehen.de-Kunden
Post warnt umziehen.de-KundenFunkeBerlin
 
Diese Männer sucht die Polizei
Diese Männer sucht die PolizeiDiese Männer sucht die Polizei
Diese Männer sucht die PolizeiFunkeBerlin
 
Die gefälschten Schreiben der Wahlleiterin
Die gefälschten Schreiben der WahlleiterinDie gefälschten Schreiben der Wahlleiterin
Die gefälschten Schreiben der WahlleiterinFunkeBerlin
 
Der Fragebogen für die USA-Reise
Der Fragebogen für die USA-ReiseDer Fragebogen für die USA-Reise
Der Fragebogen für die USA-ReiseFunkeBerlin
 
Antwort Anfrage Eisplatten auf Lkw
Antwort Anfrage Eisplatten auf LkwAntwort Anfrage Eisplatten auf Lkw
Antwort Anfrage Eisplatten auf LkwFunkeBerlin
 
Antwort Anfrage Eisplatten von Lkw
Antwort Anfrage Eisplatten von LkwAntwort Anfrage Eisplatten von Lkw
Antwort Anfrage Eisplatten von LkwFunkeBerlin
 
So sehen Guido Maria Kretschmers Entwürfe für die Deutsche Bahn aus
So sehen Guido Maria Kretschmers Entwürfe für die Deutsche Bahn ausSo sehen Guido Maria Kretschmers Entwürfe für die Deutsche Bahn aus
So sehen Guido Maria Kretschmers Entwürfe für die Deutsche Bahn ausFunkeBerlin
 
Festmahl zur Trump-Amtseinführung: Die Rezepte
Festmahl zur Trump-Amtseinführung: Die RezepteFestmahl zur Trump-Amtseinführung: Die Rezepte
Festmahl zur Trump-Amtseinführung: Die RezepteFunkeBerlin
 
Geheimakte Amri: Die vertrauliche Chronologie
Geheimakte Amri: Die vertrauliche ChronologieGeheimakte Amri: Die vertrauliche Chronologie
Geheimakte Amri: Die vertrauliche ChronologieFunkeBerlin
 
Der Reid-Brief an den FBI-Chef
Der Reid-Brief an den FBI-ChefDer Reid-Brief an den FBI-Chef
Der Reid-Brief an den FBI-ChefFunkeBerlin
 
Der Papierkörbin-Antrag
Der Papierkörbin-AntragDer Papierkörbin-Antrag
Der Papierkörbin-AntragFunkeBerlin
 
WWF-Übersicht: So gehen Firmen mit Palmöl um
WWF-Übersicht: So gehen Firmen mit Palmöl umWWF-Übersicht: So gehen Firmen mit Palmöl um
WWF-Übersicht: So gehen Firmen mit Palmöl umFunkeBerlin
 
Die Zucker-Rangliste
Die Zucker-RanglisteDie Zucker-Rangliste
Die Zucker-RanglisteFunkeBerlin
 
Der Brief ans Patentamt
Der Brief ans PatentamtDer Brief ans Patentamt
Der Brief ans PatentamtFunkeBerlin
 
"Die enthemmte Mitte"
"Die enthemmte Mitte""Die enthemmte Mitte"
"Die enthemmte Mitte"FunkeBerlin
 
Der Osterhasen-Check
Der Osterhasen-CheckDer Osterhasen-Check
Der Osterhasen-CheckFunkeBerlin
 
BKA-Lagebericht: Kriminalität bei Flüchtlingen
BKA-Lagebericht: Kriminalität bei FlüchtlingenBKA-Lagebericht: Kriminalität bei Flüchtlingen
BKA-Lagebericht: Kriminalität bei FlüchtlingenFunkeBerlin
 

More from FunkeBerlin (19)

Meuthens Unterschrift unter Freistellungserklärung für Anzeige
Meuthens Unterschrift unter Freistellungserklärung für AnzeigeMeuthens Unterschrift unter Freistellungserklärung für Anzeige
Meuthens Unterschrift unter Freistellungserklärung für Anzeige
 
Fake-Anweisung für die NRW-Polizei
Fake-Anweisung für die NRW-PolizeiFake-Anweisung für die NRW-Polizei
Fake-Anweisung für die NRW-Polizei
 
Post warnt umziehen.de-Kunden
Post warnt umziehen.de-KundenPost warnt umziehen.de-Kunden
Post warnt umziehen.de-Kunden
 
Diese Männer sucht die Polizei
Diese Männer sucht die PolizeiDiese Männer sucht die Polizei
Diese Männer sucht die Polizei
 
Die gefälschten Schreiben der Wahlleiterin
Die gefälschten Schreiben der WahlleiterinDie gefälschten Schreiben der Wahlleiterin
Die gefälschten Schreiben der Wahlleiterin
 
Der Fragebogen für die USA-Reise
Der Fragebogen für die USA-ReiseDer Fragebogen für die USA-Reise
Der Fragebogen für die USA-Reise
 
Antwort Anfrage Eisplatten auf Lkw
Antwort Anfrage Eisplatten auf LkwAntwort Anfrage Eisplatten auf Lkw
Antwort Anfrage Eisplatten auf Lkw
 
Antwort Anfrage Eisplatten von Lkw
Antwort Anfrage Eisplatten von LkwAntwort Anfrage Eisplatten von Lkw
Antwort Anfrage Eisplatten von Lkw
 
So sehen Guido Maria Kretschmers Entwürfe für die Deutsche Bahn aus
So sehen Guido Maria Kretschmers Entwürfe für die Deutsche Bahn ausSo sehen Guido Maria Kretschmers Entwürfe für die Deutsche Bahn aus
So sehen Guido Maria Kretschmers Entwürfe für die Deutsche Bahn aus
 
Festmahl zur Trump-Amtseinführung: Die Rezepte
Festmahl zur Trump-Amtseinführung: Die RezepteFestmahl zur Trump-Amtseinführung: Die Rezepte
Festmahl zur Trump-Amtseinführung: Die Rezepte
 
Geheimakte Amri: Die vertrauliche Chronologie
Geheimakte Amri: Die vertrauliche ChronologieGeheimakte Amri: Die vertrauliche Chronologie
Geheimakte Amri: Die vertrauliche Chronologie
 
Der Reid-Brief an den FBI-Chef
Der Reid-Brief an den FBI-ChefDer Reid-Brief an den FBI-Chef
Der Reid-Brief an den FBI-Chef
 
Der Papierkörbin-Antrag
Der Papierkörbin-AntragDer Papierkörbin-Antrag
Der Papierkörbin-Antrag
 
WWF-Übersicht: So gehen Firmen mit Palmöl um
WWF-Übersicht: So gehen Firmen mit Palmöl umWWF-Übersicht: So gehen Firmen mit Palmöl um
WWF-Übersicht: So gehen Firmen mit Palmöl um
 
Die Zucker-Rangliste
Die Zucker-RanglisteDie Zucker-Rangliste
Die Zucker-Rangliste
 
Der Brief ans Patentamt
Der Brief ans PatentamtDer Brief ans Patentamt
Der Brief ans Patentamt
 
"Die enthemmte Mitte"
"Die enthemmte Mitte""Die enthemmte Mitte"
"Die enthemmte Mitte"
 
Der Osterhasen-Check
Der Osterhasen-CheckDer Osterhasen-Check
Der Osterhasen-Check
 
BKA-Lagebericht: Kriminalität bei Flüchtlingen
BKA-Lagebericht: Kriminalität bei FlüchtlingenBKA-Lagebericht: Kriminalität bei Flüchtlingen
BKA-Lagebericht: Kriminalität bei Flüchtlingen
 

WWF: So todbringend sind Europas Kohlekraftwerke

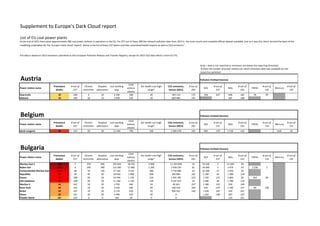
  • 1. The data is based on 2013 emissions submitted to the European Pollution Release and Transfer Registry, except for 2015 CO2 data which is from EU ETL. Grey = data is not reported or emissions are below the reporting threshold. Austria Pollution Emitted (tonnes) Power station name Premature deaths # out of 257 Chronic bronchitis Hospital admissions Lost working days Child asthma attacks €m health cost high range* CO2 emissions, tonnes (2015) # out of 243 SO2 # out of 237 NOx # out of 252 PM10 # out of 116 Mercury # out of 152 Duernrohr 10 189 0 10 2 430 180 20 565 110 175 258 227 648 181 76 95 0,00 Mellach 10 189 10 10 2 040 210 20 869 484 147 0 587 188 0 0,00 Belgium Pollution Emitted (tonnes) Power station name Premature deaths # out of 257 Chronic bronchitis Hospital admissions Lost working days Child asthma attacks €m health cost high range* CO2 emissions, tonnes (2015) # out of 243 SO2 # out of 237 NOx # out of 252 PM10 # out of 116 Mercury # out of 152 Genk-Langerlo 40 123 20 30 11 240 740 100 1 904 278 101 965 170 1 510 132 0 0,05 65 Bulgaria Pollution Emitted (tonnes) Power station name Premature deaths # out of 257 Chronic bronchitis Hospital admissions Lost working days Child asthma attacks €m health cost high range* CO2 emissions, tonnes (2015) # out of 243 SO2 # out of 237 NOx # out of 252 PM10 # out of 116 Mercury # out of 152 Maritsa East 2 730 2 370 640 192 820 18 150 2 000 11 293 658 10 54 100 2 11 500 20 0 0,00 Bobov Dol 470 6 240 390 123 280 11 680 1 290 2 458 329 81 36 600 3 3 470 63 2 230 5 0,00 ContourGlobal Maritsa East 3 140 48 70 130 37 140 3 510 380 5 759 680 32 10 300 27 2 450 92 0 0,00 Republika 70 90 40 60 18 930 1 800 200 456 894 181 5 180 65 1 380 139 0 0,00 Deven 50 108 20 50 10 340 1 150 130 1 455 781 123 1 750 122 2 840 81 163 60 0,00 AES Galabovo 50 108 20 50 11 240 1 130 130 4 187 675 53 2 580 94 1 780 119 0 0,00 Maritsa 3 20 161 10 20 4 700 460 50 20 014 237 1 180 152 550 194 0 0,00 Ruse Iztok 20 161 10 20 3 650 420 50 430 510 183 524 197 1 180 151 60 106 0,00 Brikel 20 161 10 20 4 170 410 50 956 267 140 1 030 165 520 201 0 0,00 Sliven 20 161 10 20 4 490 420 50 0 1 250 148 287 225 0 0,00 Plovdiv North 10> 232 0 0 190 20 0 0 0 115 251 0 0,00 At the end of 2015 there were approximately 280 coal power stations in operation in the EU. For 257 out of these 280 the relevant pollution data from 2013 is the most recent and complete official dataset available, and so it was this which formed the basis of the modelling undertaken for the ‘Europe’s Dark Cloud’ report1. Below is the list of these 257 plants and their associated health impacts as well as CO2 emissions2 . Supplement to Europe's Dark Cloud report List of EU coal power plants # Gives the number of power stations for which emissions data was available for the respective pollutant.
  • 2. Czech Republic Pollution Emitted (tonnes) Power station name Premature deaths # out of 257 Chronic bronchitis Hospital admissions Lost working days Child asthma attacks €m health cost high range* CO2 emissions, tonnes (2015) # out of 243 SO2 # out of 237 NOx # out of 252 PM10 # out of 116 Mercury # out of 152 Pocerady 160 40 80 150 48 700 3 270 430 5 135 531 38 5 970 52 10 300 22 321 36 0,21 16 Prunerov 150 45 80 130 48 780 3 120 390 2 634 945 75 7 180 38 6 350 41 370 31 0,25 12 Ledvice 110 59 60 90 40 540 2 440 300 708 564 164 6 810 44 2 500 90 116 75 0,10 37 Opatovice 100 63 50 80 37 260 2 260 280 1 467 416 121 6 220 51 2 430 93 157 61 0,01 134 Melnik II / III 100 63 50 80 34 420 2 140 260 1 807 893 103 5 480 59 3 120 72 258 44 0,07 52 Trebovice 80 79 40 80 21 490 1 720 210 1 153 778 131 3 270 82 3 030 74 100 86 0,00 Chvaletice 60 96 30 60 18 020 1 230 160 3 413 197 62 2 260 101 3 640 62 299 39 0,09 40 Tisova 60 96 30 50 23 160 1 400 170 1 562 430 118 3 900 74 1 400 137 98 87 0,06 57 Detmarovice 50 108 30 60 13 730 1 180 140 2 351 694 84 1 460 134 2 960 76 88 89 0,02 124 Tusimice 50 108 20 50 14 570 1 000 130 4 658 430 45 1 770 121 3 130 71 234 46 0,12 26 Plzen 50 108 30 40 19 690 1 170 140 699 517 165 3 360 80 1 040 157 0 0,04 72 Kladno 50 108 30 40 17 590 1 090 140 1 912 128 100 2 750 90 1 760 120 56 110 0,02 114 Melnik I 40 123 20 40 14 640 950 120 1 568 591 116 2 070 107 2 190 101 138 68 0,06 55 Otrokovice 40 123 20 40 10 670 780 100 358 228 192 2 170 105 612 183 0 0,01 150 Trmice 30 140 20 20 10 750 650 80 531 579 176 1 740 123 880 163 0 0,08 43 Budejovice 30 140 10 20 10 280 610 80 299 890 200 1 740 123 589 187 0 0,02 117 Prerov 30 140 10 30 7 590 580 70 406 498 189 1 300 143 835 170 0 0,00 Plana 20 161 10 20 8 100 480 60 115 310 220 1 390 138 407 209 0 0,00 Plzenska 20 161 10 20 7 600 450 60 318 285 198 1 280 145 454 204 0 0,06 53 Karvina 20 161 10 20 5 190 400 50 314 451 199 919 173 522 200 0 0,00 Kolin 20 161 10 10 6 540 390 50 174 560 212 1 120 159 330 217 0 0,02 125 Vitkovice 20 161 10 20 4 810 370 50 148 122 215 796 183 572 190 0 0,00 Porici II 20 161 10 10 6 190 380 50 479 000 179 995 168 532 199 0 0,01 139 Pribram 10 189 10 10 5 450 330 40 0 243 902 175 384 212 0 0,00 Hodonin 10 189 10 10 4 200 300 40 183 320 211 873 177 211 235 0 0,00 Ceskoslovenske Armady (CSA) 10 189 10 10 3 890 290 40 136 391 218 717 188 344 215 0 0,00 Olomouc 10 189 10 10 3 760 290 40 327 122 195 655 190 396 210 0 0,00 Chomutov 10 189 10 10 4 870 290 40 142 923 216 826 181 275 226 0 0,01 142 Zlin 10 189 0 10 2 510 190 20 204 599 209 440 208 257 231 0 0,03 95 Usti nad Labem 10 189 0 10 2 980 180 20 104 597 223 479 201 258 230 0 0,00 Privoz 10 189 0 10 2 160 170 20 0 320 221 320 220 0 0,00 Krnov 10 189 0 10 1 460 110 10 0 286 225 100 252 0 0,00 Ostrov 10> 232 0 0 1 970 110 10 0 368 214 0 0 0,00 Dvur Kralove 10> 232 0 0 1 950 110 10 30 769 235 364 215 0 0 0,00 Frydek-Mistek 10> 232 0 0 1 150 90 10 0 188 233 142 242 0 0,00 Malesice 10> 232 0 0 1 300 80 10 2 803 239 204 231 128 248 0 0,00 Koprivnice 10> 232 0 0 850 60 10 0 204 231 0 0 0,00 Brno Spitalka 10> 232 0 0 300 30 0 96 886 224 0 118 250 0 0,00 Denmark Pollution Emitted (tonnes) Power station name Premature deaths # out of 257 Chronic bronchitis Hospital admissions Lost working days Child asthma attacks €m health cost high range* CO2 emissions, tonnes (2015) # out of 243 SO2 # out of 237 NOx # out of 252 PM10 # out of 116 Mercury # out of 152
  • 3. Avedore 10 189 10 10 3 840 250 30 721 170 162 440 208 706 178 65 101 0,00 Asnaes 10 189 10 10 2 600 220 30 695 549 166 0 1 610 126 0 0,01 140 Studstrup 10 189 0 10 2 660 170 20 1 477 579 120 310 222 471 203 69 99 0,02 121 Fyns 10 189 0 10 2 340 150 20 901 683 144 273 226 411 208 0 0,01 130 Amager 10 189 0 0 1 920 120 10 862 186 149 229 229 317 221 0 0,01 148 Esbjerg 10> 232 0 0 1 110 90 10 875 783 145 0 691 179 0 0,01 138 Nordjylland 10> 232 0 0 210 20 0 1 269 764 127 0 132 247 0 0,02 116 Finland Pollution Emitted (tonnes) Power station name Premature deaths # out of 257 Chronic bronchitis Hospital admissions Lost working days Child asthma attacks €m health cost high range* CO2 emissions, tonnes (2015) # out of 243 SO2 # out of 237 NOx # out of 252 PM10 # out of 116 Mercury # out of 152 Suomenoja 20 161 10 10 4 000 270 40 744 633 159 1 790 120 1 590 128 55 112 0,00 Naantali-1 20 161 10 20 3 480 250 40 1 106 338 134 1 070 162 2 830 82 54 113 0,00 Kymijarvi 10 189 10 10 3 080 210 30 387 785 191 1 310 142 1 440 134 0 0,00 Hanasaari B 10 189 10 10 2 790 200 30 715 833 163 1 060 163 1 670 124 107 79 0,00 Salmissari 10 189 0 10 2 410 160 20 635 540 170 1 110 161 862 167 0 0,00 Martinlaakso 10 189 0 10 2 280 150 20 425 895 187 930 172 1 170 152 0 0,00 Vaskiluoto 10 189 0 10 1 890 140 20 724 592 161 488 200 1 810 117 0 0,00 Meri-Pori 10 189 0 10 2 010 130 20 356 485 193 888 176 835 170 0 0,00 Kristiina 10 189 0 10 1 230 80 10 115 503 219 451 205 786 175 0 0,00 Tahkoluoto (Pori) 10> 232 0 0 630 50 10 115 090 221 172 236 569 192 0 0,00 France Pollution Emitted (tonnes) Power station name Premature deaths # out of 257 Chronic bronchitis Hospital admissions Lost working days Child asthma attacks €m health cost high range* CO2 emissions, tonnes (2015) # out of 243 SO2 # out of 237 NOx # out of 252 PM10 # out of 116 Mercury # out of 152 Emile-Houchet 160 40 70 120 49 890 3 230 420 2 818 871 71 4 660 68 5 030 49 155 62 0,03 92 Provence 90 69 60 80 28 900 2 400 250 1 524 609 119 2 170 105 2 830 82 71 97 0,02 119 Le Havre II 80 79 40 60 21 660 2 120 220 832 291 153 5 370 61 3 340 66 263 43 0,02 109 Cordemais 60 96 30 50 15 200 1 550 170 2 135 950 94 3 430 79 4 270 54 0 0,02 111 Bois-Rouge 10> 232 0 0 0 0 0 0 2 580 94 1 560 129 0 0,00 152 Germany Pollution Emitted (tonnes) Power station name Premature deaths # out of 257 Chronic bronchitis Hospital admissions Lost working days Child asthma attacks €m health cost high range* CO2 emissions, tonnes (2015) # out of 243 SO2 # out of 237 NOx # out of 252 PM10 # out of 116 Mercury # out of 152 Jaenschwalde 470 6 240 420 157 000 10 080 1 270 23 325 104 4 23 100 12 20 500 5 675 15 0,33 9 Niederaussem 450 9 190 340 125 320 8 500 1 210 27 330 240 3 10 200 28 19 300 7 409 25 0,53 2 Grevenbroich-Neurath 410 11 160 320 98 180 7 110 1 100 32 069 617 2 6 260 49 22 800 4 401 27 0,67 1 Boxberg 300 17 150 270 97 720 6 340 800 8 615 210 16 14 000 20 14 000 16 460 21 0,37 8 Eschweiler-Weisweiler 270 18 110 200 71 070 4 930 710 18 139 249 5 5 390 60 12 700 18 277 41 0,23 13 Lippendorf 220 27 120 190 77 680 4 860 600 10 285 560 13 12 100 24 7 910 33 229 47 0,41 5
  • 4. Schwarze Pumpe 160 40 90 140 56 900 3 520 430 12 244 201 8 9 000 31 5 350 47 101 83 0,19 17 Scholven/Buer 150 45 70 110 43 900 2 960 410 4 720 436 42 3 720 77 6 110 43 203 53 0,16 22 Schkopau 130 52 70 110 47 560 2 900 360 5 351 933 37 7 760 36 3 670 59 69 98 0,43 4 Voerde West 100 63 50 80 31 050 2 040 280 1 623 293 113 2 710 91 3 970 56 53 114 0,09 41 Bergkamen 90 69 40 70 30 780 1 950 250 2 744 777 73 2 990 84 2 590 86 52 116 0,03 90 Mehrum 90 69 40 70 30 860 1 930 240 2 540 432 79 3 010 83 2 540 88 0 0,06 58 Mannheim 90 69 40 60 23 800 1 640 230 7 316 094 22 1 940 115 3 650 60 142 66 0,15 23 Petershagen Heyden 80 79 40 60 25 130 1 630 220 2 757 365 72 2 240 104 3 010 75 0 0,05 60 Karlsruhe 70 90 30 50 23 940 1 510 190 3 874 679 55 2 300 100 2 130 102 0 0,03 83 Heilbronn 70 90 30 60 22 200 1 450 200 3 178 511 64 1 910 116 2 960 76 0 0,07 46 Wilhelmshaven 70 90 30 50 21 770 1 400 190 2 931 068 67 1 990 114 2 390 95 0 0,00 Grevenbroich-Frimmersdorf 60 96 20 50 15 820 1 110 160 4 752 557 40 1 210 150 2 780 84 89 88 0,07 49 Voerde 60 96 30 40 19 580 1 240 160 4 430 371 49 1 850 119 1 880 114 0 0,03 84 Herne 60 96 30 40 18 670 1 190 160 2 654 608 74 1 730 126 1 940 110 0 0,04 70 Duisburg-Walsum 60 96 30 50 20 150 1 280 170 4 307 843 50 1 890 117 1 990 108 0 0,08 42 Bexbach 60 96 20 40 17 180 1 110 150 2 174 385 92 1 530 132 2 060 105 0 0,07 45 Quierschied-Weiher 50 108 20 30 14 930 950 120 1 678 806 110 1 400 137 1 480 133 0 0,00 Voelklingen-Fenne 50 108 20 30 15 240 960 120 929 698 142 1 470 133 1 330 142 0 0,03 89 Altbach/Deizisau 50 108 20 30 14 210 920 120 1 661 245 111 1 280 145 1 640 125 0 0,04 78 Marl 40 123 20 30 12 800 850 120 428 444 185 1 060 163 1 890 112 0 0,04 74 Ensdorf 40 123 20 30 14 700 930 120 1 186 435 129 1 410 135 1 320 143 0 0,00 Werdohl-Elverlingsen 40 123 20 30 13 750 880 120 600 596 173 1 250 148 1 540 130 0 0,03 93 Luenen 40 123 20 30 12 560 800 110 1 657 015 112 1 170 153 1 280 147 0 0,02 122 Helmstedt Buschhaus 40 123 20 30 13 690 850 100 2 278 643 89 1 380 139 930 161 0 0,03 96 Ibbenbueren 40 123 20 30 10 560 730 110 3 334 278 63 762 185 2 060 105 0 0,01 135 Hannover 30 140 20 30 11 550 720 90 1 726 850 109 1 130 158 934 160 0 0,02 118 Grosskrotzenburg Staudinger 30 140 10 30 8 390 580 90 2 182 690 91 589 194 1 710 123 0 0,03 86 Luenen-Stummhafen 30 140 10 20 9 100 580 70 2 078 468 96 848 178 924 162 0 0,00 Bremen-Hafen 30 140 10 20 8 870 580 80 0 786 184 1 080 155 0 0,05 66 Hamm Westfalen 30 140 10 20 8 000 530 70 421 504 188 672 189 1 140 153 0 0,00 Berlin-Reuter West 30 140 10 30 7 920 550 70 2 976 143 66 803 182 2 230 100 0 0,03 85 Huerth Goldenberg 30 140 10 20 8 230 530 70 1 164 166 130 762 185 856 168 0 0,04 69 Zolling-Leininger 20 161 10 20 7 840 510 70 1 740 813 108 998 167 1 540 130 0 0,01 145 Chemnitz North II 20 161 10 20 6 890 450 60 942 323 141 1 030 165 844 169 57 109 0,05 62 Bremen-Farge 20 161 10 10 6 690 420 50 1 463 745 122 655 190 536 197 0 0,11 29 Rostock 20 161 10 20 5 810 410 50 2 339 152 86 450 206 1 890 112 0 0,02 111 Frankfurt/Main West 20 161 10 10 5 280 350 50 845 066 150 439 210 773 176 0 0,03 100 Kiel East 20 161 10 10 5 510 360 40 1 438 502 124 561 195 1 280 147 0 0,03 105 Munich North 20 161 10 20 4 190 320 50 682 242 215 230 1 870 115 0 0,04 73 Walheim 20 161 10 10 4 970 320 40 57 780 232 453 204 553 193 0 0,00 Dessau 10 189 10 10 5 060 300 40 155 595 214 837 180 355 214 0 0,00 Bremen-Hastedt 10 189 10 10 4 190 280 40 779 277 155 358 217 572 190 0 0,01 135 Duisburg-Hochfeld II 10 189 0 10 3 110 200 30 515 122 178 288 224 321 219 0 0,02 108 Hamburg-Tiefstack 10 189 0 10 2 920 180 20 1 295 279 125 341 220 512 202 0 0,03 103 Schweinfurt 10 189 0 10 2 660 170 20 84 293 226 249 228 266 228 0 0,00 Flensburg 10 189 0 10 2 630 160 20 668 226 167 345 219 317 221 0 0,00 Wuppertal-Elberfeld 10 189 0 0 1 940 120 20 446 963 182 177 235 215 234 0 0,00 Waehlitz 10 189 0 0 2 160 130 20 319 041 197 363 216 134 246 0 0,00 Berlin-Moabit 10 189 0 0 1 900 120 10 292 414 201 307 223 155 241 0 0,02 120 Ulm Magirusstrasse 10> 232 0 0 560 50 10 78 274 227 0 291 223 0 0,00 Stuttgart-Muenster 10> 232 0 0 520 40 10 225 969 205 0 267 227 0 0,00 Berlin-Reuter 10> 232 0 0 580 50 10 471 540 180 0 358 213 0 0,00 Pforzheim 10> 232 0 0 300 30 10 112 501 222 0 156 240 0 0,00 Kassel 10> 232 0 0 270 20 0 33 854 234 0 137 245 0 0,00
  • 5. Offenbach 10> 232 0 0 240 20 0 236 129 204 0 121 249 0 0,01 140 Erlangen 10> 232 0 0 290 20 0 161 663 213 0 179 237 0 0,00 Frankfurt/Oder 10> 232 0 0 230 20 0 0 0 140 244 0 0,00 Greece Pollution Emitted (tonnes) Power station name Premature deaths # out of 257 Chronic bronchitis Hospital admissions Lost working days Child asthma attacks €m health cost high range* CO2 emissions, tonnes (2015) # out of 243 SO2 # out of 237 NOx # out of 252 PM10 # out of 116 Mercury # out of 152 Agios Dimitrios 270 18 160 280 84 390 9 500 750 10 558 256 12 28 200 8 14 700 13 365 32 0,41 6 Kardia 90 69 60 110 16 080 3 210 260 8 870 729 14 3 790 76 9 920 23 4 470 2 0,09 39 Amintaio 80 79 50 80 24 580 2 620 220 3 743 116 59 8 560 32 2 720 85 304 37 0,18 18 Ptolemaida 80 79 50 70 15 020 2 240 210 2 541 516 78 5 200 64 1 810 117 4 500 1 0,07 50 Megalopoli B 20 161 10 20 4 260 610 40 2 205 148 90 1 170 153 1 870 115 87 90 0,14 24 Megalopoli A 10 189 10 10 2 840 370 30 2 422 022 82 842 179 963 158 0 0,08 44 Melitis (Florina) 10 189 0 10 1 850 270 20 1 605 506 114 494 199 877 164 0 0,03 104 Hungary Pollution Emitted (tonnes) Power station name Premature deaths # out of 257 Chronic bronchitis Hospital admissions Lost working days Child asthma attacks €m health cost high range* CO2 emissions, tonnes (2015) # out of 243 SO2 # out of 237 NOx # out of 252 PM10 # out of 116 Mercury # out of 152 Matra 160 40 80 170 45 230 3 660 440 6 363 197 27 6 280 48 7 360 38 0 0,00 Oroszlany 30 140 10 30 8 150 660 80 427 101 186 1 160 155 1 280 147 0 0,00 Bakony 10 189 0 10 2 690 210 30 72 258 228 435 211 336 216 0 0,00 Ireland Pollution Emitted (tonnes) Power station name Premature deaths # out of 257 Chronic bronchitis Hospital admissions Lost working days Child asthma attacks €m health cost high range* CO2 emissions, tonnes (2015) # out of 243 SO2 # out of 237 NOx # out of 252 PM10 # out of 116 Mercury # out of 152 Moneypoint 110 59 60 80 29 150 2 790 290 4 528 857 46 7 160 39 4 890 50 213 51 0,01 143 Italy Pollution Emitted (tonnes) Power station name Premature deaths # out of 257 Chronic bronchitis Hospital admissions Lost working days Child asthma attacks €m health cost high range* CO2 emissions, tonnes (2015) # out of 243 SO2 # out of 237 NOx # out of 252 PM10 # out of 116 Mercury # out of 152 Fiume Santo 120 58 70 100 37 750 2 980 320 2 404 218 83 3 300 81 2 520 89 0 0,02 122 La Spezia 100 63 60 90 33 550 2 680 280 2 532 872 80 2 920 87 2 270 99 100 85 0,03 101 Fusina 90 69 50 80 26 610 2 190 230 5 779 411 31 2 020 111 2 550 87 0 0,03 91 Torrevaldaliga Nord 80 79 50 80 23 980 2 050 220 10 736 213 11 1 590 130 2 880 79 61 103 0,02 110 Sulcis 70 90 40 60 22 500 1 750 190 1 294 280 126 2 070 107 1 240 150 0 0,00
  • 6. Brindisi Sud 70 90 40 80 18 650 2 450 180 13 112 244 7 5 560 58 6 280 42 105 80 0,02 107 Monfalcone 60 96 40 60 15 420 1 480 160 2 037 302 98 466 203 3 260 68 72 96 0,00 Genova 20 161 10 20 7 010 570 60 807 445 154 557 196 608 184 0 0,00 Bastardo 10 189 10 10 4 610 380 40 37 150 233 354 218 431 205 0 0,00 Brescia 10> 232 0 0 580 60 10 219 311 208 0 167 239 0 0,00 Netherlands Pollution Emitted (tonnes) Power station name Premature deaths # out of 257 Chronic bronchitis Hospital admissions Lost working days Child asthma attacks €m health cost high range* CO2 emissions, tonnes (2015) # out of 243 SO2 # out of 237 NOx # out of 252 PM10 # out of 116 Mercury # out of 152 Amer 100 63 50 80 31 280 2 050 270 5 669 492 33 2 760 89 3 870 57 56 111 0,03 93 Maasvlakte 80 79 40 60 26 130 1 670 220 5 895 070 29 2 500 97 2 370 97 58 108 0,03 82 Gelderland 13 40 123 20 30 14 190 900 120 2 885 312 70 1 330 141 1 410 135 0 0,01 146 Hemweg 30 140 20 30 11 580 740 90 4 195 699 52 1 150 156 865 166 62 102 0,02 127 Borssele 12 30 140 10 20 9 270 580 70 2 054 544 97 904 174 763 177 0 0,00 Poland Pollution Emitted (tonnes) Power station name Premature deaths # out of 257 Chronic bronchitis Hospital admissions Lost working days Child asthma attacks €m health cost high range* CO2 emissions, tonnes (2015) # out of 243 SO2 # out of 237 NOx # out of 252 PM10 # out of 116 Mercury # out of 152 Belchatow 1 270 1 630 1 310 359 200 27 830 3 450 37 051 920 1 61 000 1 40 300 1 1 010 7 0,16 20 Kozienice 650 3 320 660 186 500 14 140 1 770 11 393 513 9 33 400 5 18 100 9 0 0,22 14 Rybnik 480 5 240 490 134 660 10 380 1 290 6 548 392 25 23 300 11 14 400 15 381 29 0,18 19 Turow 360 14 190 300 129 510 7 940 970 7 595 544 18 21 400 13 9 180 25 911 9 0,05 64 Adamow 270 18 140 280 76 740 5 960 740 3 908 045 54 13 500 22 7 830 34 679 14 0,44 3 Ostroleka 190 31 100 200 54 290 4 210 520 1 403 241 9 440 30 5 730 45 342 34 0,03 87 Polaniec 180 32 90 200 47 220 4 120 490 6 299 450 28 4 890 66 10 400 21 515 18 0,07 47 Patnow II 170 36 80 180 46 910 3 800 470 5 371 308 36 6 630 46 7 430 37 104 81 0,38 7 Jaworzno 3 170 36 90 190 47 740 3 900 470 4 519 062 47 6 410 47 8 120 31 66 100 0,10 36 Opole 160 40 80 180 43 590 3 750 440 5 821 226 30 4 530 71 9 570 24 198 54 0,21 15 Zeran 150 45 70 150 41 610 3 150 400 2 324 804 88 7 990 34 3 160 70 385 28 0,03 97 Dolna Odra 140 48 70 130 45 240 2 960 390 4 691 837 43 5 920 53 8 340 30 136 70 0,09 38 Laziska 140 48 70 150 38 300 3 100 380 3 784 947 58 5 580 56 5 800 44 189 55 0,10 32 Skawina 130 52 70 130 37 040 2 830 370 1 564 082 117 6 840 41 3 260 68 267 42 0,03 81 Lagisza 130 52 70 140 36 910 2 970 360 2 912 395 69 5 570 57 5 280 48 248 45 0,00 Krakow 130 52 60 130 34 930 2 810 360 1 782 340 105 5 760 55 4 200 55 637 16 0,01 143 Siersza 100 63 50 100 27 740 2 080 260 1 816 763 102 5 330 62 2 100 103 138 68 0,04 77 Wroclaw 90 69 40 90 25 390 1 930 240 1 081 987 137 4 600 70 2 380 96 81 93 0,00 Stalowa Wola 90 69 50 90 25 700 1 960 250 832 521 151 4 660 68 2 400 94 139 67 0,05 63 Gdansk 2 80 79 40 80 22 140 1 720 210 1 088 560 135 3 830 75 2 370 97 145 64 0,05 67 Bydgoszcz II 80 79 40 80 21 400 1 630 200 754 880 158 3 910 73 1 950 109 134 71 0,03 98 Lodz 3 60 96 30 60 16 740 1 280 160 656 150 169 2 940 85 1 720 122 0 0,01 128 Poznan-Karolin 60 96 30 60 16 110 1 280 160 1 144 354 132 2 660 92 1 930 111 184 56 0,03 99 Bedzin 50 108 20 50 13 750 1 050 130 520 833 177 2 600 93 1 110 154 178 58 0,00 Patnow II 50 108 20 50 12 530 1 020 120 2 350 415 85 1 700 127 2 100 103 0 0,12 27 Pomorzany 40 123 20 40 15 340 960 120 763 880 157 2 440 98 1 400 137 122 73 0,01 137 Gdynia 40 123 20 40 12 080 950 120 660 491 168 2 060 109 1 340 141 112 77 0,03 102
  • 7. Lodz 4 40 123 20 40 12 010 930 110 769 004 156 2 020 111 1 380 139 0 0,01 133 Zabrze 40 123 20 30 9 830 750 100 223 731 207 1 860 118 794 174 114 76 0,00 Katowice 40 123 20 30 10 000 740 100 867 301 148 2 030 110 582 189 84 92 0,02 115 Jaworzno 2 40 123 20 40 10 070 770 100 870 727 146 1 740 123 1 080 155 0 0,01 147 Chorzow 2 30 140 20 30 9 150 700 90 1 082 121 136 1 650 128 868 165 60 104 0,02 111 Konin 30 140 20 30 8 790 700 90 628 153 171 1 300 143 1 300 145 0 0,04 76 Czechnica 30 140 10 30 7 750 590 70 280 217 203 1 360 140 798 173 0 0,00 Zofiowka 20 161 10 20 6 930 530 70 21 409 236 1 280 145 608 184 60 105 0,00 Miechowice 20 161 10 20 6 110 460 60 201 533 210 1 200 151 422 206 77 94 0,00 Bialystok 20 161 10 20 5 050 420 50 326 380 196 629 193 936 159 0 0,04 71 Mielec 10 189 10 10 3 790 280 40 138 643 217 745 187 261 229 0 0,00 Bielsko-Biala 10 189 10 10 3 240 250 30 0 243 649 192 204 236 52 115 0,00 Tychy 10 189 10 10 3 170 250 30 64 889 230 519 198 388 211 0 0,00 Zofiowka Moszczenica 10 189 0 10 2 370 180 20 0 427 212 227 233 0 0,00 Blachownia 10 189 0 10 1 580 160 20 284 908 202 0 615 182 0 0,00 Szczecin 10> 232 0 0 880 70 10 1 470 240 0 544 196 0 0,00 Zgierz 10> 232 0 0 780 50 10 0 243 185 234 0 0 0,00 Czestochowa 10> 232 0 0 710 50 10 341 676 194 170 237 0 0 0,00 Portugal Pollution Emitted (tonnes) Power station name Premature deaths # out of 257 Chronic bronchitis Hospital admissions Lost working days Child asthma attacks €m health cost high range* CO2 emissions, tonnes (2015) # out of 243 SO2 # out of 237 NOx # out of 252 PM10 # out of 116 Mercury # out of 152 Sines 80 79 50 90 26 980 2 540 220 8 683 899 15 4 180 72 4 660 52 0 0,10 33 Pego 30 140 20 40 10 560 1 020 90 3 615 854 60 1 610 129 2 040 107 0 0,03 80 Romania Pollution Emitted (tonnes) Power station name Premature deaths # out of 257 Chronic bronchitis Hospital admissions Lost working days Child asthma attacks €m health cost high range* CO2 emissions, tonnes (2015) # out of 243 SO2 # out of 237 NOx # out of 252 PM10 # out of 116 Mercury # out of 152 Drobeta 430 10 220 350 118 170 10 840 1 180 978 674 139 35 900 4 1 750 121 445 22 0,03 88 Mintia 340 15 170 310 80 970 8 260 910 918 725 143 21 100 14 7 950 32 2 590 3 0,00 Rovinari 250 23 120 240 58 510 6 000 680 5 412 542 35 13 600 21 8 920 27 744 12 0,06 56 Oradea II 240 24 120 200 61 250 5 990 660 987 568 138 18 400 16 1 310 144 2 330 4 0,00 Govora 230 25 120 200 59 980 5 820 630 1 126 695 133 17 200 17 2 860 80 1 360 6 0,00 Turceni 180 32 90 190 40 450 4 310 490 4 454 326 48 7 870 35 9 120 26 303 38 0,05 68 Paroseni 170 36 90 140 46 500 4 240 460 832 470 152 14 200 19 550 194 103 82 0,00 Craiova II 170 36 90 140 46 020 4 300 470 1 241 520 128 13 500 22 1 610 126 284 40 0,00 Isalnita 90 69 40 70 22 920 2 140 230 2 608 863 76 6 830 42 595 186 227 48 0,00 Iasi II 50 108 20 40 11 590 1 140 130 17 271 238 2 940 85 1 290 146 59 107 0,00 Bacau 30 140 10 20 7 150 690 70 70 567 229 2 010 113 419 207 86 91 0,00 Slovakia Pollution Emitted (tonnes)
  • 8. Power station name Premature deaths # out of 257 Chronic bronchitis Hospital admissions Lost working days Child asthma attacks €m health cost high range* CO2 emissions, tonnes (2015) # out of 243 SO2 # out of 237 NOx # out of 252 PM10 # out of 116 Mercury # out of 152 Novaky 470 6 230 450 138 320 9 700 1 240 2 143 125 93 31 000 7 3 270 67 0 0,00 Teko 30 140 20 30 8 440 690 80 429 166 184 1 150 156 1 410 135 0 0,00 Zvolenska 20 161 10 20 6 060 460 60 96 610 225 1 120 159 533 198 0 0,00 Martinska 10 189 0 10 2 610 200 20 0 475 202 240 232 0 0,02 126 Vojany I 10 189 0 10 2 020 150 20 390 409 190 378 213 171 238 0 0,00 Slovenia Pollution Emitted (tonnes) Power station name Premature deaths # out of 257 Chronic bronchitis Hospital admissions Lost working days Child asthma attacks €m health cost high range* CO2 emissions, tonnes (2015) # out of 243 SO2 # out of 237 NOx # out of 252 PM10 # out of 116 Mercury # out of 152 Sostanj 180 32 110 170 53 430 4 550 500 3 791 039 57 3 550 78 6 400 40 147 63 0,01 149 Te-Tol 20 161 10 20 6 800 580 60 565 901 174 446 207 828 172 0 0,00 Spain Pollution Emitted (tonnes) Power station name Premature deaths # out of 257 Chronic bronchitis Hospital admissions Lost working days Child asthma attacks €m health cost high range* CO2 emissions, tonnes (2015) # out of 243 SO2 # out of 237 NOx # out of 252 PM10 # out of 116 Mercury # out of 152 Andorra 400 12 260 360 150 370 11 970 1 100 4 663 461 44 25 500 10 7 520 36 371 30 0,07 51 Litoral 180 32 120 190 63 080 5 550 480 6 440 967 26 10 200 28 7 330 39 329 35 0,06 54 Abono 140 48 100 160 46 740 4 540 380 7 545 959 19 7 150 40 8 850 28 350 33 0,05 59 As Pontes 130 52 90 160 44 660 4 350 360 7 542 286 20 6 830 42 8 480 29 435 23 0,05 61 Compostilla II 130 52 90 150 43 780 4 190 350 4 233 843 51 6 780 45 7 580 35 561 17 0,14 25 Anllares 110 59 70 120 38 730 3 440 300 729 054 160 6 230 50 4 770 51 221 49 0,01 131 Meirama 90 69 60 90 32 430 2 810 250 3 016 683 65 5 280 63 3 470 63 108 78 0,04 78 Alcudia II 80 79 60 80 29 850 2 580 230 1 987 163 99 4 870 67 3 100 73 166 59 0,01 131 La Robla 60 96 40 80 16 550 1 940 160 2 587 314 77 2 250 103 5 500 46 506 19 0,01 129 Los Barrios 50 108 40 70 15 820 1 710 140 3 499 191 61 2 260 101 4 350 53 183 57 0,00 Soto de Ribera 50 108 30 50 15 530 1 460 120 2 925 818 68 2 430 99 2 490 91 143 65 0,00 Velilla 40 123 30 50 11 290 1 290 100 1 781 042 106 1 540 131 3 720 58 123 72 0,00 Lada 30 140 20 40 10 020 1 100 90 1 761 226 107 1 410 135 2 930 78 101 83 0,00 Narcea 30 140 20 40 7 860 990 80 1 786 748 104 973 169 3 410 65 0 0,02 106 Puente Nuevo 20 161 10 20 5 860 510 40 1 593 746 115 948 171 683 180 0 0,00 Sweden Pollution Emitted (tonnes) Power station name Premature deaths # out of 257 Chronic bronchitis Hospital admissions Lost working days Child asthma attacks €m health cost high range* CO2 emissions, tonnes (2015) # out of 243 SO2 # out of 237 NOx # out of 252 PM10 # out of 116 Mercury # out of 152 Vaerta 10> 232 0 0 190 20 0 608 308 172 0 330 217 0 0,00 Vaesteras 10> 232 0 0 170 10 0 225 314 206 0 290 224 0 0,00 Linkoeping 10> 232 0 0 80 10 0 61 239 231 0 141 243 0 0,00
  • 9. United Kingdom Pollution Emitted (tonnes) Power station name Premature deaths # out of 257 Chronic bronchitis Hospital admissions Lost working days Child asthma attacks €m health cost high range* CO2 emissions, tonnes (2015) # out of 243 SO2 # out of 237 NOx # out of 252 PM10 # out of 116 Mercury # out of 152 Drax 590 4 300 480 142 590 14 630 1 590 13 192 780 6 32 300 6 39 300 2 752 11 0,31 10 Longannet 380 13 210 290 105 240 10 100 1 040 7 457 176 21 25 800 9 17 900 11 489 20 0,11 30 Eggborough 340 15 180 260 87 080 8 620 920 4 748 504 41 20 800 15 17 900 11 820 10 0,26 11 Aberthaw 270 18 120 240 41 490 5 540 710 6 703 696 24 5 860 54 31 500 3 432 24 0,10 35 Ferrybridge 260 22 130 200 64 600 6 490 690 2 328 454 87 15 200 18 14 600 14 680 13 0,10 34 Ratcliffe 230 25 110 190 51 580 5 510 640 4 774 148 39 11 000 26 18 100 9 119 74 0,11 31 Cottam 220 27 100 190 40 580 4 850 580 6 756 444 23 7 620 37 20 100 6 928 8 0,12 28 Fiddler’s Ferry 210 29 110 170 52 440 5 330 570 5 556 750 34 12 100 24 13 200 17 405 26 0,07 48 West Burton 210 29 100 180 42 380 4 760 550 7 724 207 17 8 430 33 18 300 8 217 50 0,16 21 Rugeley 110 59 50 100 17 290 2 270 300 3 854 947 56 2 570 96 12 400 19 206 52 0,04 75 Kilroot 50 108 30 40 12 510 1 280 140 2 079 830 95 2 800 88 3 650 60 0 0,00 151 * Depending on the monetary valuation applied for mortality, the cost attributed to one premature death is either the median value of 1.26 million Euros or the high value of 2.56 million Euros (2013 prices). See Holland (2014), Cost-benefit Analysis of Final Policy Scenarios for the EU Clean Air Package. http://ec.europa.eu/environment/air/pdf/TSAP%20CBA.pdf 1. A few coal stations from this list have closed in the meantime: Genk-Langerlo in Belgium, Varna in Bulgaria, Huerth Goldenberg in Germany, Oroszlany in Hungary, Borssele 12 in Netherlands, Gelderland 13 in Netherlands, Zgierz in Poland, Ferrybridge in UK, Rugeley in UK, Longannet in UK. 2. All health impacts numbers were rounded to closest 10