Vogel, Felix: Urban greenhouse gas monitoring in the Greater Toronto Region, ...
Carbon accounting using flux measurements
1. Carbon accounting using flux
measurements (Happy anniversary NL-Loo )
Jan Elbers, Eva Kleingeld, Cor Jacobs, Bert van Hove, Eddy Moors
Background
Objective
• To explore differences in CO2 exchange between an urban and a forest
site on daily to annual scales.
• To explain these differences in terms of eco-climatic drivers, like light
intensity, versus anthropogenic drivers, like traffic intensity and domestic
heating.
Conclusions and outlook
Acknowledgements
We thank the city of Arnhem for the supplied traffic data and ACM Vastgoed for hosting the flux
tower.
It is found that the amount of carbon taken up by Loobos in the 20 years
since the start of flux measurements is emitted from the centre of Arnhem
in just one year. These data can help with the analysis and verification of
emissions and emission factors.
Arnhem in reality emits 16 tons CO2 per capita per year while the World
Bank reports 11 tons. Loobos takes up 4.4 tons CO2 per year per hectare
while UNFCCC reports 2.5 tons.
Methods
Strong heterogeneity in CO2 exchange may exist in landscapes where cities
are located near forest. The combination of the eddy-covariance (EC) flux
tower at the Loobos forest site and the urban EC flux tower in the city of
Arnhem offers an excellent opportunity to study differences in CO2
exchange over small distances. Because the sites experience approximately
similar weather conditions they can be regarded as a colocation of towers.
Wageningen University & Research
P.O. Box 123, 6700 AB Wageningen
Contact: name.surname@wur.nl
T + 31 (0)317 12 34 56, M +31 (0)6 12 34 56 78
www.wur.nl/xxxxx
At the Loobos tower CO2 exchange has now been observed for 20 years.
For a site description see Elbers (2011).
More recently, an EC station was erected 22 km from Loobos in the city
centre of Arnhem, at a site with low vegetation cover (only 12%). The
Arnhem site has now been running for 4 years.
Seasonal trends show large variation in Arnhem emissions. They are
explained in terms of traffic intensity and heating degree days (HDD = 18-
Tavg if Tavg<15°C, Eurostat). HDD is accumulated over time indicating that
the colder the weather, the larger the heating demand.
Results
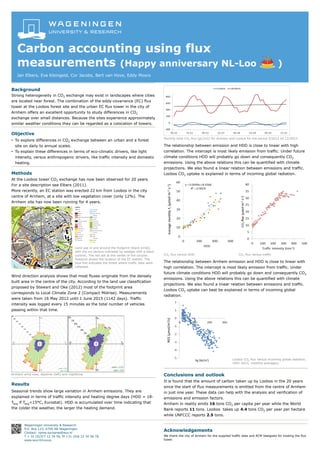
CO2 flux versus HDD CO2 flux versus traffic
The relationship between emission and HDD is close to linear with high
correlation. The intercept is most likely emission from traffic. Under future
climate conditions HDD will probably go down and consequently CO2
emissions. Using the above relations this can be quantified with climate
projections. We also found a linear relation between emissions and traffic.
Loobos CO2 uptake is explained in terms of incoming global radiation.
Land use in and around the footprint (black circle),
with the six sectors indicated by wedges with a black
outline). The red dot at the center of the circular
footprint shows the location of the EC station. The
blue line indicates the street where traffic data were
collected.
Wind direction analysis shows that most fluxes originate from the densely
built area in the centre of the city. According to the land use classification
proposed by Stewart and Oke (2012) most of the footprint area
corresponds to Local Climate Zone 2 (Compact Midrise). Measurements
were taken from 16 May 2012 until 1 June 2015 (1142 days). Traffic
intensity was logged every 15 minutes as the total number of vehicles
passing within that time.
Arnhem wind rose, daytime (left) and nighttime.
Monthly total CO2 flux (gC/m2) for Arnhem and Loobos for the period 5/2012 till 12/2015.
Loobos CO2 flux versus incoming global radiation,
1997-2015, monthly averages).
The relationship between Arnhem emission and HDD is close to linear with
high correlation. The intercept is most likely emission from traffic. Under
future climate conditions HDD will probably go down and consequently CO2
emissions. Using the above relations this can be quantified with climate
projections. We also found a linear relation between emissions and traffic.
Loobos CO2 uptake can best be explained in terms of incoming global
radiation.