1. 28 GATFWorld April 2004
Real-World Exposures in Florida & Arizona
How can you know whether an ink will remain fade
resistant under the variety of lighting conditions that it may
encounter during its service life? What is the cost of product
failure? What is the price/performance trade-off between
affordability and performance? Is there a quick and easy
way to determine (or decide) which ink is best for your
application?
This article is first in a three-part series that will answer
these questions and provide a useful roadmap for assessing
ink durability. Part 1 presents results from real-world
sunlight through glass window exposures in Florida and
Arizona. These internationally recognized test locations
provide a “worst case” scenario by exposing inks to high UV,
high temperatures, and high relative humidity.
Part 2 will show how accelerated lab exposures mimic
real-world results. Part 3 will provide guidance and recom-
mendations on how to determine which ink is best for
your needs. This definitive study correlates real-world and
accelerated laboratory test results for lithographic inks.
Test Program
Sunlight contains short wavelength UV and visible and
infrared energy. UV is the primary cause of degradation in
inks, with temperature and moisture acting as secondary
stressors that can accelerate the rate of degradation.
Lithographic inks may encounter intense sunlight by
being placed near a window, or worse yet, placed on a car
dashboard during the summer months, where they will likely
encounter high UV, high temperatures, and high humidity.
Florida and Arizona test locations were chosen for this study
because they provide these extreme environments.
GATF selected eight widely-used lithographic ink colors:
Yellow #1, Yellow #2, Yellow #3, Magenta, Violet, Orange,
Red, and Purple. A Little Joe Proofing Press was used to
make prints at typical offset film thicknesses. The inks were
printed on a typical, coated, 70-pound paper substrate.
Replicates of each ink color were printed for all of the
exposures.
The ink test specimens were tested by Q-Lab Weather-
ing Research Service in Florida and Arizona. They were
placed in glass-covered cabinets, angled at 45 degrees south,
FadeResistanceofLithographicInks:
ANewPathForward—Part1
by John Lind, Director of Research, GATF, John Stack, Chemist, National Institute for Occupational Safety
and Health/National Personal Protective Technology Laboratory, and Eric T. Everett, Q-Panel Lab Products
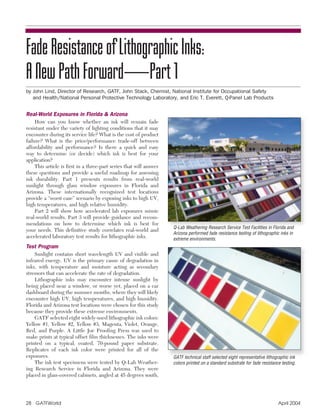
Q-Lab Weathering Research Service Test Facilities in Florida and
Arizona performed fade resistance testing of lithographic inks in
extreme environments.
GATF technical staff selected eight representative lithographic ink
colors printed on a standard substrate for fade resistance testing.
2. to maximize exposure of sunlight filtered through window
glass. The sunlight through window glass spectrum was
chosen because it best simulates worst-case indoor lighting
conditions.
The ink test specimens were measured for color change
before, during, and after exposure. A spectrophotometer was
used to take the color measurements in accordance to ASTM
D2244. The total color change, expressed in delta E units,
was recorded for each specimen. Note: It is also possible to
perform a visual color assessment of inks or to have instru-
mental color measurements performed by a qualified test lab.
Florida and Arizona Exposures
Florida exposure tests were started at four seasonal inter-
vals: Fall Equinox (9/21/02), Winter Solstice (12/21/02),
Spring Equinox (3/21/03) and Summer Solstice (6/21/03).
The Arizona exposure test was started in the fall (10/7/02).
Table 1 shows the total light energy intensity (i.e. radiant
dosage) expressed in megajoules/m2
at the conclusion of the
various outdoor exposure tests after ninety days in Florida
and Arizona:
Graph 1 shows the fade resistance performance of the
eight ink colors during the Florida Fall exposure.
As the graph illustrates, there is a wide range of durabil-
ity in the inks. Some pigments had excellent fade resistance,
while others had very poor fade resistance.
TABLE 1: Total Sunlight Outdoor Exposure Summary
MJ/m2
at 300–3000nm
Exposure Days MJ/m2
Florida Fall 90 Days 1926.17
Florida Winter 90 Days 1541.13
Florida Spring 90 Days 1252.54
Florida Summer 90 Days 1081.73
Arizona Fall 90 Days 1611.20
After ninety days, the majority of ink test specimens were
severely faded and not useful for analysis. However, by
thirty-five days, the inks exhibited a wide range of fade resis-
tance, from excellent to poor. Therefore, thirty-five days was
chosen to evaluate the performance of the inks in the various
outdoor exposures.
Graph 2 shows the range of durability for the three
yellow ink test specimens in the Florida Fall exposure.
This graph is a powerful example showing the wide range
of durability between three different inks of the same color.
Even though they all were the same color, they had very
significant differences in their fade resistance. The Yellow
A performed dramatically better than either Yellow B or Yel-
low C. In fact, Yellow A is a fade-resistant yellow, suitable for
fine art reproductions or outdoor applications, while Yellow
B and C are intended for general commercial printing.
April 2004 GATFWorld 29
Ink specimens were placed in ASTM G24 glass-covered exposure
racks in Florida and Arizona benchmark locations.
Graph 1 - Fade Resistance Range for Eight Colors.
3. Effect of Seasonal Variation
Because the natural exposures were so short-term
(thirty-five days), the test was repeated at seasonal intervals
to determine the effect of time of year on degradation. The
results showed that the time of year did not affect the fade
resistance rankings. All seasonal exposures correlated with
each other in terms of rank order. However, there was a dif-
ference in the rate of degradation.
In order to quantify the difference in the seasonal rates
of degradation, the average delta E (at 35 days) can be
compared. For example, the average delta E value of all the
inks in the Florida Winter exposure is 21, while it is 44 for
the Florida Fall exposure. In this case, the Fall exposure was
approximately 2-to-1 more severe than the Winter exposure.
Because the rate varies by season, you should not compare
absolute values of specimens exposed at different times of
the year. Such inconsistency may not play a factor when
using accelerated fade testing equipment. Table 2 shows the
total delta E color change for all inks after 35 days for the
various Florida seasonal exposures and Arizona exposure:
Graph 3 compares the Florida Fall (35 days) and
Winter (45 days) exposures. There was perfect rank order*
correlation between the two exposures.
30 GATFWorld April 2004
F a d e R e s i s t a n c e o f L i t h o g r a p h i c I n k s : A N e w P a t h F o r w a r d
Graph 2 - Fade Resistance Range for One Color Graph 3 - Fade Resistance Correlation
Table 2, delta E Color Change of Inks in Various Outdoor Exposures
Specimen FL Fall FL Winter FL Spring FL Summer AZ Fall Avg. delta E
35 days 35 days 35 days 35 days 35 days
Yellow A 3.78 0.94 0.56 2.03 2.80 2.02
Yellow B 106.82 86.81 88.41 87.36 105.65 95.01
Yellow C 89.49 10.90 39.94 38.47 13.20 38.40
Magenta 5.68 3.29 3.71 3.52 5.82 4.40
Orange 23.23 8.19 11.79 11.02 8.37 12.52
Red 18.21 8.38 12.60 10.06 11.65 12.18
Violet 73.82 31.98 55.18 45.33 28.38 46.93
Purple 33.36 20.44 21.23 20.05 30.94 25.20
Avg delta E 44.30 21.37 29.18 27.23 25.85 29.58
4. Florida: Fall vs. Winter
Rank Order = 1.0. *Perfect rank order correlation is rep-
resented as a value of 1.0. Random rank order correlation is
represented as a value of 0. Negative rank order correlation
is represented as a value of –1.0.
Graph 4 compares Florida Winter (45 days) vs. Florida
Summer (35 days). Again, there was excellent rank order
(1.0) between the two seasonal exposures.
Florida: Winter vs. Summer
Rank Order = 1.0
Arizona Exposure
The Arizona exposure correlated well with the Florida
exposures. The Arizona exposures indicate that fast test
results were obtained in the same time period (thirty-five
days) as the Florida exposures.
Graph 5 compares Arizona vs. Florida at 35 days:
Arizona vs. Florida
Rank Order = 0.96
As shown in Table 3, rank order values were all very good
(0.90 and above) for all of the outdoor exposures.
Conclusions (Part 1)
1. Both Florida and Arizona, under glass exposures, provided
an extreme environment and quickly separated pigments
with excellent fade resistance from pigments with poor
fade resistance.
Table 3, Rank Order Correlation Matrix
FL Summer FL Fall FL Winter FL Spring AZ Fall
FL Summer — 0.98 0.93 0.98 0.90
FL Fall 0.98 — 1.0 0.95 0.98
FL Winter 0.93 1.0 — 0.97 0.96
FL Spring 0.98 0.95 0.97 — 0.93
AZ Fall 0.90 0.98 0.96 0.93 —
2. All outdoor exposures correlated with each other.
3. All outdoor exposures were fast and effective. In thirty-
five days, the relative durability of all ink specimens was
determined.
4. In this series of tests, the time of year did not make a
difference in ranking performance of inks. Seasonal vari-
ability only made a difference in the speed of degradation.
5. Outdoor exposures are highly useful for fade resistance
testing of any ink. Because it has been reported (Tobias
and Everett, 2002) that the substrate that an ink is printed
on may also affect its stability, it is recommended that the
ink be tested on a variety of substrates.
Part 2 test results will show how the Q-Sun Xenon Arc
correlated with the outdoor exposures. Part 3 will offer
recommendations on how to develop a quick and easy way
to determine which ink is best for your needs.
April 2004 GATFWorld 31
Graph 4 - Fade Resistance Correlation Graph 5 - Fade Resistance Correlation
5. America’s Premier Industry Events
Please Send Me More Information About: ■ Attending ■ Exhibiting
■ VUE/POINT®
CONFERENCE • March 29 – 31, 2004
■ GUTENBERG FESTIVAL®
• June 17 – 19, 2004
■ GRAPH EXPO®
and CONVERTING EXPO®
• October 10 – 13, 2004
■ GRAPHIC ARTS THE CHARLOTTE SHOW®
• March 17 – 19, 2005
Name Title
Company E-Mail
Address
City, State, Zip, Country
Telephone Fax
Return form to:
GASC®
1899 Preston White Dr.
Reston, VA 20191-4367
USA
E-Mail: info@gasc.org
Phone: 703/264-7200
Fax: 703/620-9187
www.gasc.org
America’s Premier Industry Events
Make the
Connection ...
Make the
Connection ...
GATFWorld Distribution Sponsor
6. Further Reading
Lucas, Julie. “Keep Your True Colors: Lightfastness
and Weathering Testing.” GATFWorld May/June 2001.
ASTM D2244. “Test Method for Calculation of
Color Differences from Instrumentally Measured Color
Coordinates.”
ASTM G24. “Standard Practice for Conducting
Exposures to Daylight Filtered Through Glass.”
Tobias, Russell H. and Eric T. Everett. “Lightfastness
Studies of Water-Based Inkjet Inks on Coated and
Uncoated Papers.” IS&T Publications 2002.
Q-Panel Lab Products is a global provider of light stability and
weatherability products and services. For more info visit
www.q-panel.com. Eric T. Everett is a standards administrator
for Q-Panel Lab Products with ten years experience in stan-
dards development and has authored several articles and
technical papers addressing light stability. He can be reached
at 440-835-8700 or email eeverett@q-panel.co.
April 2004 GATFWorld 33
Printing Research, Inc. – www.superblue.net
10954 Shady Trail, Dallas,TX 75220 USA
(800) 627-5537 or (214) 353-9000
Fax: (214) 357-5847
What do you mean,
It’s not dry!?
See us at: drupa 2004, Hall 15, Stand B14-5
Make it Happen
with these Innovative Solutions:
‘Cold’™
& Zone™
ultraviolet curing systems
Air Blanket®
& Quik Dry®
infrared drying systems
AIRS®
automated impurity removal systems
SUPER BLUE 2®
anti-static, anti-marking systems
GATF’s Web Offset Press Operating workshop is comprehensive
training that will help your web press staff improve uptime, reduce
waste counts, and operate with less supervision. The hands-on
portion of the workshop offers the opportunity to immediately
apply and reinforce what the workshop attendee learned. This
workshop is a great way to educate pressroom staff on the funda-
mentals of web offset press operations!
Your Press Operators Will Learn
• Fundamental web operations and how to evaluate press-related
problems
• Techniques that can be put to use in your plant, through equip-
ment demonstrations that bring concepts to life
• The quality control measurements you have to understand in
order to obtain superior color reproduction
• What you must do to keep your pressroom crew operating at
peak efficiency
Others in Your Company Who
Should Attend this Workshop
• Web press operators
• Assistant press operators
• Roll tenders
• Maintenance staff
• Manufacturing representatives
Workshop Dates
June 25–29, 2004 (Code G1050604)
October 25–29, 2004 (Code G1051004)
Workshop Leader
Greg Workman is a multicolor press operator at GATF’s state-of-
the-art production facility. With over twenty years experience in
the printing industry, he offers real-world knowledge as an
instructor in a number of GATF workshops. Workman is also a
certified press operator by the National Council for Skills Standard
for web and sheetfed presses.
For additional information about this workshop or other GATF’s
technical workshops, visit http://www.gain.net/PIA_GATF/
workshop.html or contact Sara Hantz at 412-741-6860 x113 or via
e-mail at shantz@gatf.org.
W E B O F F S E T P R E S S O P E R AT I N G W O R K S H O P
GATFWorld Distribution Sponsor
7. 24 GATFWorld June 2004
FadeResistanceofLithographicInks:
ANewPathForward—Part2
by John Lind, Director of Research, GATF, John Stack, Research Lab Technician, National Institute for Occupational
Safety and Health/National Personal Protective Technology Laboratory, and Eric T. Everett, Q-Panel Lab Products
The purpose of our overall study was to (1) quantify the
fade resistance of typical lithographic inks in an environment
which approaches “worst case” service conditions; (2) estab-
lish a reasonable benchmark for fade resistance testing of
inks; and to (3) identify test methods which provide quick
and easy ways to evaluate ink performance.
In Part 1 (GATFWorld, April 2004), we presented test
results from actual “sunlight through the window” exposures
in Florida and Arizona. Our primary reason for doing expo-
sure tests in these extreme environments was to see if our
lithographic inks would remain fade resistant in a very severe
indoor environment.
In Part 2, we now present results of laboratory xenon arc
exposures performed on an identical set of lithographic ink
specimens. Our goals were two-fold. We wanted to deter-
mine (1) how well did the lab exposures mimic actual, real-
world exposures with regard to their actual degradation
mode and relative rank order, and (2) how much faster were
the lab exposures compared to the natural exposures?
Why Xenon Arc Testing?
Historically, the ink industry has used accelerated labo-
ratory tests to get fast results. Xenon arc testers are widely
used because they provide fast results by accelerating critical
environmental stresses such as light spectrum, light intensity,
relative humidity (RH), and temperature.
For most indoor products, direct sunlight coming
through the window is the most severe indoor lighting con-
dition. A recent Kodak study concluded that even indirect,
window-filtered daylight dominates the indoor lighting envi-
ronment in homes (Bugner, LaBarca et. al, 2003). Conse-
quently, this GATF/Q-Panel study used Q-Sun Xenon
Testers equipped with “window glass filters”to achieve an
appropriate spectrum.
The Test Program
GATF and Q-Panel’s Q-Lab Weathering Research Ser-
vice tested ink specimens in Q-Sun Xenon Test Chambers.
One xenon tester was a small, less-expensive “tabletop” unit
without RH controls (Xe-1), while the other was a full-size,
full-featured xenon tester with precise control of RH (Xe-3).
We conducted exposures in different models to see if we
could get the same results.
GATF selected eight widely-used lithographic ink colors,
including magenta, violet, orange, red, purple, and three
different yellows. A Little Joe Proofing Press was used to
produce prints at typical offset film thickness. The inks were
printed on a typical, coated, 70-pound paper substrate. Iden-
tical replicates of each ink color were printed for all of the
exposures.
GATF and Q-Lab tested inks in Q-Sun Xenon test chambers.
Q-Sun testers are available in tabletop and full-sized models
8. Xenon Arc Exposure Test Conditions
Q-Sun Xenon (Xe-1 & Xe-3)
ASTM D3424, Method 3
Window Glass Filter
Irradiance Level: 0.55 W/m2
/nm at 340 nm
Relative Humidity: Xe-1 Effective RH = 15%
Xe-3 RH = 50%
Exposure Cycle: Continuous Light at 63 ± 3˚C (145 ± 5˚F)
Test Duration: 31 Days
Total Radiant Exposure = 1473 kJ/m2
at 340 nm
Inks were measured for color before, during, and after
exposure using a spectrophotometer in accordance to ASTM
D2244. Delta E (total color change) was recorded for each
specimen.
Q-Sun Test Results
After ten days, both models of Q-Sun tester discrimi-
nated the good performing inks from bad performing inks.
Graph 2 shows the fade resistance performance of the eight
ink colors in a Q-Sun Xe-1.
Both xenon arc exposures were also able to sort out the
yellow inks with excellent fade resistance from those with
poor fade resistance. Graph 3 shows the range of durability
for the three yellow ink test specimens in Q-Sun Xe-1.
Although their initial appearance was similar, one of the
yellow inks performed much better than the others. This
shows the range of durability possible in various ink formula-
tions and illustrates the value of testing. As it happens, the
yellow ink with excellent fade resistance is designed for fine
art reproductions or outdoor applications, while the others
are designed for general commercial printing.
Relative Humidity
To determine the effect of RH, the inks were exposed in
a Q-Sun which controlled RH at 50% (Xe-3-H) and another
where the effective relative humidity was approximately 15%
(Xe-1). Graph 4 compares the exposures after ten days.
June 2004 GATFWorld 25
Florida and Arizona Summary
In Part 1, sunlight through window glass exposures provided
a high-UV, high-temperature and high-relative humidity (RH)
exposure environment for our inks. We exposed inks in the
benchmark exposure locations of Florida and Arizona, which are
widely used for testing paints, plastics, textiles, and a variety of
other materials.
In about a month, these extreme, real-world test environ-
ments quickly separated inks with excellent fade resistance from
those inks with poor fade resistance. Regardless of the season or
location, the tests were fast and effective and the relative rankings
of the inks were very similar. The only real differences among the
natural exposures were in the speed of degradation.
0.0
0.4
0.8
1.2
1.6
2.0
2.4
300 350 400 450 500 550 600 650 700 750 800
Wavelength (nm)
Irradiance(W/m2)
Q-Sun Xenon Arc
with Window Glass Filter
0.35 W/m2 @ 340 nm
Sunlight through
Window Glass
Q-Sun With Window Glass Filter
vs. Sunlight-Through-Window Glass
Graph 1 - Q-Sun Xenon Arc with Window Glass Filter vs. Sunlight
Through Window Glass
Q-Sun Fade Resistance Range
0
10
20
30
40
50
60
70
80
90
100
110
120
130
1 2 3 4 7 10 14 17 21 24 28 31
DaysDeltaE
Graph 2 - Q-Sun Fade Resistance of Eight Litho Inks
9. There was excellent correlation. RH made very little differ-
ence for these particular inks.
Q-Sun Compared to Florida
In Part 1, we established a benchmark for fade resistance
testing of inks in the extreme environments of Florida and
Arizona. For Part 2, we wanted to compare benchmark data
with the Q-Sun results. Graph 5 compares the Q-Sun expo-
sure at 10 days to the Florida Under-Glass exposure at thirty-
five days.
Although the numerical results were not identical, the
results show perfect rank order* correlation between the two
exposures. In this comparison, the Q-Sun at ten days was
approximately equivalent to thirty-five days in Florida. For
this particular set of test specimens, the Q-Sun provided an
acceleration factor of almost four-to-one.
As shown in Table 1, rank order values for the Q-Sun and
outdoor exposures were all very good.
* Perfect rank order agreement is represented as a value
of 1.0. Random rank order correlation is represented as a value
of zero. Negative rank order correlation is represented as a
value of –1.0.
26 GATFWorld June 2004
F a d e R e s i s t a n c e o f L i t h o g r a p h i c I n k s — P a r t 2
Q-Sun Fade Resistance
Range For 3 Yellow Inks
0
10
20
30
40
50
60
70
80
90
100
110
120
1 2 3 4 7 10 14 17 21 24 28 31
Days
deltaE
Graph 3 - Q-Sun Fade Resistance for 3 Yellow Inks
Effect of Relative Humidity
delta E
0
10
20
30
40
50
60
70
80
90
100
110
120
0 10 20 30 40 50 60 70 80 90 100 110 120
Q-Sun 50% RH
Q-Sun15%RH
Rank Order = 0.98
Graph 4 - Relative humidity had no noticeable effect on
fade resistance
Table 1. Rank Order Correlation Matrix
Q-Sun FL Summer FL Fall FL Winter FL Spring AZ Fall
Xenon 35 Days 35 Days 35 Days 35 Days 35 Days
Q-Sun Xenon — 0.98 0.97 0.83 0.95 0.88
FL Summer 0.98 — 0.98 0.93 0.98 0.90
FL Fall 0.97 0.98 — 1.0 0.95 0.98
FL Winter 0.83 0.93 1.0 — 0.97 0.96
FL Spring 0.95 0.98 0.95 0.97 — 0.93
AZ Fall 0.88 0.90 0.98 0.96 0.93 —
10. Conclusions
Part 1 established real world benchmark data for the fade
resistance of these particular litho inks. Regardless of the
season, the Florida and Arizona under-glass exposures
quickly (thirty-five days) sorted out inks with good fade resis-
tance from inks with poor fade resistance. In Part 2, we can
draw the following conclusions:
1. Just like the Florida and Arizona exposures, the Q-Sun
Xenon separated the good inks from the bad inks. Although
no accelerated lab test can replace actual real-world
exposures, the Q-Sun exposures correlated very well with the
established outdoor exposure benchmark data.
2. The Q-Sun Xe-1 tabletop xenon tester gave the same
test results as the more expensive Q-Sun Xe-3 xenon tester.
For this particular study, RH did not make a noticeable
difference in the test results. The Q-Sun Xe-1 is easy to use.
3. The Q-Sun was fast. In only ten days, the Q-Sun repro-
duced thirty-five days of Florida under glass exposure.
Depending upon the time of the year, the acceleration factor
ranged from about four-to-one to almost seven-to-one.
However, a word of caution. These acceleration factors may
not be valid for other sets of inks.
Further Reading
Bugner, Douglas, et. al, Research & Development
Laboratories, Eastman Kodak Company, “Survey of Envi-
ronmental Conditions Relative to Display of Photographs in
Consumer Homes,” IS&T Publications 2003.
Lucas, Julie, “Keep Your True Colors: Lightfastness and
Weathering Testing,” GATFWorld, May/June 2001
Tobias, Russell H. and Eric T. Everett, “Lightfastness
Studies of Water-Based Inkjet Inks on Coated and Uncoated
Papers,” IS&T Publications 2002.
ASTM D3424, Standard Test Methods for Evaluating
the Relative Lightfastness and Weatherability of Printed
Matter
ASTM G151, Standard Practice for Exposing Non-
metallic Materials in Accelerated Test Devices That Use
Laboratory Light Sources
ASTM G155, Standard Practice for Operating Xenon Arc
Light Apparatus for Exposure of Nonmetallic Materials
June 2004 GATFWorld 27
Florida (35 Days) vs.
Q-Sun (10 Days) delta E
0
10
20
30
40
50
60
70
80
90
100
110
120
0 10 20 30 40 50 60 70 80 90 100 110 120
Florida
Q-Sun
Rank Order = 0.98
Graph 5 - The Q-Sun showed a very high correlation with Florida Even the smallest lab can afford a tabletop tester like the Q-Sun.
11. 30 GATFWorld August 2004
FadeResistanceofLithographicInks—
ANewPathForward—Part3
by John Lind, Director of Research, PIA/GATF; John Stack, Research Lab Technician, National Institute for Occupational
Safety and Health/National Personal Protective Technology Laboratory; and Eric T. Everett, Q-Panel Lab Products
This article is the final installment of our three-part
series on fade resistance of lithographic inks. Our goals were
to (1) test the fade resistance of typical lithographic inks
under “worst-case,” real-world service conditions; (2) estab-
lish a reasonable exposure benchmark for fade resistance
testing of inks, and (3) use standardized test methods for a
quick and easy means to evaluate ink performance.
In Part 1, we presented test results from “sunlight
through window glass” exposures in the extreme environ-
ments of Florida and Arizona. This was done to determine if
our lithographic inks would remain fade resistant in a worst
case indoor scenario.
In Part 2, we presented test results from laboratory
xenon arc exposures were performed on an identical set of
lithographic ink specimens to find out (1) how well the lab
xenon exposures mimicked Florida and Arizona exposures
in terms of actual degradation and relative rank order and
(2) how much faster the lab exposures were to the natural
exposures.
In Part 3, we conclude our definitive study by providing
guidance and recommendations on how to establish an
appropriate testing protocol to help you determine which ink
is best for your needs.
Developing a Meaningful
Test Program
In order to design an appropriate test program and
achieve meaningful results, you must first define your testing
goals. That is, are you testing your ink to:
■ Avoid product failure
■ Verify supplier claims about an ink’s performance
■ Match the ink’s performance to its intended application
To get meaningful answers to these questions, you need
to have a firm understanding of your product by defining
these four criteria:
1. Application. What are the intended uses of your ink?
(e.g., general applications, packaging, archival)
2. Service Environment. Will the ink be used indoors or
outdoors?
3. Failure Mode. What constitutes product failure? (e.g.,
fading, color change, delamination)
4. Endpoint. How can you quantify whether a given
formulation is acceptable?
Once you have defined these criteria for your particular
product, you should understand certain general assumptions
about testing. Since you cannot simulate every possible
environment that your product may encounter, you should
design a test that captures the “worst-case” environment.
Choose extreme service environments to establish bench-
marks to evaluate how your product will perform. By doing
this, you will gain confidence in how your product will
perform in a variety of end-use applications.
A word of caution: Each end-use environment produces
a different rate of degradation. Therefore, service life pre-
dictions are dangerous and unreliable. There are a myriad of
other factors that can cause product degradation besides UV
light: temperature, moisture, humidity, and ozone. These
environmental factors can work independently or in tandem
with UV light. Because of these factors, you cannot simply
input data in the form of absolute values into a mathematical
equation to generate accurate lifetime predictions. If you
really want service life predictions, then you must test in the
product’s actual service environment.
Outdoor testing is very affordable and provides real world
exposure data.
12. Putting It All Together
After you have defined your testing goals and general
assumptions about testing, you are ready to begin testing.
As shown in Part 1, select internationally recognized
benchmark locations, like Florida and Arizona, to test your
product in extreme, yet real world environments. This
testing will provide you with benchmark durability data.
Once you have (1) determined the performance of your
product in benchmark locations, and (2) confirmed your
product failure modes, you now have the confidence to do
accelerated testing to get even faster test results. In other
words, “Simulate then Accelerate.”
Accelerated lab testing for light stability is best
accomplished by using a tester like the Q-Sun Xenon Test
Chamber. A properly filtered xenon arc provides an excellent
simulation of the sunlight through window glass spectrum.
This spectrum is typically the most severe indoor lighting
condition. A xenon arc tester also provides fast test results by
accelerating critical environmental stresses, such as light
intensity, RH, and temperature.
After doing multiple tests in a xenon arc tester to gener-
ate durability data, you can evaluate the data using statistical
methods, like rank order, to assess relative performance (e.g.,
“A is better than B for a certain set of conditions”).
At this point, you can determine the agreement between
the natural and lab results. Once correlation is established,
you can use accelerated data to begin assessing product
performance in the lab. This information allows you to
choose between suppliers or formulations. It is important
to periodically reconfirm your lab tests with more natural
exposures.
Conclusions and Recommendations
The ideal test program includes:
1. Outdoor Weathering. Test in Florida and Arizona
benchmark locations.
2. Accelerated Lab Testing. Test in a Q-Sun Xenon Test
Chamber to provide the best simulation of sunlight through
window glass exposure.
3. Standardized Test Procedures. Use standardized testing
procedures, such as ASTM or ISO, proven methods for
product evaluation. These documents provide credibility
between vendors and suppliers.
For example, there is a standardized test procedure for
light stability testing of litho inks (ASTM D3424). It specifies
both outdoor under glass exposures and accelerated labora-
tory xenon arc exposures for ink performance evaluation.
4. Test, Evaluate, and Test Again. You should always
perform both natural and accelerated tests. The natural tests
provide real world data, while the accelerated tests can give
you fast answers.
Q-Panel Lab Products is a global provider of light stability
and weatherability products and services. For more info visit
www.q-panel.com.
August 2004 GATFWorld 31
An ideal test program includes natural outdoor exposures in Florida or Arizona benchmark locations and accelerated lab testing in a Q-Sun
Xenon Test Chamber.