SlideShare a Scribd company logo
1 of 140
Download to read offline
The National Recovery Plan 
2011-2014 
BAILE ÁTHA CLIATH 
ARNA FHOILSIÚ AG OIFIG AN tSOLÁTHAIR 
Le ceannach díreach ón 
OIFIG DHÍOLTA FOILSEACHÁN RIALTAIS, 
TEACH SUN ALLIANCE, SRÁID THEACH LAIGHEAN, BAILE ÁTHA CLIATH 2, 
nó tríd an bpost ó 
FOILSEACHÁIN RIALTAIS, AN RANNÓG POST-TRÁCHTA, 
AONAD 20 PÁIRC MIONDÍOLA COIS LOCHA, CLÁR CHLAINNE MHUIRIS, CONTAE MHAIGH EO 
(Teil: 01 – 6476834 nó 1890 213434; Fax 094 - 9378964 nó 01 – 6476843) 
nó trí aon díoltóir leabhar. 
__________ 
DUBLIN 
PUBLISHED BY THE STATIONERY OFFICE 
To be purchased directly from the 
GOVERNMENT PUBLICATIONS SALE OFFICE 
SUN ALLIANCE HOUSE, MOLESWORTH STREET, DUBLIN 2, 
or by mail order from 
GOVERNMENT PUBLICATIONS, POSTAL TRADE SECTION, 
UNIT 20 LAKESIDE RETAIL PARK, CLAREMORRIS, CO. MAYO 
(Tel: 01 – 6476834 or 1890 213434; Fax: 094 - 9378964 or 01 – 6476843) 
or through any bookseller. 
(Prn. A10/1705) Price €15.00 
1
2
Overview and Summary.......................................................................................................5 
Chapter 1 Economic Policy...........................................................................................14 
1.1 The Economy in 2010....................................................................................................14 
1.2 Budgetary Adjustment...................................................................................................16 
1.3 Achieving Economic Recovery.........................................................................................19 
1.4 The Economic Outlook, 2011-2014..................................................................................24 
Chapter 2 Strategy for Competitiveness, Growth and Employment...............................29 
2.1 Overview – the Strategy for Economic Recovery...............................................................29 
2.2 Restoring Cost Competitiveness......................................................................................31 
2.3 Removing Barriers to Employment Creation and Disincentives to Work...............................35 
2.4 Re-orienting Activation Measures....................................................................................38 
2.5 Enterprise Policy - Investment, Exports and Sectoral Performance.....................................40 
2.6 Conclusion: Anticipated Medium-term Outcomes..............................................................51 
Chapter 3 General Expenditure Context......................................................................53 
3.1 Introduction..................................................................................................................53 
3.2 Why We Must Reduce Expenditure..................................................................................55 
3.3 Composition of Expenditure............................................................................................57 
3.4 Strategy and Principles for Expenditure Reductions 2011-2014..........................................58 
3.5 Budget Reform..............................................................................................................59 
Chapter 4 Current Expenditure Measures....................................................................61 
4.1 Introduction..................................................................................................................61 
4.2 Public Service Pay Costs.................................................................................................63 
4.3 Reforming Institutions and Service Delivery.....................................................................65 
4.4 Redeployment...............................................................................................................66 
4.5 Public Service Transformation.........................................................................................67 
4.6 Public Service Sectoral Reform........................................................................................68 
4.7 Public Service Pension Reforms.......................................................................................71 
4.8 Social Protection Expenditures........................................................................................74 
4.9 Other Programme Expenditures......................................................................................76 
4.10 Savings from Reducing the Costs of Public Administration.................................................78 
4.11 Debt Interest Costs and Debt Management......................................................................80 
Chapter 5 Public Capital Investment...........................................................................82 
5.1 Overview......................................................................................................................82 
5.2 Role of Capital Investment in the Economy......................................................................84 
5.3 NPRF Approach to Infrastructure Investment...................................................................86 
5.4 Investment by Commercial State Bodies..........................................................................87 
Chapter 6 Taxation Measures......................................................................................89 
6.1 Introduction..................................................................................................................89 
6.2 Approach......................................................................................................................89 
3
6.3 Objective......................................................................................................................90 
6.4 Income Tax...................................................................................................................91 
6.5 Pensions Tax Expenditures.............................................................................................93 
6.6 General Tax Expenditures...............................................................................................95 
6.7 Value Added Tax and Indirect Tax..................................................................................97 
6.8 Financing Local Services.................................................................................................98 
6.9 Carbon Tax...................................................................................................................99 
6.10 Capital Taxation...........................................................................................................99 
6.11 Corporation Tax..........................................................................................................100 
6.12 Small and Medium Enterprises.....................................................................................101 
6.13 Impact of the Main Income Tax changes......................................................................101 
Annexes 1-11....................................................................................................................104 
4
Overview and Summary 
This Plan provides a blueprint for a return to sustainable growth in our economy. It sets out in detail the measures that will be taken to put our public finances in order. It identifies the areas of economic activity which will provide growth and employment in the next phase of our economic development. It specifies the reforms the Government will implement to accelerate growth in those key sectors. 
Reducing the budget deficit will not, by itself, solve our economic difficulties. We must build on our strong export performance by improving our competitiveness. We must enhance our productive capacity by maintaining investment in key infrastructure projects and in education. We must remove barriers to employment and ensure that those who have lost their jobs are retrained and are ready to take up employment as the labour market recovers. This Plan sets out the key reform measures the Government will take to return our economy to a sustainable medium-term economic growth path. 
The Plan will help dispel uncertainty and reinforce the confidence of consumers, businesses and of the international community. The tax and expenditure measures contained in this Plan will negatively affect the living standards of citizens in the short-term. But postponing these measures will lead to greater burdens in the future for those who can least bear them, and will jeopardise our prospects of returning to sustainable growth and full employment. 
Over the last two and a half years, we have responded promptly to the deterioration in the public finances. In five separate adjustment packages, savings and revenue-raising of around €14.6 billion on a full year basis have already been achieved. As a result our public finances have stabilised with an underlying deficit of 11.7% of GDP in 2010 compared with an implied uncorrected deficit of 20% of GDP. Notwithstanding the size of the adjustment, our economy has performed better this year than had been forecast at the end of 2009, with GDP growth expected to be marginally positive as opposed to a contraction of 1.3% which had been predicted this time last year. 
Unfortunately, lower than expected medium-term economic growth prospects as well as higher debt interest costs arising from the bank rescue have required us to revise our budgetary targets. To achieve a deficit of below 3% of GDP by 2014, the Government has concluded that an overall saving of €15 billion is required. The European Commission acknowledges that this is the appropriate target based on the growth projections we have set for the period of the Plan. 
5
Public Finances 2004 - 2014 0510152025303540455020042005200620072008200920102011201220132014Year % of GDP General Government Revenue (% of GDP)General Government Expenditure (% of GDP) 
To demonstrate the seriousness of its intent, the Government has decided that 40% or €6 billion of the €15 billion adjustment will be made in 2011. This commitment to the early delivery of the Plan will engender confidence at home and abroad that we can restore order to our public finances. The adjustment will be made up of €10 billion in spending reductions and €5 billion in tax and revenue raising measures. These are demanding but realistic targets. With a concerted national effort, they can be achieved. 
From the late 1990s, the benefits of our booming economy were felt across every section of the population. Working-age social welfare rates are now more than twice their rate in 2000. Over the same period, the State pension almost doubled. These increases were well ahead of the cost of living. 
Public service pay also increased well ahead of inflation. From 2000 to 2009 average public service salaries increased by 59%. At the same time, taxation was reduced. During the period after 2000, the entry point to income tax increased from €7,238 to €18,300 for PAYE earners and since 2000, bands have widened by 105% for the single person and married two earners. Credits have increased by 92% since their introduction in 2001. The standard and higher tax rates fell from 26% and 48% in 1997/98 to 20% and 41% by 2007. 
As a result of these changes, the proportion of income earners exempt from income tax increased from 34% in 2004 to an estimated 45% in 2010. It is now estimated that for the current year, 42% of income earners will pay tax at the standard rate and just 13% will be liable at the top rate. 
6
The substantial reductions in tax and increases in welfare were made possible by the very high level of property-related tax receipts taken in by the Exchequer during the boom years. The property boom also swelled VAT and other receipts. In 2007, capital taxes and stamp duty yielded €6.7 billion. This year, that figure is expected to fall to as low as €1.6 billion. In these dramatically changed circumstances, it is clear the State can no longer afford the current levels of social provision and personal taxation. 
The effect of the spending reductions for 2011 detailed in this plan will be to bring us back to working age social welfare rates slightly above 2007 levels. The income tax measures, outlined in Chapter 6, will bring us back to levels prevalent as recently as 2006. 
The major drivers of public spending are Public Service Pay and Pensions; Social Welfare and Public Service programme spending; and Public Investment. Gross Voted Public Spending 201027% 24% 26% 5% 7% 11% Working age social expendituresProgramme expendituresPublic service payPublic sector pensionsSocial welfare pensionsInvestment 
The bulk of the savings we must achieve will have to come from these categories. The Government is determined to eliminate waste and make maximum savings from efficiencies. But it is simply not credible to suggest that our public finance difficulties can be resolved without impacting on the public service pay bill, social welfare or public services. 
General Government Gross Debt1 is expected to be 95% of GDP by the end of 2010 and will peak at 102% in 2013, before falling to 100% by 2014. We cannot continue to accumulate debt at this pace without damaging public services. As it is, an ever-increasing proportion of tax revenue is being diverted from much-needed public services to pay the interest on our debt which has a first call on our resources. For this reason, it is critical that an immediate and significant reduction is made to our reliance on borrowing to finance our running costs. 
1 The estimates of General Government Debt contained in this Plan do not take account of any additional support to the banking system that may be part of a negotiated programme of external assistance. 
7
Exchequer Debt Interest Comparison 2009 and 2014 
2014 
Debt Interest 
€8.4 billion 
€2.5 billion 
2009 
Debt Interest 
Note: The €8.4 billion above is a post-consolidation figure. The 2009 amount represents about 8% of tax revenue while the 2014 amount represents 20% of projected revenue for that year. 
No person, group or sector can be absolved from making a fair contribution to the resolution of our economic difficulties. The measures contained in the Plan are proportionate. We must all accept our share of the burden so that we can collectively share in the fruits that will undoubtedly flow from solving our current problems. 
Significant and lasting gains have been won for this country over the period of our boom. For example, the decisions to pay down the national debt and set up the National Pensions Reserve Fund have strengthened our capacity to deal with this economic crisis. The transformation of our public infrastructure and our investment in education has served to increase our competitiveness and put us in a position to take advantage of recovery in the global economy. 
The scale of the spending adjustment we must now make dictates that investment must be curtailed. But the careful funding choices made in this Plan seek to protect core areas of economic investment such as education and supports for enterprise and innovation for the development of the smart economy. Investment in key social infrastructure such as public transport, hospitals, schools, water and environmental services will also be maintained. 
This Plan reaffirms the Government’s unambiguous position on the maintenance of the 12½% rate of corporation tax. This is a cornerstone of our pro-enterprise, outward-looking industrial policy and has remained consistent over successive administrations. 
Our budgetary adjustments over the last two and a half years have stabilised our public finances. We must now continue on this path by adhering to the targets set out in the Plan. The strategy and these targets in particular will be reviewed annually and action will be taken in the event of any deviation from the central projection. 8
This Plan is based on the information available up to mid-November 2010. The figures referred to in the document may change as a result of policy decisions taken by Government after publication. 
Macroeconomic Principles and Outlook (Chapter 1) 
While the budgetary adjustment required is substantial, the prospects for a return to growth are favourable. Ireland is a small, open economy and export performance during the recession has been markedly robust. 
The vitality and dynamism of our economy depends on the health of our export sector which in turn stimulates domestic demand and creates jobs. The strategy underpinning this Plan will stimulate broadly-based export-led growth to increase output, to return to sustainable employment creation and to assist recovery in the domestic economy. 
Many of the essential conditions for a resumption of export-led growth are in place: our road network and our public transport system have been transformed; we have one of the best educated workforces in the world; and our tax system supports enterprise and innovation. This Plan sets out the measures we will take to increase productivity and rebuild our competitiveness. 
The current account of the balance of payments is expected to return to surplus in 2011 and record a steadily rising surplus over the following three years. This means that from next year the economy as a whole will no longer be borrowing from the rest of the world. 
Macroeconomic Outlook 2011–14 
The reforms set out in this Plan will lead to a more stable macroeconomic position: 
ƒ 
Real GDP will grow by an average of 2¾% in the years from 2011 to 2014; 
ƒ 
From 13½% in 2010, unemployment will fall below 10% in 2014. 
Budget Strategy (Chapter 1) 
Approximately two thirds of the budgetary adjustment (€10 billion) will be achieved through expenditure savings and one third (€5 billion) through revenue-raising measures. Within the expenditure saving of €10 billion, current expenditure will be reduced by €7 billion and capital investment by €3 billion. 
Budget Strategy 2011–14 
The Plan will correct budgetary imbalances: 
ƒ 
€15 billion budgetary correction over 4 years; 
ƒ 
€10 billion in public expenditure, €5 billion in tax and revenue raising; 
ƒ 
40% or €6 billion will be front-loaded in 2011; 
ƒ 
Deficit will be reduced to 9.1% of GDP in 2011 and to below 3% by 2014; and 
ƒ 
Debt to GDP ratio will peak at 102% in 2013 and will fall to 100% by 2014. 
9
Strategy for Competitiveness, Growth and Employment (Chapter 2) 
Government policy must support the private sector by removing potential structural impediments to competitiveness and employment creation, and by pursuing appropriate sectoral policies to encourage export growth and a recovery of domestic demand. 
At present, the level of the minimum wage is out of step with an economy where GNP has fallen by 19%. Other labour market regulations are preventing job creation – especially in sectors where unemployment among younger and less-skilled workers is most prevalent. Decisive reform is required. 
Welfare and labour market policies must reward work and provide a pathway to employment, education and training opportunities for those who have lost their jobs. Reforms in this area, along with measures to enhance competitiveness, are pivotal to growth in our economy. 
Competitiveness, Growth and Employment 
The Government will: 
ƒ 
Reduce the minimum wage by €1 to €7.65; 
ƒ 
Reform welfare system to incentivise work and eliminate unemployment traps; 
ƒ 
Complete a review to eliminate anomalies in Registered Employment Agreements (REAs) and Employment Regulation Orders (EROs) within three months; and 
ƒ 
Reinvigorate activation policies to ensure that unemployed people can make a swift return to work. 
Cost competitiveness: 
ƒ 
Promote rigorous competition in the professions and measures to reduce legal costs; 
ƒ 
Take decisive actions to reduce waste and energy costs faced by businesses including the development of Smart Grids and renewable energy; 
ƒ 
Enhance availability of technological infrastructure, in particular next generation broadband networks; 
ƒ 
Lead efforts to reduce office rents in both the private and public sectors; and 
ƒ 
Increase efficiency in public administration to reduce the costs for the private sector. 
Sectoral Policies: 
ƒ 
Implement sector-specific measures to assist an increase in exports as well as an increase in domestic demand. 
ƒ 
Support innovation through the innovation fund, other enterprise supports and the tax system, and encourage small business development. 
Expenditure Measures (Chapters 3, 4 & 5) 
The job of Government is to create the conditions in which enterprise can flourish and jobs can be created. The most important of these conditions is sound public finances. Since 2007, our national income (GNP) has fallen by 15% and our tax revenues have reduced from over €47 billion to €31.5 10
billion and are now back to 2003 levels. In these circumstances, the current level of public spending is unaffordable. It must be returned to a sustainable level relative to the size of the economy. 
The bulk of the savings will have to come from the major drivers of spending including Public Service Pay and Pensions, Social Welfare, Public Services including student supports, free or subsidised medical care and treatment and Public Investment. 
The expenditure measures contained in this Plan are designed not only to return public spending to a sustainable level but also to protect those most in need and facilitate economic recovery. Careful choices have been made to target scarce resources at those most in need, to protect enterprise and to promote competitiveness. Investment in education, innovation and enterprise has been maintained. The targets set for a reduction in public service staff levels together with the full implementation of the Croke Park Agreement will create a more efficient and effective public service, a crucial component of competitiveness that will deliver better services to the citizens at a lower cost. 
Capital spending must be reduced. But these reductions of €3 billion by 2014 must be considered in the context of the very substantial investment over the past decade which has transformed our road network, our public transport system, our educational institutions and our cultural, sport and tourist facilities. In the current lower cost environment, better value can be achieved from a lower level of capital investment creating a high level of capacity in the economy and delivering important social infrastructure. 
Expenditure Savings 
Government will: 
ƒ 
Reduce current expenditure by €7 billion by 2014, bringing spending back to 2007 levels; 
ƒ 
Reduce the cost of the public sector pay and pensions bill, social welfare, and public service programmes; 
ƒ 
Achieve savings in social welfare expenditure of €2.8 billion by 2014 through a combination of enhanced control measures, labour activation, structural reform measures, a fall in the Live Register, and, if necessary, further rate reductions; 
ƒ 
Cut public service staff numbers by 24,750 over 2008 levels, back to levels last seen in 2005; 
ƒ 
Reduce the public sector pay bill by about €1.2 billion between 2010 and 2014; 
ƒ 
Make more effective use of staffing resources with redeployment of staff within and across sectors of the public service to meet priority needs; 
ƒ 
Reform work practices to provide more efficient public services with scarcer resources; 
ƒ 
Introduce a reformed pension scheme for new entrants to the public service and reduce their pay by 10%; 
11
ƒ 
Introduce a pension deduction for public service pensioners to yield €100 million in savings; 
ƒ 
Reduce non-pay and non-social welfare spending by €3 billion over the period; 
ƒ 
Increase the student contribution to the costs of third level education; 
ƒ 
Introduce water metering by 2014; and 
ƒ 
Reform and update the existing budget system beginning in Budget 2011. 
Taxation Measures (Chapter 6) 
While the bulk of the budgetary adjustment is on the expenditure side, taxation must also play a role in bridging the gap between the State’s income and expenditure. Revenue-raising measures will contribute one third of the overall budgetary adjustment. The tax system must be capable of raising the resources necessary to pay for essential public services in a manner that does not unduly impede economic development. The Government remains committed to the 12½% corporation tax rate: it will not be increased under any circumstances. 
In 2010, it is estimated that 45% of taxpayers will pay no income tax. This is not sustainable. A fundamental principle of the reform outlined in this Plan is that all taxpayers must contribute according to their means. Those who can pay most will pay most but no group can be sheltered. 
The measures contained in this Plan will broaden the tax base by bringing more taxpayers into the tax net, abolishing or curtailing a range of tax exemptions and reliefs, and introducing a new site value tax. These changes will bring us back to an income tax structure last seen in 2006. Approximately one third of the revenue raised will come from indirect tax, capital tax and other charges; one third from direct income tax; and the final third from tax expenditures. 
This Plan contains a set of measures which will increase Government revenues over the next four years by just over €5 billion or approximately 3% of GDP in 2010 terms. Approximately 40% of the policy measures will be front-loaded into 2011, resulting in substantial structural reform of the income tax system. 
Revenue measures 
Government will: 
ƒ 
Maintain the 12½% corporation tax rate; this will not change; 
ƒ 
Raise €5 billion over the period of the Plan - 40% of measures will be front-loaded; 
ƒ 
Raise €1.9 billion through income tax changes; 
ƒ 
Implement pension-related tax changes to yield €700 million, with €240 million in tax savings on the public service pension-related deduction; 
ƒ 
Abolish/curtail a range of tax expenditures yielding €755 million; 
ƒ 
Increase the standard rate of VAT from 21% to 22% in 2013, with a further increase to 23% in 2014. These changes will yield €620 million; 
12
ƒ 
Introduce a Site Value Tax to fund essential locally-delivered services. This will yield €530 million; 
ƒ 
Increase the price of carbon gradually from €15 to €30 per tonne, yielding €330 million; 
ƒ 
Reform Capital Acquisitions Tax and Capital Gains Tax to yield an additional €145 million; 
ƒ 
Transform the Business Expansion Scheme (BES) into a new Business Investment Targeting Employment Scheme (BITES). 
Conclusion 
Our economy is beginning to recover. There will be a small increase in GDP this year. Given the 7.6% decline recorded in 2009 that in itself is remarkable. The impact of our improved competitiveness can already be seen in our healthy export figures. Both our foreign owned and indigenous exporting companies have been extremely resilient throughout the downturn. Even in the difficult trading circumstances of this year, they have increased their market share. 
This Plan will enable us to build upon the many positive aspects of our economy so that we can return to a sustainable medium-term growth path. The measures it contains will: 
ƒ 
remove barriers to growth; 
ƒ 
boost our competitiveness; and 
ƒ 
restore order to our public finances. 
Detailed policy measures identified in the Plan will build on our strengths and develop other sectors to provide a balanced economy and employment for our citizens. Our future prosperity rests upon the implementation of this Plan over the next four years. 
13
Chapter 1 Economic Policy 
Key Messages 
ƒ 
The economy is expected to stabilise this year before expanding at an annual average rate of 2¾% between 2011 and 2014. 
ƒ 
A €15 billion package of measures is required to restore order to the public finances by 2014. 
ƒ 
This package will comprise two thirds expenditure and one third revenue measures. 
ƒ 
The adjustment will weigh on domestic demand, but its overall effect will be mitigated by the economy’s high propensity to import and by the positive impact of budgetary adjustments on competitiveness and confidence. 
ƒ 
Ireland is a small, open economy in which long-term sustainable growth depends on the health of its internationally trading sectors. 
ƒ 
The conditions for sustainable export-led growth are in place - good infrastructure, high-quality human capital, a favourable taxation environment and available credit for viable businesses. 
ƒ 
The Plan sets out policies to assist a resumption of output and employment growth, including structural reforms to enhance labour market flexibility and cost competitiveness. 
ƒ 
Export-led growth will foster recovery in the domestically trading sectors. 
ƒ 
Growth in GDP is expected to bring the unemployment rate down below 10% by 2014. 
ƒ 
The balance of payments (BoP) is expected to return to surplus in 2011 and the surplus will steadily increase over the following three years. This means that the economy as a whole will no longer be borrowing from the rest of the world. 
1.1 The Economy in 2010 
1.1.1 Current Position 
The economy is emerging from recession. The level of GDP in 2010 will be some 11% below and the level of GNP some 15% below their respective levels of 2007 in real terms. Employment has fallen by about 13% from its peak of 2007 while the unemployment rate has risen from 4.6% to 13.5%. A downturn of this size is without precedent in Ireland’s recorded economic history and has few modern parallels at an international level. It follows annual average growth of 7.3% and 6.6% in GDP and GNP respectively, and a cumulative increase of over 900,000 of the numbers at work, between 1994 and 2007. 
The recession was due in part to the effects of a steep economic downturn in our main trading partners and a deep global financial crisis. But it was exacerbated by the collapse of the domestic property market and construction industry and the associated banking crisis at home. As such, the 
14
severity of the recession may be attributed to the combination of excessive credit expansion, rapid property price inflation and disproportionate growth in construction output in the earlier 2000s. 
The crisis has had a severe impact on the public finances. Tax receipts in 2010 will be around 33% lower than in 2007, the steepness of the fall reflecting the over-dependence on property and construction-related revenue sources during the boom years. At the same time, net current spending has continued to rise because of the upward pressure exerted by a much increased Live Register, a mounting debt interest burden and falling receipts from sources such as PRSI. As a result, the public finances have deteriorated rapidly and a structural gap between spending and revenue has opened up which will not be closed by a cyclical recovery in the economy (see Annex 1). 
Recent data suggest that economic recovery is slowly taking shape. It is now expected that GDP will record a very small increase this year on the back of strong export growth. Exports in turn are being driven by improvements in competitiveness and a strengthening of international markets. Conditions in the labour market are also beginning to stabilise as indicated by the flattening of the unemployment rate and recent declines in the monthly Live Register. However, domestic demand remains weak as households and businesses continue to repair their balance sheets following a period of excessive debt accumulation. 
1.1.2 
Budgetary Outlook for 2010 
Introduction 
In early November, the Department of Finance published an Information Note on the economic and budgetary outlook, based on detailed technical analysis and containing an assessment of future economic conditions. Further information on the economic and budgetary outlook can be found in that Note which is available on the Department’s website at www.finance.gov.ie. Additional economic data, including a comparison of the Department’s forecasts with those of other organisations, a discussion of risks, and sensitivity analysis associated with this Plan are set out in Annex 2. 
The Budget Deficit 
The latest Exchequer figures indicate that the Government will achieve its objective of stabilising the underlying budget deficit in 2010. Net voted current expenditure was €37.2 billion for the period January to October 2010, 2.7% below profile. Tax receipts for the same period amounted to €24.7 billion or 1% above profile. November will be a key month for tax receipts. However, tax revenue for the year as a whole is currently expected to amount to €31.5 billion, some €450 million above the level forecast in last December’s Budget. 
Taking account of the likely evolution of Government spending in the final months of the year, and excluding the impact of the bank support measures, the General Government deficit in 2010 is now expected to be 11.7% of GDP, in line with the Budget 2010 target of 11.6%. 
15
Public Debt 
Due to the strong performance of the economy through much of the 1990s and early 2000s, debt ratios fell dramatically. As a result, the General Government Gross Debt to GDP ratio had fallen to just 25% by end-2007. The underlying position was even stronger at that point: the net debt to GDP ratio was just 14%. 
By end-2009 however, reflecting the large deficits recorded in the intervening period, and other factors, General Government Gross Debt had reached 66% of GDP. It is currently estimated that the ratio will be 95% of GDP at end-2010. The main reason for the very large increase this year is that the capital support – some €31 billion – being provided to a number of institutions within the banking sector in 2010 is classified within the General Government Gross Debt measure. When account is taken of the value of assets in the National Pensions Reserve Fund (NPRF) and of Exchequer cash balances, the position is a good deal more favourable. The net debt measure that results from these adjustments is estimated at 69% of GDP at the end of 2010. 
1.2 Budgetary Adjustment 
1.2.1 Rationale for Adjustment 
In money terms, the gap between Government receipts and spending will come to almost €19 billion in 2010. This gap simply must be closed. Government has already taken significant actions to prevent the gap from widening. Table 1.1 shows the adjustments to expenditure and revenue, amounting to a cumulative €14.6 billion, already implemented between July 2008 and Budget 2010 in pursuit of this objective. 
Despite the scale of the adjustment, a very large and unsustainable gap remains between spending and revenues, which is filled by borrowing. 
Table 1.1 Budgetary Adjustments since mid-2008 – planned budgetary impact upon 2010 
€ billion 
July 2008 
Expenditure Adjustments 
1.0 
Budget 2009 (October 2008) 
Revenue raising measures 
2.0 
February 2009* 
Expenditure Adjustments 
2.1 
Supplementary Budget (April 2009) 
Revenue-raising & expenditure-reducing measures 
5.4 
Budget 2010 (December 2009) 
Expenditure-reducing & minor revenue-raising measures 
4.1 
Total 
€14.6bn 
*Postponement of the pay increases contained in the ‘Towards 2016’ agreement generated another €1 billion in full year savings 
The current level of borrowing is unsustainable. Unless it is reduced, the burden of debt service will absorb a rapidly increasing proportion of tax revenue, even assuming no upward pressure on interest 
16
rates. More pertinently, as recent developments in the international bond markets have shown, persisting with the current scale of borrowing will result in interest rates remaining at unaffordable levels. Moving towards a balanced budget therefore is a prerequisite for future economic growth. Tackling the deficit now is essential in order to engender international confidence in our ability to meet our commitments. 
1.2.2 Scale of adjustment required 
Ireland’s membership of the eurozone obliges us to adhere to the Stability and Growth Pact and bring the General Government deficit back below 3% of GDP. Budget 2010 assumed an adjustment package of €7.5 billion over a four-year period would be required to reach this target by 2014, the target year agreed with our European partners. It is now estimated that an adjustment of some €15 billion will be necessary to reach this target. 
Figure 1.1 Public Finances 2004-2014 -20-100102030405020042005200620072008200920102011201220132014Year % of GDP Underlying General Government Balance (% of GDP)General Government Revenue (% of GDP)General Government Expenditure (% of GDP) 
Reasons for the increase in the size of the budgetary adjustment required 
ƒ 
The economy is smaller, reflecting CSO revisions to the level of GDP in 2009 and previous years. 
ƒ 
The repair of household and company balance sheets after the damage caused by the bursting of the property bubble will dampen consumer and investment spending to a greater extent than previously thought. 
ƒ 
The level of prices in the economy is now forecast to rise more sluggishly than previously expected as economic activity generally is more muted. 
ƒ 
The impact of the Promissory Notes issued to Anglo Irish Bank, INBS and EBS, means that in order to achieve the budgetary targets by 2014 compensatory measures must be taken over the period 2011 to 2014. These costs will amount to an estimated €2.4 billion in 2014 and, if not addressed, would add about 1.3% to the deficit figure in that year. 
ƒ 
All of these factors suggest that the outlook for growth, both real and nominal, is less favourable than a year ago. This means having to adjust more and in so doing there is an additional negative impact on the economy. 17
1.2.3 
The Composition of the Budgetary Adjustment 
It is clear that an adjustment of the magnitude required cannot be achieved by exclusive reliance on either tax increases or expenditure cuts. If taxes were raised by €15 billion over the next four years, the burden of taxation would increase to the point where competitiveness was hugely impaired and the economy’s capacity to generate growth in output and employment seriously damaged. Conversely, if the entire burden of the €15 billion reduction were to fall on Government spending, the impact on public services and social welfare provision would be unacceptable. 
It follows that the adjustments to be made must comprise a mix of revenue-raising and expenditure- reducing measures. In determining the appropriate balance between the two, the Government has been guided by the lessons of our past as well as the experience of other countries that have found themselves in similar circumstances. The international evidence, analysed by organisations such as the IMF, the EU Commission and the OECD, suggests that budgetary adjustments are more successful in reducing deficits and stabilising debt ratios when they rely more on reducing expenditure than increasing taxes. 
This is consistent with our own experience of the late 1980s. The unsuccessful attempts at restoring order to the public finances in the early part of that decade leaned heavily on tax increases, while the successful budgetary adjustment of the late 1980s relied more on controlling expenditure and, insofar as it included tax measures, concentrated on widening the base rather than increasing rates of tax. 
Of the €14.6 billion of budgetary adjustments that have already been undertaken since 2008 just under two-thirds have fallen on the expenditure side with the remainder comprising revenue-raising measures. Similar proportions will apply to the adjustments planned for the next four years: of the €15 billion overall adjustment to be made, €10 billion will be composed of expenditure reductions and €5 billion will comprise revenue-raising measures. Drawing on the experience of the 1980s, the proposed revenue-raising measures will concentrate on broadening the base as part of the reform of the tax system that was signalled in Budget 2010. 
The effect of the adjustment will be to raise the overall ratio of tax (including receipts from PRSI, the Health Levy and the National Training Fund Levy) to GDP by about 3% points between 2010 and 2014. This will still leave the ratio slightly below the level it was at in the late 1990s, a period during which the economy last experienced balanced export-led growth. 
Table 1.2 below shows the General Government Deficits in each of the years 2011-2014, arising out of an overall adjustment package of €15 billion. Achieving these budget targets is predicated on implementing the expenditure and taxation adjustments set out later in this document. Chapters 3 to 5 detail the required current and capital expenditure adjustments on a sector by sector basis. Chapter 6 sets out the individual revenue-raising measures which are necessary to generate an additional €5 billion in revenue. 
18
Table 1.2 – Forecast General Government Deficits and end-year Gross Debt Levels 
2011 
2012 
2013 
2014 
General Government Deficit (% of GDP) 
9.1% 
7.0% 
5.5% 
2.8% 
Total Consolidation2 (Full-Year Impacts) 
€6.0bn 
€3.6bn 
€3.1bn 
€3.1bn 
ƒ 
Expenditure 
€3.9bn 
€2.1bn 
€2.0bn 
€2.0bn 
o 
Current 
€2.1bn 
€1.7bn 
€1.6bn 
€1.6bn 
o 
Capital 
€1.8bn 
€0.4bn 
€0.4bn 
€0.4bn 
ƒ 
Taxation 
€1.4bn 
€1.5bn 
€1.1bn 
€1.1bn 
ƒ 
Other 
€0.7bn 
General Government Gross Debt (% of GDP) 
100% 
101% 
102% 
100% 
Rounding may affect totals 
Implementing a package of budgetary adjustments totalling €15 billion over the next four years in the manner outlined above and a gradual unwinding of Exchequer cash balances is expected to result in the General Government Gross Debt peaking in 2013 at 102% of GDP before falling to 100% of GDP by 2014. 
The stabilisation and subsequent reduction of the ratio of debt to GDP is dependent, among other things, on the growth rate of nominal GDP and the average interest rate on the debt. The sensitivity of the ratio to these variables is explored in Annex 3. 
1.3 Achieving Economic Recovery 
1.3.1 Growth in an Open Regional Economy 
Ireland is an open regional economy. Its openness is most obvious in terms of the importance of international trade: exports and imports of goods and services are equal to 175% of GDP. But there are other dimensions of Ireland’s openness that are no less significant. One is its dependence on international capital flows, including flows of foreign direct investment from abroad. Another is the elasticity of its labour supply: the capacity for its labour force to be augmented by immigration and depleted by emigration. 
Ireland’s openness means that the economy here interacts widely and deeply with the rest of the world and is sensitive to changes in world economic conditions, while its size means that the domestic market is too small to provide the basis for long run sustainable growth. Long term growth in a small open economy therefore is a function of the export base, the collection of enterprises that are involved in the production of goods and services for international markets. 
2 Total consolidation sums to more than €15 billion in Table 1.2 due to inclusion of non-recurring once-off items that impact in 2011 only. The full year impacts of expenditure and revenue measures are taken into account in the figures. 
19
The enterprises that make up these internationally trading sectors generate output and employment directly, but they also generate output and employment indirectly in Ireland through their demand for buildings, machinery, components, raw materials and a wide range of service inputs. On top of that, the internationally trading sector together with the local firms that supply it, create a multiplier effect throughout the wider economy, as the people employed in these sectors spend their wages and salaries. 
The vitality and dynamism of the Irish economy therefore depends ultimately on the vitality and dynamism of its internationally trading sector. This, in turn, depends on the competitiveness of the enterprises that go to make up the sector, that is, on their ability to win, retain and expand their share of the international markets which they serve. It also depends on Ireland’s attractiveness as a location for the establishment of new exporting activities. 
Long-term sustainable growth in the Irish economy is export-led. This is not to say that domestic demand is unimportant. On the contrary, balanced economic growth is attained when consumption and investment, as well as exports, are expanding at a healthy pace. Indeed, strong gains in employment typically require solid growth in domestic demand. This is because the sectors that serve domestic demand, like retailing and construction, tend to be more labour intensive than the exporting sectors. There are notable exceptions to this pattern. Tourism, for example, is an important exporting sector that is relatively labour intensive. 
In their recent analysis of the causes of the swift reversal of our economic fortunes, Klaus Regling and Max Watson3 conclude that in the period leading up to the current crisis, the share of construction sector in the economy became excessive and as our competitiveness deteriorated significantly, Ireland lost market shares in international trade. At the height of the building boom in 2007, the construction sector directly accounted for 13% of total employment, compared with an average of just over 7% for the 1990s. The appetite of a rampant building industry for labour and other resources put upward pressure on the economy’s cost structure and contributed to the deterioration in the competitiveness of the internationally trading sectors. 
The Irish economy did enjoy sustained balanced export-led growth as recently as the 1990s. Between 1993 and 2000, exports expanded at almost 18% per annum, driving average annual GDP growth of 9%, a cumulative increase of half-a-million people in employment, a cumulative rise in living standards of about 80%, and all in the context of maintaining a healthy balance of payments position and achieving a substantial government budget surplus. 
The formula for achieving the kind of balanced sustainable growth in output and employment that is appropriate to a small open economy, therefore, is not elusive. We discovered and applied that formula in the 1990s and we can do so again. 
3 A Preliminary Report on the Sources of Ireland’s Banking Crisis by Klaus Regling and Max Watson – Published May 2010. 
20
1.3.2 Economic Policy Principles 
Although Government has only a marginal presence in the production of internationally traded goods and services, it plays a vital part in creating the conditions in which the sector can grow and prosper. Equally important, Government is responsible for creating an environment that makes Ireland an attractive place in which to live and work. 
The most important of these conditions and the one for which the Government has the clearest and most direct responsibility is sound public finances. Unsustainable public finances undermine the framework for economic prosperity through at least three channels: (i) the upward pressure on interest rates and the consequent increase in the price of credit; (ii) the uncertainty created about the future course of taxes and the continued provision of essential public services, and (iii) the reputational damage to the country and its institutions. The restoration of sound public finances must be the cornerstone of any economic plan. 
The measures taken to restore sound public finances must observe certain principles and must have regard to the nature of the Irish economy. A key principle is that the measures be fair and be seen to be fair in order to maintain the highest degree of social cohesion. In deciding on the measures to be taken to restore sustainability to the public finances, the government has attempted to spread the burden of adjustment as equitably as possible. 
Over the past two years, the combination of tax and social welfare changes has reflected that spirit of fairness. Analysis of the distributive impact4 shows that the net impact of these changes has been progressive, with higher income groups carrying a larger burden than those on modest incomes. In real terms, the reduction in the cost of living has also helped to maintain living standards. 
A number of other considerations have informed the Government’s approach to framing the budgetary measures and the broader economic policy initiatives detailed later in this Plan: 
ƒ 
The need to boost competitiveness. This has, for example, influenced the composition of budgetary adjustment as between spending and revenue-raising and the emphasis in raising revenue on widening the base rather than raising tax rates. 
ƒ 
The need to enhance the economy’s productive capacity. The government has sought to make the bulk of the necessary spending reductions on the current side. In doing so it has ensured that sufficient funds are available to press ahead with key infrastructural projects and to maintain high levels of spending on education. 
ƒ 
The need to take a long-term view. At the core of our fiscal problem is a large structural deficit, the measures to eliminate which have to be structural in nature. These measures must be permanent in their impact and selected on the grounds of their appropriateness over the medium to long run. Charting our way out of our current difficulties requires long-term 
4 Carried out by the Social Inclusion Unit in the then Department of Social and Family Affairs. 
21
planning. The proposals for reform of the budgetary process, outlined in Chapter 3, are intended to create a framework in which fiscal policy decisions are informed by a medium to long-term perspective. 
ƒ 
The need for credibility. This Plan must be credible, both to Irish citizens and to international markets. To that end, the Plan is based on a set of economic forecasts which the Government believes to be prudent, and sets out the policy measures which it is proposed to take at a level of detail designed to dispel uncertainty to the greatest degree possible. 
1.3.3 Strategy for growth 
Figure 1.2 illustrates the anticipated path to economic recovery set out in this chapter. The process of recovery is founded on a number of essential conditions – which are either in place, or are being pursued actively - coupled with a range of specific policy actions detailed in Chapter 2. These measures will assist export recovery through enhanced competitiveness and sector-specific initiatives. Export growth will in turn deliver high value employment and act to stimulate the domestically trading sectors of the economy. The measures contained in Chapter 2 will also directly assist in job creation in the local economy by removing barriers to employment and disincentives to work. These developments will in turn boost consumption and, over time, reduce unemployment and lead to further employment gains. 
Figure 1.2 Summary Steps to Economic Recovery Consumption improves Exports recover 1. Horizontal Measures (a) Labour market reform (b) Steps to reduce costs (c) Public administration improvements 2. Specific sectoral initiatives Employmentgains, tax revenue increases, unemployment falls Credit availability Infrastructure Human Cap Favourable Taxation Sustainable public finances Employment increases Unemployment stabilises Essential conditions Anticipated outcomes Policies for growth 22
Restoring competitiveness and retuning sectoral policy to grow exports and assist locally trading firms is the necessary first step on the path to economic recovery. This is Government’s core strategy for tackling unemployment. 
1.3.4 Essential Conditions for Growth 
Our experience shows that economic growth and sustainable jobs are generated by the private sector in the main. But Government plays an important role in creating the framework conditions to enable growth. The budgetary adjustment measures set out in this Plan can deliver sustainable public finances. Other essential inputs from Government include: 
ƒ 
the provision of appropriate economic and social infrastructure; 
ƒ 
investment in human capital; 
ƒ 
ensuring adequate credit availability; and 
ƒ 
tax polices which are favourable to entrepreneurship, investment and work. 
Across these areas, conditions for growth are either already in place, or policies to achieve them are being pursued. 
Essential Conditions for Growth 
Physical infrastructure 
Improvements to our stock of economic and social infrastructure over the past decade or so are a visible legacy of the economic expansion of that period. In the years between 1997 and 2007 annual public capital allocations were quadrupled. This investment expanded capacity across a range of sectors and addressed the infrastructure deficit that had previously constrained the Irish economy. 
The current stock of infrastructure, which will be augmented by a substantial ongoing programme of public investment over the next four years, leaves the economy well-equipped to return to export-led growth. 
Capital investment will continue to support employment by providing a significant level of direct job supports to IDA Ireland and Enterprise Ireland. These supports will be maintained so that the Government will offer considerable direct assistance to the enterprise sector alongside measures to improve competitiveness. 
Available human capital 
As with the stock of physical infrastructure, the quality of Ireland’s human capital puts us in a strong position for a return to economic growth. 
The country continues to have a skilled and flexible labour force whose educational profile displays a number of 2positive characteristics. The 25-34 year old age cohort, for example, has a higher level of formal qualification than the OECD average, while the proportion of the population aged 20-24 with at least an upper second-level education is the highest in the EU15 (see figure 1.3) 
Amongst those who have become unemployed a large number have significant levels of skill and experience and a history of achievement across a range of sectors. 
Credit availability for business 
An overriding objective of the Government’s banking policy is to ensure that viable businesses, especially Small and Medium Enterprises (SMEs), can access the credit they need. To this end a Code of Conduct on SME Lending was introduced for the first time last year. The Code requires banks to deal fairly and transparently with their business customers. In addition, the Credit Review Office (CRO), set up under the NAMA legislation, provides a review mechanism for SMEs who have had credit refused, withdrawn, or offered on unreasonable conditions. In his latest quarterly report, Mr. John Trethowan of the CRO notes that the lending situation for SMEs is improving and that the recapitalisation strategy for the two largest banks (Bank of Ireland and Allied Irish Bank) is achieving its objective. 23
Favourable taxation 
The tax burden in Ireland is relatively low and will remain so even after the revenue-raising measures contained in this Plan have been implemented. 
A key feature of the tax system is the 12½% corporation tax regime which represents an essential pillar of enterprise policy. Other important aspects of the corporation tax framework include: the R&D tax credit; the holding company tax regime and Ireland’s rapidly expanding network of double taxation agreements. 
Figure 1.3 Proportion of population with at least upper second level education 505560657075808590 PortugalSpainDenmarkGermany euro area ItalyNetherlandsLuxembourg EU27United KingdomGreeceBelgiumFranceFinlandAustriaSwedenIreland% of pop aged 20 - 24 
Source: Eurostat 
1.3.5 Retuning Policies for Growth 
Actions have been taken on all the essential conditions for growth but a number of critical reforms will further boost economic activity. These can be broadly categorised as follows: 
ƒ 
Labour market reforms to remove barriers to employment and disincentives to work; 
ƒ 
Reforms to improve the non-labour elements of cost competitiveness; and 
ƒ 
Supportive sectoral policies to assist recovery across the enterprise base. 
These structural reforms to bolster the private sector are presented in detail in Chapter 2. Over the medium-term they will be complemented by reforms to the operation of the public service, discussed in Chapter 4. The associated policy actions represent a coherent Government strategy for creating the conditions that will foster the resumption of growth in output and employment. 
1.4 The Economic Outlook, 2011-2014 
1.4.1 
Output and Employment 
After two years of extremely sharp declines in output, the Irish economy, as noted above, is expected broadly to stabilise this year before expanding over the period 2011 to 2014. Consistent with the typical recovery path in a small open economy, the stabilisation and initial strengthening will be primarily driven by a recovery in exports. The recent performance of exports has been encouraging and it is now estimated that they will grow by about 6¼% in real terms in 2010. In 2011, there may be some slowdown, reflecting the moderation of the pace of recovery in our main trading partners, 
24
but taking the 2011-2014 period as a whole, exports can be expected to increase at a healthy pace as the competitiveness of Irish producers improves further and demand continues to grow in our overseas markets. 
Table 1.3 Medium term economic outlook 
(% change unless otherwise stated) 
2011 
2012 
2013 
2014 
GDP real 
1¾ 
3¼ 
3 
2¾ 
GDP level ^ (€m) 
161,200 
168,100 
175,400 
183,500 
GNP real 
1 
2½ 
2½ 
2½ 
GNP level ^ (€m) 
127,900 
132,500 
137,600 
143,400 
components of real GDP 
Domestic demand 
- consumption 
0 
1 
1½ 
1¾ 
- government 
-3 
-2 
-2¼ 
-2 
- investment 
-6 
5¼ 
5 
5¼ 
Trade and external account 
- exports 
5 
5 
4½ 
4 
- imports 
2¾ 
3 
3¼ 
3 
- BOP current account (% GNP) 
¼ 
1½ 
2½ 
3½ 
price developments 
HICP 
¾ 
1 
1¾ 
1¾ 
GDP deflator 
¾ 
1 
1¼ 
1½ 
labour market 
Employment 
-¼ 
1¼ 
1½ 
1¾ 
Unemployment (%) 
13¼ 
12 
11 
9¾ 
Source: Department of Finance forecast 
^ Figures are rounded to the nearest €100 million 
As a healthy export performance filters through to investment and consumption, the recovery in economic activity should become more broadly-based. However, domestic demand is likely to respond sluggishly. Household finances have been significantly affected by house and other asset price declines in recent years and, while the unemployment rate is now stabilising, it is doing so at a high level and will take some time to decline. Households have entered a period of debt reduction. This in turn has reduced the amount of disposable income available for consumption and will continue to do so for some time to come. In these circumstances, the household savings rate will likely remain above its historical average, although it is expected to fall over the period of the Plan, as the crisis recedes, consumer confidence returns and labour market conditions improve. 
In these circumstances, real consumer spending is expected to be flat in 2011 before expanding modestly, at an annual average rate of around 1½% in the period 2012 to 2014. Some of the factors restraining consumer spending – in particular the need to repair balance sheets – are also likely to restrain investment spending by firms in the period ahead. Taken together with the outlook for public capital spending, this indicates that overall investment spending will provide limited support to domestic demand. A 6% fall is expected in 2011, followed by average annual growth of about 5% over the following three years. 
25
Real GDP is forecast to increase by an average of almost 2¾% in the years 2011 to 2014, with real GNP growing by an average of just over 2% over this period. Growth in 2011 however will be considerably below the average for the period as a whole. This moderate expansion in output is expected to be accompanied by the resumption of employment growth, starting in 2012 and averaging about 1½% a year between 2012 and 2014, generating a cumulative increase of about 90,000 over this period. This is consistent with a steady decline in the unemployment rate which is expected to have fallen below 10% by 2014. 
Reflecting the moderate pace of output growth, the amount of spare capacity in the economy and the likelihood that external pressures on prices will be modest, low rates of inflation are projected. Consumer price inflation should be contained at less than 1% in 2011 and is forecast to average 1½% in the years 2012 through 2014. The GDP deflator, which provides the most comprehensive measure of inflation in the economy, is expected to increase at a somewhat slower rate. Inflation, by either measure, is expected to be lower than in our main trading partners over the period of the Plan, reflecting and assisting the process of competitiveness improvement. 
This economic outlook summarised above takes account of the €15 billion budgetary adjustment package planned for 2011-2014. It also takes account of the favourable impact on output and employment expected to accrue from the proposed structural reforms to bolster labour market flexibility and cost competitiveness contained in Chapter 2. 
1.4.2 The Impact of Fiscal Consolidation in an Open Economy 
Budgetary adjustment will clearly have a negative impact on household disposable income, thereby lowering personal consumption. However, the impact of the adjustment on consumption is unlikely to be one-for-one. This reflects the current elevated level of household savings. Figures from the Central Statistics Office (CSO) put the savings rate at over 12% in 2009, and Department of Finance estimates point to a broadly similar rate for this year. Households have increased their savings for a number of reasons: uncertainty regarding future income prospects has motivated an increase in precautionary savings while the decline in net household wealth (or more precisely the ratio of net wealth to disposable income) has prompted debt deleveraging within the household sector, a phenomenon which is expected to decline over the period of the Plan. 
Budgetary adjustment can potentially play a positive role in reducing precautionary savings by creating greater certainty about the prospects for household disposable income. In particular, permanent, targeted and well-designed budgetary adjustment measures can reasonably be expected to have a favourable effect on confidence, so that the impact on consumer spending of lower disposable income may be partly offset by a decline in the savings rate. In relation to specific measures, as noted earlier, the available evidence suggests that reductions in current spending have a smaller negative impact on economic activity than cuts in productive capital spending or tax increases. 
26
The available evidence also indicates that, when taxes need to be raised, measures that broaden the tax base are preferable to increases in tax rates. 
The openness of the Irish economy must also be borne in mind in assessing the effect of budgetary adjustment. In the first instance, the import content of spending in Ireland is relatively high. In other words, we import a large share of what we consume. Thus, while domestic demand will clearly decline because of the budgetary adjustments that need to be made, the consequent decline in imports will mean that the impact on GDP will be significantly less than it would otherwise be. 
At the same time, the budgetary adjustment will contribute to improving the economy’s competitiveness by putting downward pressure on the domestic cost base. This will have a positive effect on export performance which will provide some measure of offset to the dampening effect of fiscal correction on overall economic activity. 
1.4.3 Savings, the Balance of Payments and the Banking System 
The current account of the balance of payments is a measure of the extent to which the economy as a whole is lending to or borrowing from the rest of the world. An important aspect of the behaviour of the Irish economy over the past few years relates to the balance of payments. Since 2008 there has been a sharp fall in the balance of payments current account deficit, which amounted to almost 6% of GDP in 2008, but which is estimated to have declined to 1.4% of GDP in 2010. What this signifies is a major reduction in the rate at which Ireland (public and private sectors together) has been borrowing from abroad. 
Given an underlying government budget deficit of 11.7% of GDP, the small current account deficit in 2010 indicates that the private sector is now running a very large financial surplus, equivalent to over 10% of GDP. This surplus reflects the combination of the steep fall in investment and the sharp increase in savings that has occurred in the recession. 
The increase in savings is especially evident in the household sector where the savings rate, according to the CSO, rose from less than 4% in 2008 to over 12% in 2009. This increase in savings has been used to rebuild household balance sheets. In part this has been achieved by the repayment of debt. Already, the value of outstanding loans to households has been reduced by about 10% from its January 2008 peak of €154 billion to €139 billion in September 2010. 
27
Figure 1.4 Balance of Payments Current Account (% of GDP) -7-6-5-4-3-2-101234 19981999200020012002200320042005200620072008200920102011201220132014 Years % of GDP 
The forecasts underpinning this Plan envisage the current account of the balance of payments recording a small surplus in 2011, and see that surplus growing steadily over the period to 2014, by which time it is expected to reach 2.7% of GDP. The budgetary programme is targeting a decline in the Government’s budget deficit from 9.1% to 2.8% of GDP over the same period. This combination of current account surpluses and substantial (though declining) budget deficits implies the continuation of a large private sector financial surplus throughout the period of the Plan. 
Much of this accumulation of financial surplus by the private sector will take the form of increased deposits with and reduced borrowing from domestic banks. The result will be a very substantial fall in the loan-to-deposit ratio of the domestic banking system and a corresponding reduction in the domestic banks’ reliance on external sources of funding. 
28
Chapter 2 Strategy for Competitiveness, Growth and Employment 
Key Messages 
ƒ 
Export led growth will fuel domestic recovery. 
ƒ 
Policy will foster the considerable growth potential of the Irish economy. 
ƒ 
Cost competitiveness will be improved through a series of specific measures in the waste, energy, transport, telecommunications, professional services and public administration sectors. 
ƒ 
Barriers to employment creation will be removed. 
o 
The level of the National Minimum Wage will be reduced by €1 an hour. 
o 
The Minister for Enterprise, Trade and Innovation will complete a review to eliminate anomalies in the framework REA and ERO agreements within three months. 
ƒ 
Welfare and labour market policies will be overhauled so that work is rewarded and those seeking work have a pathway to work, education and training. 
2.1 Overview – the Strategy for Economic Recovery 
Competitiveness is the key to a return to economic growth and a resumption of sustainable employment creation. We have made progress over the last two years. But more needs to be done. This means reducing costs and improving productivity in all sectors. 
The job of Government is to support the private sector by removing structural impediments to competitiveness and employment creation and securing the conditions for growth. But the Government must also pursue appropriate sectoral policies to foster export growth and a recovery of domestic demand. This Chapter sets out the key reforms in each of these important areas. 
For a regional, open economy such as ours, sustained export growth will be a critical step on the path to economic recovery. Labour market reform and competitiveness measures in this Plan will assist this process and will help foster employment creation in domestically trading sectors such as retail and hospitality. 
The prospects for a return to enterprise-led growth are improved by the modern nature of Ireland’s export base as illustrated in Figure 2.1. The high proportion of exports from high-tech sectors5 indicates that the Irish economy has already established a strong base which can act as a platform for further advancement to a more knowledge intensive period of growth. 
5 It should be noted that high-tech sectors may include manufacturing activities with low tech processes. Nonetheless the graph is a useful indicator of the comparative modernity of Ireland’s export base. 29
Figure 2.1 High-tech exports as a proportion of total 0102030405060 PolandBulgariaRomaniaLatviaLithuaniaSloveniaSpainSlovakiaGreeceItalyBelgiumPortugalEstoniaAustriaCzech RepublicDenmarkSwedenGermany EU27FranceFinlandNetherlandsHungaryCyprusUKIrelandLuxembourgMaltaper cent of total 
Source: Eurostat 
Enterprise Policy – Driving the Smart Economy Agenda 
Alongside the sector specific policy supports set out in section 2.5, a number of cross-cutting issues relevant to enterprise policy warrant some discussion. 
This Plan builds on, and is consistent with, Building Ireland’s Smart Economy, the framework for sustainable economic recovery published in December 2008. This framework identified five action areas as the basis for the Government’s response to the crisis: 
ƒ 
securing the enterprise economy and restoring competitiveness; 
ƒ 
building the Ideas Economy; 
ƒ 
enhancing the environment and securing energy supplies; 
ƒ 
investing in critical infrastructure; and 
ƒ 
providing efficient and effective public services and smart regulation. 
It placed particular emphasis on increasing productivity across all sectors of the economy as the basis for sustainable improvements in living standards. It also stressed the role of knowledge and innovation in driving productivity. 
The Government has acted in all these areas to tackle short-term difficulties while laying the basis for future recovery. It has 
ƒ 
introduced supports for business, through short term measures such as the Enterprise Stabilisation Fund and the Employment Subsidy Scheme, while ensuring large gains in international competitiveness; 
ƒ 
begun to re-position Ireland as a Global Innovation Hub based on the work of the Innovation Taskforce, particularly through the establishment of Innovation Fund Ireland; 
ƒ 
sustained high levels of capital investment to support economic activity during the last two years, completed the inter-urban motorways and delivered new projects at reduced cost; and 
ƒ 
provided funding for R&D and commercialisation and for renewable energy including ocean energy and biomass. 
30
The Government recently launched a new strategy – Trading and Investing in a Smart Economy – to integrate the promotion of overseas trade, tourism and investment. This strategy sets out cross- sectoral priorities and targets, and a series of recommended actions that will ensure our trade, tourism and investment sectors are well positioned to respond effectively to emerging opportunities as the global economy recovers. The strategy focuses on specific sectors and markets and is expected to deliver 150,000 direct and 150,000 indirect new jobs. We have also set ambitious targets for new FDI investments, tourist numbers and exports. 
The selected sectors include services, tourism, food, education, life sciences, software, Next Generation Network-enabled sectors, green technology, construction and the built environment, creativity and design, and technologies for an ageing population (‘silver technologies’). 
Britain and the United States will continue to be our key markets. But there is considerable potential to expand business with our Euro area partners, as well as in new and high potential growth markets such as Brazil, China, India, Russia, Japan, and the Gulf States. 
Positioning Ireland’s brand and reputation in new growth markets and reinforcing positive messages about our brand and reputation in existing markets will support broadly based export-led economic recovery. 
2.2 Restoring Cost Competitiveness 
Data on prices, costs and productivity point to a sustained improvement in competitiveness over 2009 and 2010. The fall in the euro exchange rate against the dollar and sterling in the first half of 2010, and lower inflation in Ireland has assisted export performance6. But improvements have been slower to materialise in some areas, principally in the locally trading sector of the economy. Table 2.1 shows our ranking in a selection of key competitiveness indicators. 
Table 2.1 Selected cost competitiveness indicators 
Cost category 
Rank among countries benchmarked 
Large energy user prices 
6th / 14 
Waste disposal costs 
9th / 9 
Water costs for industrial users 
10th / 16 
Mobile telephone costs (high usage) 
5th / 13 
Broadband low speeds (< 2mbps) 
6th/24 
Broadband medium speeds (2-12mbps) 
11th/29 
Broadband high speeds (12-32mbps) 
10th/29 
Prime industrial rental 
11th / 13 
Prime office space rental 
8th / 13 
Source: National Competitiveness Council, Eurostat and OECD 
6 Central Bank (2010) Quarterly Economic Bulletin. Q4. 31
A number of areas require further action in order to boost competitiveness. 
2.2.1 Waste, Energy and Transport 
There has been a significant reduction in the cost of electricity for large users. For large energy users we are sixth cheapest out of 14 countries benchmarked. For SMEs we are now close to the EU average. A rebate of network charges to large energy users, combined with falling fuel prices and the development of renewable energy assisted this process. The Energy Regulator has taken steps to achieve efficiencies in network investment and operations. This has been matched by Government policy actions including the introduction this year of a carbon windfall levy on generators. The full opening up to competition of the supply and generation markets can be expected to have a positive impact on prices. Government will also take further actions. 
Action Points 
ƒ 
The Commission for Energy Regulation will continue to impose rigorous efficiency targets on the ESB, Bord Gáis and Eirgrid to drive efficiencies in the energy sector. 
ƒ 
Capital investment programmes by the utility companies will be commensurate with the infrastructure needs and energy demand of the Irish economy avoiding excess capacity and extra cost. 
ƒ 
The National Energy Efficiency Action Plan will be implemented in order to achieve a national energy saving of 20% by 20207 including measures to assist SMEs to lower electricity costs. 
When it comes to waste management costs and treatment options, Ireland needs to improve its performance. 
Action Points 
ƒ 
Major waste infrastructure will continue to be developed primarily by the private sector while public investment in recycling infrastructure will be maintained - both elements will expand capacity and assist competitiveness. 
ƒ 
Levies will be used to drive waste modernisation in accordance with a sustainable waste hierarchy, ensure compliance with EU legislation and create a revenue stream for investment in support of waste policy objectives and enforcement. 
ƒ 
Government will ensure greater competition for public transport routes following the establishment of the National Transport Authority. This will have further positive effects on competitiveness. 
7 The Action Plan sets out a range of measures for achieving this saving including the National Retrofit Programme, supports to business for energy efficient technologies, a targeted energy reduction of 33% in the public service and the development of electric vehicles. 
32
2.2.2 Telecommunications 
Ireland compares favourably on international telephone costs and high use mobile packages as well as low speed broadband. Over the past three years internet subscriptions have trebled and broadband speeds have doubled. However the economic importance of this area demands continued progress and further improvements in quality and reduction in cost will be needed. 
It will be important to ensure a high standard of international connectivity and to enhance the IT capacity of the network. Overall, the policy framework provides that investment in broadband infrastructure is primarily a matter for the market. State intervention is aimed at improving our digital skills, enhancing our international connectivity and addressing market failures where they exist. 
Action Points 
ƒ 
The regulatory regime will facilitate a collaborative approach to private investment. 
ƒ 
The Next Generation Broadband Taskforce will work with industry to enhance the business case for investment in NGN (Next Generation Network) delivery. 
ƒ 
Appropriate State investment will be undertaken in cases of market failure. 
ƒ 
The use of state infrastructure for the roll out of NGN networks will be maximised. 
2.2.3 Professional Services 
In general, the cost of services to businesses has fallen, but this is not uniform across all professions. Although accounting costs have fallen, the cost of legal services remains high. 
Action Points 
ƒ 
Competition in the professions will be promoted and overseen by an independent figure, reporting regularly to Government. 
ƒ 
The Government will identify further ways to tackle increases in insurance costs, building on achievements of the Personal Injuries Assessment Board. 
ƒ 
All the restrictions on appropriately trained General Practitioners who wish to hold GMS contracts will be abolished. 
ƒ 
Provide for a more structured approach to mediation in the legal system and promote further the use of Alternative Dispute Resolution taking into account recommendations of the Law Reform Commission in its Final Report 2010 on the subject. 
ƒ 
A package of measures to reduce legal costs will be implemented, including 
o 
increased use of tendering by the State; 
o 
prioritising publication and enactment of the Legal Costs Bill; and 
o 
additional proposals for legislation to reduce legal costs, drawing on the recommendations of the Legal Costs Working Group and the Competition Authority. 
o 
Provide for increased use of arbitration and mediation. 33
2.2.4 Office Space/Property 
The construction cost of prime industrial sites fell by 14% between 2008 and 2009. Notwithstanding this reduction, costs in Ireland are still among the highest benchmarked by the NCC. The same applies to industrial rental costs, though office rental costs are now relatively competitive with a reduction of 18% recorded in 2009. There is scope for further improvement in this area. 
Action Points 
ƒ 
The proposals of the Working Group on Transparency in Commercial Rent Reviews will be implemented. 
ƒ 
The Office of Public Works will lead a coordinated effort to reduce office rents by up to 15% and review the efficiency of property arrangements across the public sector. 
ƒ 
Proposals will be brought to Government for legislation to overhaul and streamline the property revaluation process. The possibility of secondment of staff from local authorities is being explored. 
2.2.5 Efficiency in Public Administration 
The Government charges for delivering services such as local government utilities and business administration. In addition, companies incur indirect costs in complying with regulations (health and safety, financial etc). Companies also incur costs in searching for business support services and in accessing similar services from multiple State providers. The Government will take specific steps to reduce the cost base for the private sector. This is part of the Public Sector Transformation programme (including the Croke Park agreement mechanisms) outlined in Chapter 4. The efficiency recommendations of the Local Government Efficiency Review Group will also play a role in streamlining administration. 
The Government will take the following steps to improve public administration for the benefit of business customers: 
Action points 
ƒ 
The 15 day prompt payment rule will be extended beyond Government Departments to the wider public sector. 
ƒ 
Over the duration of the plan, increases in government administrative charges8 will be avoided, and the scope for reductions examined where possible. 
ƒ 
The targeted 25% reduction of the regulatory burden on business will be achieved by end-2011. 
ƒ 
Local Authorities will be required to improve their efficiency, including through implementing relevant recommendations of the Local Government Efficiency Group, to reduce where possible, the level of rates charged to businesses. 
8 This excludes levies payable by entities regulated by economic regulators e.g. ComReg, Commission for Energy Regulation, Central Bank etc. 34
2.3 Removing Barriers to Employment Creation and Disincentives to Work 
The central objective of this plan is to create the conditions for growing jobs and tackling unemployment. Although productivity and efficient use of resources will be important for economic recovery, unit labour costs must also be maintained at competitive levels. Labour costs are the key element in overall cost competitiveness. Labour costs also affect the cost of other inputs to the enterprise sector and play a critical role in influencing employment levels. 
A process of adjustment is underway: in 2009 there was a 6.75% improvement in unit labour costs vis-à-vis the euro area as illustrated in Figure 2.2. 
Figure 2.2 Change in unit labour costs, 2009 -4-20246810 euro areaIrelandBelgiumGermanyGreeceSpainFranceItalyCyprusLuxembourgMaltaNetherlandsAustriaPortugalSloveniaSlovakiaFinlandper cent change 
Source EU Commission Spring 2010 Forecast 
The official unemployment rate for the second quarter of 2010 was 13.6%. The extent of the unemployment problem varies geographically with the mid western and south eastern regions registering higher unemployment rates at 16.3% and 18.1% respectively. Similarly, there are differences across sectors with the industry, construction and retail sectors recording the largest percentage decreases in employment numbers. Given the scale of the unemployment problem, any legislative and policy obstacles to job creation must be removed. The State must also act to enhance the incentives to the unemployed to take up job opportunities. This combination of State interventions in the labour market must be carried out in an integrated manner. 
2.3.1 Dismantling Barriers to Employment and Facilitating Employment Growth 
Introduced in 2000 at a rate of €5.59, the National Minimum Wage (NMW) is currently set at €8.65. It has been increased six times since its introduction and is now 55% higher than its original level. By end 2010 the consumer price index is forecast to have increased by approximately 28% since 2001. 
35
Our NMW is the second highest in absolute terms compared to other EU countries and is sixth when expressed in purchasing power terms. As a percentage of the average gross monthly earnings, Ireland has the sixth highest NMW. 
The majority of minimum wage workers are employed in textiles, retailing, hotels, restaurants and bars, and personal services. Employment in occupations covered by the NMW is typically dependant on domestic demand and is likely to be sensitive to changes in the wage rate. Given the desirability of growing employment in those sectors where significant jobs losses have occurred, and the importance of encouraging recruitment of young people in particular, the level of the minimum wage has significance beyond the numbers currently employed at that rate. 
Where a NMW is imposed at a level higher than the equilibrium wage rate, unemployment will result. Some workers will be willing to work for a wage lower than NMW but employers are restricted from providing these job opportunities. Other negative effects include: 
ƒ 
Acting as a barrier for younger9 and less skilled workers to enter the labour force and take up jobs; 
ƒ 
Preventing SME’s from adjusting wage costs downward in order to maintain viability and improve competitiveness; and 
ƒ 
Reducing the capacity of the services sector to generate additional activity and employment through lower prices for consumers. 
The NMW was introduced during a period of sustained economic growth and rapid wage increases. Our circumstances have changed dramatically in the last three years. Price levels have reduced and earnings have adjusted downwards to help to preserve jobs. A reduction in the minimum wage level – as proposed by the OECD10 - can also be expected to remove a barrier to job creation. Therefore the Government have decided to introduce legislation to reduce the rate of the minimum wage by €1 per hour, or 12% to €7.6511. 
Action point 
ƒ 
The minimum wage will be reduced by €1 to €7.65. 
The new rate will remain in the top tier of EU minimum wage rates. 
Other regulated wage levels exist in certain sectors where employers and workers reach specific agreements about pay and conditions of employment, either through Registered Employment Agreements (REA’s) or Employment Regulation Orders (ERO’s), following consideration by Joint 
9 According to CSO QNHS Quarter 2 2010, youth unemployment is 25.8% for the age group 20 to 24. 
10 OECD (2009) Economic Survey – Ireland. 
11 Proportionate reductions of 12% will also take place for minimum wage rates related to employees under 18 years of age and employees aged 18 or over in their first and second years of employment. 
36
Labour Committees. The terms in each case are protected by legislation. These agreements apply mainly to the agricultural, catering, construction and electrical contracting sectors. Pay rates are typically above the NMW and in some cases incorporate significantly higher wage levels. 
Both types of agreements constitute another form of labour market rigidity by preventing wage levels from adjusting. This in turn affects the sustainability of existing jobs and may also prevent the creation of new jobs, particularly for younger people disproportionately affected by the employment crises who form part of the labour force for these sectors. 
Consistent with a proposed reduction in the minimum wage, it is important that any barriers to employment are removed in these regulated sectors given their significance for the traded sector of the economy. There is also a need to ensure these agreements are fit-for-purpose in the current economic climate. There is a strong case for removing anomalies and obsolete provisions, so as to have a more streamlined, transparent and flexible model of wage setting. 
Three particular aspects of these arrangements have been identified as potentially problematic from a competitiveness and job creation perspective. These are: 
o 
Specific cost-increasing conditions such as pay rates for Sunday working; 
o 
Geographical divisions which can sometimes appear arbitrary; and 
o 
Inflexibility in measures for adjusting agreements in line with broader labour market developments. 
These issues must be addressed in order to assist competitiveness and employment growth in these important sectors. 
Action Point 
ƒ 
A review of the framework REA and ERO arrangements will be undertaken by the Minister for Enterprise Trade and Innovation, to be finalised within three months. 
2.3.2 Removing Disincentives to Work 
Social policy must continue to protect the most vulnerable in society and provide supports to those in unemployment. At the same time, our social protection system must not contain poverty traps and must not discourage those who are unemployed from returning to work. 
The jobseeker rate of social welfare payment almost doubled between 2001 and 2009 before being reduced in Budget 2010 to €196 per week. This rate of increase has had implications for replacement rates12 in the labour market which will also be impacted by the decision to reduce the minimum wage. 
12 The replacement rates for given income levels measures the proportion of out of work benefits received when unemployed against take home pay if in work. 
37
The persistence of high replacement rates can act as a major disincentive to work. Replacement rates of the order of 70% can be considered to be a barrier to employment. 
Analysis of estimated replacement rates for different earning levels and family types undertaken by the Department of Finance in late 2009 revealed the following findings: 
ƒ 
In general, single people face high replacement rates at the earnings level of the NMW, but the issue does not arise for higher earning single people; 
ƒ 
Couples where both are not working face high replacement rates at income levels up to the average industrial wage; 
ƒ 
Couples with children where both are not working have higher replacement rates again; and 
ƒ 
One-parent families have low replacement rates except in cases where out-of-work income is supplemented by earnings from the community employment scheme. 
Rate reductions have been introduced for new jobseeker claimants under age 25 and without child dependants. The Qualified Adult rates applicable were also reduced. These rate reductions have had a significant downward impact on replacement rates for such claimants. 
In some cases, the effects of the proposed changes to the minimum wage will be to increase replacement rates. OECD analysis has pointed to a danger that the high rate of unemployment in Ireland could be sustained owing to weaknesses in activation policy and high replacement rates for those on below average wage levels13. Therefore, there is a need to strengthen activation measures and to ensure that replacement rates are not acting as a barrier for any cohorts in unemployment. Achieving the right balance between the level of the NMW, labour legislation, social welfare rates, taxation and levels of activation is crucial to avoiding work disincentives. 
High replacement rates need not necessarily give rise to high unemployment provided there is an effective activation strategy in place. Given the current dynamics in the labour market however, high replacements rates are viewed as a disincentive to work. 
Action Points 
ƒ 
Reform of the welfare system will reduce unemployment traps by incentivising employment and discouraging a long term attachment to the social welfare system. 
ƒ 
This will assist in removing disincentives to work and will be complemented by strengthened activation measures. 
2.4 Re-orienting Activation Measures 
International evidence indicates that appropriate activation measures can increase the incentive to work, reduce the number of long term unemployed and increase aggregate employment. In particular, 
13 OECD (2009) Economic Survey of Ireland. 
38
activation measures can help ensure that those at risk of long term unemployment14 are ready to avail of employment opportunities when economic recovery takes hold. It is critical that the unemployed are equipped with relevant skills and kept close to the labour market. There is a need for appropriate upskilling or reskilling so that the labour market can access the skills it requires. 
Elements of the Government’s Activation Policy 
Increased levels of engagement with the unemployed 
ƒ 
The National Employment Action Plan15 has increased substantially the number of interviews provided for the unemployed. 
ƒ 
Group interviews for the unemployed will be held after 3 months. 
Training/work experience places 
ƒ 
Significant numbers of additional places have been provided for education, training/work experience for the unemployed since 2008. 
ƒ 
The Work Placement Programme allows for up to 2,000 individuals to participate in work for periods of up to 9 months while in receipt of social welfare payments. 
ƒ 
Allocations from the Activation Fund (€20 million) and the European Globalisation Fund were used in 2010 to provide additional options to help people back to employment. 
Increased incentives for employers to create jobs 
ƒ 
The Employers’ PRSI scheme to encourage employers to recruit people who are unemployed was introduced in July 2010. 
Increased incentives for the unemployed to progress 
ƒ 
The targeted reductions in social welfare rates introduced in recent budgets have incentivised those under 25 to participate in education, training or work. 
ƒ 
Legislation has been put in place so that receipt of benefit payments will be conditional on participation in the National Employment Action Plan. 
The Government is improving the efficiency of activation structures by streamlining the Public Employment Services. The Community Employment Scheme and the FÁS employment services are being merged with the Department of Social Protection providing a single employment service for jobseekers. This will facilitate central monitoring and control of conditionality measures. 
14 This includes former employees in declining sectors such as manufacturing and construction. 
15 The Irish National Employment Action Plan was adopted by Government in response to the European Employment Guidelines. The Plan includes a commitment to a more systematic engagement of the Employment Services with the unemployed. Implementation of this commitment commenced in September, 1998. 
39
The scale of the unemployment problem justifies the introduction of further measures to improve national activation policies as recommended by the OECD. The focus must be on the provision of structured pathways to employment for those on the Live Register. 
Action Points 
A strengthened framework of additional activation measures will include: 
ƒ 
A community work placement programme. 
ƒ 
A Skills Development and Internship Programme. 
ƒ 
Additional placements on the work placement scheme. 
ƒ 
The extension of the PRSI Employers Exemption Scheme to end-2011. 
2.5 Enterprise Policy - Investment, Exports and Sectoral Performance 
2.5.1 Sectoral Outlook 
Figure 2.3 presents data on the sectoral contributions to gross value added (GVA) in the economy and how these have changed in recent years. GVA declined sharply in the Industry (including building) category. Value added also decreased in the distribution, transport and communication and other services sectors, reflecting the reduction in domestic demand and the impact of the financial crisis. 
Figure 2.3 GVA by Sector, 2007 and 2009 010,00020,00030,00040,00050,00060,00070,00080,00090,000Agriculture, forestryand fishingIndustry (includingbuilding) Distribution, transport andcommunicationPublic administrationand defenceOther services(including rent) Gross value added, constatnt prices €m 20072009 
Source: CSO 
The largest falls occurred in 2009 when GDP decreased by 7.6%. In that year, 
ƒ 
industry and building output decreased by 7.8%; 
ƒ 
distribution, transport and communications output decreased by 9.3%; 
ƒ 
other services output decreased by 2.3%; and 
ƒ 
public administration and defence output decreased by 0.5%. 
40
Figure 2.4 presents the sectoral distribution of employment in the economy comparing data for Quarter 2 2010 and Quarter 2 2007.16 Not surprisingly, construction is the most affected sector. Encouragingly, employment increased in high value sectors such as information and communications technology and financial, insurance and real estate activities. 
Figure 2.4 Employment by sector, 2007 and 2010 050100150200250300350 Agriculture, Forestry & FishingIndustryConstructionWholesale & RetailTrade;repair of motorvehicles and motorcyclesTransportation and storageAccommodation and foodservice activitiesInformation andcommunicationFinancial, insurance andreal estate activitiesProfessional, scientific andtechnical activitiesAdministrative and supportservice activitiesPublic administration anddefence;compulsory socialsecurityEducationHuman health and socialwork activitiesOther NACE activitiespersons '000s Apr - Jun 07Apr - Jun 10 
Source: CSO 
2.5.2 Investment and Innovation 
Attracting Foreign Direct Investment (FDI) 
The attraction of FDI has driven growth in the Irish economy in the past and can do so again in the next phase of Ireland’s economic development. Foreign investment in Ireland is substantial in nature: IDA supported companies alone sustain over 135,000 jobs. Manufacturing of pharmaceuticals and medical devices, financial services and the provision of ICT and professional services are the key sectors. As noted in Chapter 1, our performance in this area has remained robust throughout the recession. Further steps can be taken to copper-fasten Ireland’s attractiveness as a location for internationally mobile investment. 
The implementation of the Government’s Trade, Tourism and Investment Strategy will encourage niche areas such as converging technologies to make Ireland a strategic base for multinational corporations (MNC’s). Government Departments will seek to form partnerships with multinational companies based in Ireland to develop, trial and roll out innovations which improve services in Ireland and can also have worldwide application. 
Supporting Indigenous Business 
Indigenous businesses, including large firms, high potential start ups and SME’s, are a major source of employment. They provide essential goods and services nationwide and are pivotal to the success of 
16 The sectoral classifications by which GVA and employment data are published do not match exactly. 41
larger enterprises. They are also successful exporters in their own right. The range of competitiveness measures and labour market reforms outlined earlier will assist these firms through these difficult times and lead ultimately to growth. A number of further steps will be taken to encourage small business development. 
Action Points 
ƒ 
The Business Expansion Scheme will be overhauled and improved. Full details are contained in Chapter 6. 
ƒ 
Enterprise agencies will work with SMEs to improve performance, productivity and competitiveness, assist them in developing exports in new and existing markets, help them to access public procurement opportunities and help firms develop a greater online presence. 
ƒ 
Core R&D supports and the innovation voucher system will continue to help small firms acquire cost-effective R&D and to move up the value-chain. 
ƒ 
The Government will investigate the potential for providing access to vacant or under-utilised public property for entrepreneurs or business start-ups to use as incubation centres. 
ƒ 
The Government is undertaking an overhaul of bankruptcy legislation. 
ƒ 
The 15 day prompt payment rule will be extended beyond Government Departments to the wider public sector. 
Making Ireland a Global Innovation Hub 
The Innovation Taskforce reported in March 2010 with recommendations to make Ireland a Global Innovation Hub. The aim is to make Ireland: 
ƒ 
The best place in Europe to turn research and knowledge into products and services; 
ƒ 
The best place in Europe to start and grow an innovative company; 
ƒ 
The best place to relocate or expand and scale an SME; and 
ƒ 
The best place in Europe for research-intensive multinationals to collaborate with each other and with clusters of small companies. 
In support of these goals, a number of important recommendations made by the innovation taskforce will be delivered. 
Action Points 
ƒ 
Innovation Fund Ireland will attract international venture capital fund managers to Ireland, making their expertise, experience and network available to our enterprises. 
ƒ 
IDA will introduce the European Accelerator Programme to attract fast growing firms to locate their European HQ in Ireland. 
42
The national recovery plan 2011 2014

More Related Content

Viewers also liked

Pwc paying-taxes-2013-full-report
Pwc paying-taxes-2013-full-reportPwc paying-taxes-2013-full-report
Pwc paying-taxes-2013-full-reportDr Lendy Spires
 
Measuring, disclosing and managing the carbon intensity of investments and in...
Measuring, disclosing and managing the carbon intensity of investments and in...Measuring, disclosing and managing the carbon intensity of investments and in...
Measuring, disclosing and managing the carbon intensity of investments and in...Dr Lendy Spires
 
Colombo declaration-on-youth-final
Colombo declaration-on-youth-finalColombo declaration-on-youth-final
Colombo declaration-on-youth-finalDr Lendy Spires
 
Reduced report acsdp aidc final report 28 02 2013 final
Reduced report acsdp aidc final report 28 02 2013 finalReduced report acsdp aidc final report 28 02 2013 final
Reduced report acsdp aidc final report 28 02 2013 finalDr Lendy Spires
 
Financing Renewable Energy in Sub-Saharan Africa
Financing Renewable Energy in Sub-Saharan AfricaFinancing Renewable Energy in Sub-Saharan Africa
Financing Renewable Energy in Sub-Saharan AfricaDr Lendy Spires
 
Afri map aprm a compilation of studies of the process in nine african counties
Afri map aprm a compilation of studies of the process in nine african countiesAfri map aprm a compilation of studies of the process in nine african counties
Afri map aprm a compilation of studies of the process in nine african countiesDr Lendy Spires
 

Viewers also liked (9)

Pwc paying-taxes-2013-full-report
Pwc paying-taxes-2013-full-reportPwc paying-taxes-2013-full-report
Pwc paying-taxes-2013-full-report
 
Measuring, disclosing and managing the carbon intensity of investments and in...
Measuring, disclosing and managing the carbon intensity of investments and in...Measuring, disclosing and managing the carbon intensity of investments and in...
Measuring, disclosing and managing the carbon intensity of investments and in...
 
Colombo declaration-on-youth-final
Colombo declaration-on-youth-finalColombo declaration-on-youth-final
Colombo declaration-on-youth-final
 
Wir2013 en
Wir2013 enWir2013 en
Wir2013 en
 
Annualreport2012(1)
Annualreport2012(1)Annualreport2012(1)
Annualreport2012(1)
 
Reduced report acsdp aidc final report 28 02 2013 final
Reduced report acsdp aidc final report 28 02 2013 finalReduced report acsdp aidc final report 28 02 2013 final
Reduced report acsdp aidc final report 28 02 2013 final
 
Financing Renewable Energy in Sub-Saharan Africa
Financing Renewable Energy in Sub-Saharan AfricaFinancing Renewable Energy in Sub-Saharan Africa
Financing Renewable Energy in Sub-Saharan Africa
 
Afri map aprm a compilation of studies of the process in nine african counties
Afri map aprm a compilation of studies of the process in nine african countiesAfri map aprm a compilation of studies of the process in nine african counties
Afri map aprm a compilation of studies of the process in nine african counties
 
Unctad oecd2014d12 en
Unctad oecd2014d12 enUnctad oecd2014d12 en
Unctad oecd2014d12 en
 

Similar to The national recovery plan 2011 2014

Convergence Programme of Hungary 2011-2015 pdf download
Convergence Programme of Hungary 2011-2015 pdf downloadConvergence Programme of Hungary 2011-2015 pdf download
Convergence Programme of Hungary 2011-2015 pdf downloadHelyi Penz
 
Policy paper Autumn Statement 2023 (HTML)
Policy paper Autumn Statement 2023 (HTML)Policy paper Autumn Statement 2023 (HTML)
Policy paper Autumn Statement 2023 (HTML)nishatislam612
 
O programa de ajustamento económico para Portugal - Décima Primeira Revisão
O programa de ajustamento económico para Portugal - Décima Primeira Revisão O programa de ajustamento económico para Portugal - Décima Primeira Revisão
O programa de ajustamento económico para Portugal - Décima Primeira Revisão Cláudio Carneiro
 
Opinion on Compliance with Deficit and Debt Targets
Opinion on Compliance with Deficit and Debt TargetsOpinion on Compliance with Deficit and Debt Targets
Opinion on Compliance with Deficit and Debt Targetsairefcomunicacion
 
20140211 mprfullreport
20140211 mprfullreport20140211 mprfullreport
20140211 mprfullreportLuis Nassif
 
Curacao Economic Outlook 2011
Curacao Economic Outlook 2011Curacao Economic Outlook 2011
Curacao Economic Outlook 2011HUBcuracao
 
2010 07-06-greece interim-review_en
2010 07-06-greece interim-review_en2010 07-06-greece interim-review_en
2010 07-06-greece interim-review_enaristos arestos
 
Hungary's National Reform Programme, pdf, download
Hungary's National Reform Programme, pdf, downloadHungary's National Reform Programme, pdf, download
Hungary's National Reform Programme, pdf, downloadHelyi Penz
 
DA is calling for a "resilience budget"
DA is calling for a "resilience budget"DA is calling for a "resilience budget"
DA is calling for a "resilience budget"SABC News
 
Stimulus and Relief Plan
Stimulus and Relief PlanStimulus and Relief Plan
Stimulus and Relief PlanArdwell Irion
 
Qe report final_web
Qe report final_webQe report final_web
Qe report final_webIFLab
 
2016 General State Budget: possible but we need more reforms to strengthen gr...
2016 General State Budget: possible but we need more reforms to strengthen gr...2016 General State Budget: possible but we need more reforms to strengthen gr...
2016 General State Budget: possible but we need more reforms to strengthen gr...Círculo de Empresarios
 
Working Paper 1/2014 30072014
Working Paper 1/2014 30072014 Working Paper 1/2014 30072014
Working Paper 1/2014 30072014 airefcomunicacion
 
20151008 The Future Book - Edition 2015 final
20151008 The Future Book - Edition 2015 final20151008 The Future Book - Edition 2015 final
20151008 The Future Book - Edition 2015 finalSarah Luheshi
 
Pre budget-submission-2014-volume-1
Pre budget-submission-2014-volume-1Pre budget-submission-2014-volume-1
Pre budget-submission-2014-volume-1Darren mccormack
 
03.2010, REPORT, Mongolia Monthly Economic Update, World Bank
03.2010, REPORT, Mongolia Monthly Economic Update, World Bank03.2010, REPORT, Mongolia Monthly Economic Update, World Bank
03.2010, REPORT, Mongolia Monthly Economic Update, World BankThe Business Council of Mongolia
 
Lettera Padoan Ue 21 novembre 2014
Lettera Padoan Ue 21 novembre 2014Lettera Padoan Ue 21 novembre 2014
Lettera Padoan Ue 21 novembre 2014ilfattoquotidiano.it
 

Similar to The national recovery plan 2011 2014 (20)

Note on relevant_factors_-_it
Note on relevant_factors_-_itNote on relevant_factors_-_it
Note on relevant_factors_-_it
 
Convergence Programme of Hungary 2011-2015 pdf download
Convergence Programme of Hungary 2011-2015 pdf downloadConvergence Programme of Hungary 2011-2015 pdf download
Convergence Programme of Hungary 2011-2015 pdf download
 
Policy paper Autumn Statement 2023 (HTML)
Policy paper Autumn Statement 2023 (HTML)Policy paper Autumn Statement 2023 (HTML)
Policy paper Autumn Statement 2023 (HTML)
 
O programa de ajustamento económico para Portugal - Décima Primeira Revisão
O programa de ajustamento económico para Portugal - Décima Primeira Revisão O programa de ajustamento económico para Portugal - Décima Primeira Revisão
O programa de ajustamento económico para Portugal - Décima Primeira Revisão
 
Opinion on Compliance with Deficit and Debt Targets
Opinion on Compliance with Deficit and Debt TargetsOpinion on Compliance with Deficit and Debt Targets
Opinion on Compliance with Deficit and Debt Targets
 
20140211 mprfullreport
20140211 mprfullreport20140211 mprfullreport
20140211 mprfullreport
 
44729769
4472976944729769
44729769
 
44729769
4472976944729769
44729769
 
Curacao Economic Outlook 2011
Curacao Economic Outlook 2011Curacao Economic Outlook 2011
Curacao Economic Outlook 2011
 
2010 07-06-greece interim-review_en
2010 07-06-greece interim-review_en2010 07-06-greece interim-review_en
2010 07-06-greece interim-review_en
 
Hungary's National Reform Programme, pdf, download
Hungary's National Reform Programme, pdf, downloadHungary's National Reform Programme, pdf, download
Hungary's National Reform Programme, pdf, download
 
DA is calling for a "resilience budget"
DA is calling for a "resilience budget"DA is calling for a "resilience budget"
DA is calling for a "resilience budget"
 
Stimulus and Relief Plan
Stimulus and Relief PlanStimulus and Relief Plan
Stimulus and Relief Plan
 
Qe report final_web
Qe report final_webQe report final_web
Qe report final_web
 
2016 General State Budget: possible but we need more reforms to strengthen gr...
2016 General State Budget: possible but we need more reforms to strengthen gr...2016 General State Budget: possible but we need more reforms to strengthen gr...
2016 General State Budget: possible but we need more reforms to strengthen gr...
 
Working Paper 1/2014 30072014
Working Paper 1/2014 30072014 Working Paper 1/2014 30072014
Working Paper 1/2014 30072014
 
20151008 The Future Book - Edition 2015 final
20151008 The Future Book - Edition 2015 final20151008 The Future Book - Edition 2015 final
20151008 The Future Book - Edition 2015 final
 
Pre budget-submission-2014-volume-1
Pre budget-submission-2014-volume-1Pre budget-submission-2014-volume-1
Pre budget-submission-2014-volume-1
 
03.2010, REPORT, Mongolia Monthly Economic Update, World Bank
03.2010, REPORT, Mongolia Monthly Economic Update, World Bank03.2010, REPORT, Mongolia Monthly Economic Update, World Bank
03.2010, REPORT, Mongolia Monthly Economic Update, World Bank
 
Lettera Padoan Ue 21 novembre 2014
Lettera Padoan Ue 21 novembre 2014Lettera Padoan Ue 21 novembre 2014
Lettera Padoan Ue 21 novembre 2014
 

The national recovery plan 2011 2014

  • 1. The National Recovery Plan 2011-2014 BAILE ÁTHA CLIATH ARNA FHOILSIÚ AG OIFIG AN tSOLÁTHAIR Le ceannach díreach ón OIFIG DHÍOLTA FOILSEACHÁN RIALTAIS, TEACH SUN ALLIANCE, SRÁID THEACH LAIGHEAN, BAILE ÁTHA CLIATH 2, nó tríd an bpost ó FOILSEACHÁIN RIALTAIS, AN RANNÓG POST-TRÁCHTA, AONAD 20 PÁIRC MIONDÍOLA COIS LOCHA, CLÁR CHLAINNE MHUIRIS, CONTAE MHAIGH EO (Teil: 01 – 6476834 nó 1890 213434; Fax 094 - 9378964 nó 01 – 6476843) nó trí aon díoltóir leabhar. __________ DUBLIN PUBLISHED BY THE STATIONERY OFFICE To be purchased directly from the GOVERNMENT PUBLICATIONS SALE OFFICE SUN ALLIANCE HOUSE, MOLESWORTH STREET, DUBLIN 2, or by mail order from GOVERNMENT PUBLICATIONS, POSTAL TRADE SECTION, UNIT 20 LAKESIDE RETAIL PARK, CLAREMORRIS, CO. MAYO (Tel: 01 – 6476834 or 1890 213434; Fax: 094 - 9378964 or 01 – 6476843) or through any bookseller. (Prn. A10/1705) Price €15.00 1
  • 2. 2
  • 3. Overview and Summary.......................................................................................................5 Chapter 1 Economic Policy...........................................................................................14 1.1 The Economy in 2010....................................................................................................14 1.2 Budgetary Adjustment...................................................................................................16 1.3 Achieving Economic Recovery.........................................................................................19 1.4 The Economic Outlook, 2011-2014..................................................................................24 Chapter 2 Strategy for Competitiveness, Growth and Employment...............................29 2.1 Overview – the Strategy for Economic Recovery...............................................................29 2.2 Restoring Cost Competitiveness......................................................................................31 2.3 Removing Barriers to Employment Creation and Disincentives to Work...............................35 2.4 Re-orienting Activation Measures....................................................................................38 2.5 Enterprise Policy - Investment, Exports and Sectoral Performance.....................................40 2.6 Conclusion: Anticipated Medium-term Outcomes..............................................................51 Chapter 3 General Expenditure Context......................................................................53 3.1 Introduction..................................................................................................................53 3.2 Why We Must Reduce Expenditure..................................................................................55 3.3 Composition of Expenditure............................................................................................57 3.4 Strategy and Principles for Expenditure Reductions 2011-2014..........................................58 3.5 Budget Reform..............................................................................................................59 Chapter 4 Current Expenditure Measures....................................................................61 4.1 Introduction..................................................................................................................61 4.2 Public Service Pay Costs.................................................................................................63 4.3 Reforming Institutions and Service Delivery.....................................................................65 4.4 Redeployment...............................................................................................................66 4.5 Public Service Transformation.........................................................................................67 4.6 Public Service Sectoral Reform........................................................................................68 4.7 Public Service Pension Reforms.......................................................................................71 4.8 Social Protection Expenditures........................................................................................74 4.9 Other Programme Expenditures......................................................................................76 4.10 Savings from Reducing the Costs of Public Administration.................................................78 4.11 Debt Interest Costs and Debt Management......................................................................80 Chapter 5 Public Capital Investment...........................................................................82 5.1 Overview......................................................................................................................82 5.2 Role of Capital Investment in the Economy......................................................................84 5.3 NPRF Approach to Infrastructure Investment...................................................................86 5.4 Investment by Commercial State Bodies..........................................................................87 Chapter 6 Taxation Measures......................................................................................89 6.1 Introduction..................................................................................................................89 6.2 Approach......................................................................................................................89 3
  • 4. 6.3 Objective......................................................................................................................90 6.4 Income Tax...................................................................................................................91 6.5 Pensions Tax Expenditures.............................................................................................93 6.6 General Tax Expenditures...............................................................................................95 6.7 Value Added Tax and Indirect Tax..................................................................................97 6.8 Financing Local Services.................................................................................................98 6.9 Carbon Tax...................................................................................................................99 6.10 Capital Taxation...........................................................................................................99 6.11 Corporation Tax..........................................................................................................100 6.12 Small and Medium Enterprises.....................................................................................101 6.13 Impact of the Main Income Tax changes......................................................................101 Annexes 1-11....................................................................................................................104 4
  • 5. Overview and Summary This Plan provides a blueprint for a return to sustainable growth in our economy. It sets out in detail the measures that will be taken to put our public finances in order. It identifies the areas of economic activity which will provide growth and employment in the next phase of our economic development. It specifies the reforms the Government will implement to accelerate growth in those key sectors. Reducing the budget deficit will not, by itself, solve our economic difficulties. We must build on our strong export performance by improving our competitiveness. We must enhance our productive capacity by maintaining investment in key infrastructure projects and in education. We must remove barriers to employment and ensure that those who have lost their jobs are retrained and are ready to take up employment as the labour market recovers. This Plan sets out the key reform measures the Government will take to return our economy to a sustainable medium-term economic growth path. The Plan will help dispel uncertainty and reinforce the confidence of consumers, businesses and of the international community. The tax and expenditure measures contained in this Plan will negatively affect the living standards of citizens in the short-term. But postponing these measures will lead to greater burdens in the future for those who can least bear them, and will jeopardise our prospects of returning to sustainable growth and full employment. Over the last two and a half years, we have responded promptly to the deterioration in the public finances. In five separate adjustment packages, savings and revenue-raising of around €14.6 billion on a full year basis have already been achieved. As a result our public finances have stabilised with an underlying deficit of 11.7% of GDP in 2010 compared with an implied uncorrected deficit of 20% of GDP. Notwithstanding the size of the adjustment, our economy has performed better this year than had been forecast at the end of 2009, with GDP growth expected to be marginally positive as opposed to a contraction of 1.3% which had been predicted this time last year. Unfortunately, lower than expected medium-term economic growth prospects as well as higher debt interest costs arising from the bank rescue have required us to revise our budgetary targets. To achieve a deficit of below 3% of GDP by 2014, the Government has concluded that an overall saving of €15 billion is required. The European Commission acknowledges that this is the appropriate target based on the growth projections we have set for the period of the Plan. 5
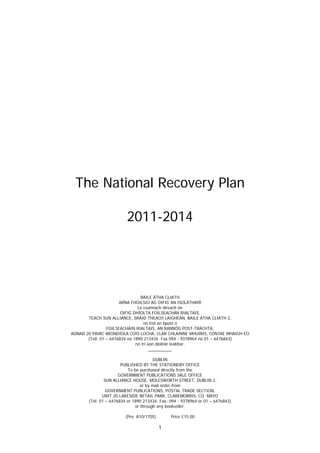
  • 6. Public Finances 2004 - 2014 0510152025303540455020042005200620072008200920102011201220132014Year % of GDP General Government Revenue (% of GDP)General Government Expenditure (% of GDP) To demonstrate the seriousness of its intent, the Government has decided that 40% or €6 billion of the €15 billion adjustment will be made in 2011. This commitment to the early delivery of the Plan will engender confidence at home and abroad that we can restore order to our public finances. The adjustment will be made up of €10 billion in spending reductions and €5 billion in tax and revenue raising measures. These are demanding but realistic targets. With a concerted national effort, they can be achieved. From the late 1990s, the benefits of our booming economy were felt across every section of the population. Working-age social welfare rates are now more than twice their rate in 2000. Over the same period, the State pension almost doubled. These increases were well ahead of the cost of living. Public service pay also increased well ahead of inflation. From 2000 to 2009 average public service salaries increased by 59%. At the same time, taxation was reduced. During the period after 2000, the entry point to income tax increased from €7,238 to €18,300 for PAYE earners and since 2000, bands have widened by 105% for the single person and married two earners. Credits have increased by 92% since their introduction in 2001. The standard and higher tax rates fell from 26% and 48% in 1997/98 to 20% and 41% by 2007. As a result of these changes, the proportion of income earners exempt from income tax increased from 34% in 2004 to an estimated 45% in 2010. It is now estimated that for the current year, 42% of income earners will pay tax at the standard rate and just 13% will be liable at the top rate. 6
  • 7. The substantial reductions in tax and increases in welfare were made possible by the very high level of property-related tax receipts taken in by the Exchequer during the boom years. The property boom also swelled VAT and other receipts. In 2007, capital taxes and stamp duty yielded €6.7 billion. This year, that figure is expected to fall to as low as €1.6 billion. In these dramatically changed circumstances, it is clear the State can no longer afford the current levels of social provision and personal taxation. The effect of the spending reductions for 2011 detailed in this plan will be to bring us back to working age social welfare rates slightly above 2007 levels. The income tax measures, outlined in Chapter 6, will bring us back to levels prevalent as recently as 2006. The major drivers of public spending are Public Service Pay and Pensions; Social Welfare and Public Service programme spending; and Public Investment. Gross Voted Public Spending 201027% 24% 26% 5% 7% 11% Working age social expendituresProgramme expendituresPublic service payPublic sector pensionsSocial welfare pensionsInvestment The bulk of the savings we must achieve will have to come from these categories. The Government is determined to eliminate waste and make maximum savings from efficiencies. But it is simply not credible to suggest that our public finance difficulties can be resolved without impacting on the public service pay bill, social welfare or public services. General Government Gross Debt1 is expected to be 95% of GDP by the end of 2010 and will peak at 102% in 2013, before falling to 100% by 2014. We cannot continue to accumulate debt at this pace without damaging public services. As it is, an ever-increasing proportion of tax revenue is being diverted from much-needed public services to pay the interest on our debt which has a first call on our resources. For this reason, it is critical that an immediate and significant reduction is made to our reliance on borrowing to finance our running costs. 1 The estimates of General Government Debt contained in this Plan do not take account of any additional support to the banking system that may be part of a negotiated programme of external assistance. 7
  • 8. Exchequer Debt Interest Comparison 2009 and 2014 2014 Debt Interest €8.4 billion €2.5 billion 2009 Debt Interest Note: The €8.4 billion above is a post-consolidation figure. The 2009 amount represents about 8% of tax revenue while the 2014 amount represents 20% of projected revenue for that year. No person, group or sector can be absolved from making a fair contribution to the resolution of our economic difficulties. The measures contained in the Plan are proportionate. We must all accept our share of the burden so that we can collectively share in the fruits that will undoubtedly flow from solving our current problems. Significant and lasting gains have been won for this country over the period of our boom. For example, the decisions to pay down the national debt and set up the National Pensions Reserve Fund have strengthened our capacity to deal with this economic crisis. The transformation of our public infrastructure and our investment in education has served to increase our competitiveness and put us in a position to take advantage of recovery in the global economy. The scale of the spending adjustment we must now make dictates that investment must be curtailed. But the careful funding choices made in this Plan seek to protect core areas of economic investment such as education and supports for enterprise and innovation for the development of the smart economy. Investment in key social infrastructure such as public transport, hospitals, schools, water and environmental services will also be maintained. This Plan reaffirms the Government’s unambiguous position on the maintenance of the 12½% rate of corporation tax. This is a cornerstone of our pro-enterprise, outward-looking industrial policy and has remained consistent over successive administrations. Our budgetary adjustments over the last two and a half years have stabilised our public finances. We must now continue on this path by adhering to the targets set out in the Plan. The strategy and these targets in particular will be reviewed annually and action will be taken in the event of any deviation from the central projection. 8
  • 9. This Plan is based on the information available up to mid-November 2010. The figures referred to in the document may change as a result of policy decisions taken by Government after publication. Macroeconomic Principles and Outlook (Chapter 1) While the budgetary adjustment required is substantial, the prospects for a return to growth are favourable. Ireland is a small, open economy and export performance during the recession has been markedly robust. The vitality and dynamism of our economy depends on the health of our export sector which in turn stimulates domestic demand and creates jobs. The strategy underpinning this Plan will stimulate broadly-based export-led growth to increase output, to return to sustainable employment creation and to assist recovery in the domestic economy. Many of the essential conditions for a resumption of export-led growth are in place: our road network and our public transport system have been transformed; we have one of the best educated workforces in the world; and our tax system supports enterprise and innovation. This Plan sets out the measures we will take to increase productivity and rebuild our competitiveness. The current account of the balance of payments is expected to return to surplus in 2011 and record a steadily rising surplus over the following three years. This means that from next year the economy as a whole will no longer be borrowing from the rest of the world. Macroeconomic Outlook 2011–14 The reforms set out in this Plan will lead to a more stable macroeconomic position: ƒ Real GDP will grow by an average of 2¾% in the years from 2011 to 2014; ƒ From 13½% in 2010, unemployment will fall below 10% in 2014. Budget Strategy (Chapter 1) Approximately two thirds of the budgetary adjustment (€10 billion) will be achieved through expenditure savings and one third (€5 billion) through revenue-raising measures. Within the expenditure saving of €10 billion, current expenditure will be reduced by €7 billion and capital investment by €3 billion. Budget Strategy 2011–14 The Plan will correct budgetary imbalances: ƒ €15 billion budgetary correction over 4 years; ƒ €10 billion in public expenditure, €5 billion in tax and revenue raising; ƒ 40% or €6 billion will be front-loaded in 2011; ƒ Deficit will be reduced to 9.1% of GDP in 2011 and to below 3% by 2014; and ƒ Debt to GDP ratio will peak at 102% in 2013 and will fall to 100% by 2014. 9
  • 10. Strategy for Competitiveness, Growth and Employment (Chapter 2) Government policy must support the private sector by removing potential structural impediments to competitiveness and employment creation, and by pursuing appropriate sectoral policies to encourage export growth and a recovery of domestic demand. At present, the level of the minimum wage is out of step with an economy where GNP has fallen by 19%. Other labour market regulations are preventing job creation – especially in sectors where unemployment among younger and less-skilled workers is most prevalent. Decisive reform is required. Welfare and labour market policies must reward work and provide a pathway to employment, education and training opportunities for those who have lost their jobs. Reforms in this area, along with measures to enhance competitiveness, are pivotal to growth in our economy. Competitiveness, Growth and Employment The Government will: ƒ Reduce the minimum wage by €1 to €7.65; ƒ Reform welfare system to incentivise work and eliminate unemployment traps; ƒ Complete a review to eliminate anomalies in Registered Employment Agreements (REAs) and Employment Regulation Orders (EROs) within three months; and ƒ Reinvigorate activation policies to ensure that unemployed people can make a swift return to work. Cost competitiveness: ƒ Promote rigorous competition in the professions and measures to reduce legal costs; ƒ Take decisive actions to reduce waste and energy costs faced by businesses including the development of Smart Grids and renewable energy; ƒ Enhance availability of technological infrastructure, in particular next generation broadband networks; ƒ Lead efforts to reduce office rents in both the private and public sectors; and ƒ Increase efficiency in public administration to reduce the costs for the private sector. Sectoral Policies: ƒ Implement sector-specific measures to assist an increase in exports as well as an increase in domestic demand. ƒ Support innovation through the innovation fund, other enterprise supports and the tax system, and encourage small business development. Expenditure Measures (Chapters 3, 4 & 5) The job of Government is to create the conditions in which enterprise can flourish and jobs can be created. The most important of these conditions is sound public finances. Since 2007, our national income (GNP) has fallen by 15% and our tax revenues have reduced from over €47 billion to €31.5 10
  • 11. billion and are now back to 2003 levels. In these circumstances, the current level of public spending is unaffordable. It must be returned to a sustainable level relative to the size of the economy. The bulk of the savings will have to come from the major drivers of spending including Public Service Pay and Pensions, Social Welfare, Public Services including student supports, free or subsidised medical care and treatment and Public Investment. The expenditure measures contained in this Plan are designed not only to return public spending to a sustainable level but also to protect those most in need and facilitate economic recovery. Careful choices have been made to target scarce resources at those most in need, to protect enterprise and to promote competitiveness. Investment in education, innovation and enterprise has been maintained. The targets set for a reduction in public service staff levels together with the full implementation of the Croke Park Agreement will create a more efficient and effective public service, a crucial component of competitiveness that will deliver better services to the citizens at a lower cost. Capital spending must be reduced. But these reductions of €3 billion by 2014 must be considered in the context of the very substantial investment over the past decade which has transformed our road network, our public transport system, our educational institutions and our cultural, sport and tourist facilities. In the current lower cost environment, better value can be achieved from a lower level of capital investment creating a high level of capacity in the economy and delivering important social infrastructure. Expenditure Savings Government will: ƒ Reduce current expenditure by €7 billion by 2014, bringing spending back to 2007 levels; ƒ Reduce the cost of the public sector pay and pensions bill, social welfare, and public service programmes; ƒ Achieve savings in social welfare expenditure of €2.8 billion by 2014 through a combination of enhanced control measures, labour activation, structural reform measures, a fall in the Live Register, and, if necessary, further rate reductions; ƒ Cut public service staff numbers by 24,750 over 2008 levels, back to levels last seen in 2005; ƒ Reduce the public sector pay bill by about €1.2 billion between 2010 and 2014; ƒ Make more effective use of staffing resources with redeployment of staff within and across sectors of the public service to meet priority needs; ƒ Reform work practices to provide more efficient public services with scarcer resources; ƒ Introduce a reformed pension scheme for new entrants to the public service and reduce their pay by 10%; 11
  • 12. ƒ Introduce a pension deduction for public service pensioners to yield €100 million in savings; ƒ Reduce non-pay and non-social welfare spending by €3 billion over the period; ƒ Increase the student contribution to the costs of third level education; ƒ Introduce water metering by 2014; and ƒ Reform and update the existing budget system beginning in Budget 2011. Taxation Measures (Chapter 6) While the bulk of the budgetary adjustment is on the expenditure side, taxation must also play a role in bridging the gap between the State’s income and expenditure. Revenue-raising measures will contribute one third of the overall budgetary adjustment. The tax system must be capable of raising the resources necessary to pay for essential public services in a manner that does not unduly impede economic development. The Government remains committed to the 12½% corporation tax rate: it will not be increased under any circumstances. In 2010, it is estimated that 45% of taxpayers will pay no income tax. This is not sustainable. A fundamental principle of the reform outlined in this Plan is that all taxpayers must contribute according to their means. Those who can pay most will pay most but no group can be sheltered. The measures contained in this Plan will broaden the tax base by bringing more taxpayers into the tax net, abolishing or curtailing a range of tax exemptions and reliefs, and introducing a new site value tax. These changes will bring us back to an income tax structure last seen in 2006. Approximately one third of the revenue raised will come from indirect tax, capital tax and other charges; one third from direct income tax; and the final third from tax expenditures. This Plan contains a set of measures which will increase Government revenues over the next four years by just over €5 billion or approximately 3% of GDP in 2010 terms. Approximately 40% of the policy measures will be front-loaded into 2011, resulting in substantial structural reform of the income tax system. Revenue measures Government will: ƒ Maintain the 12½% corporation tax rate; this will not change; ƒ Raise €5 billion over the period of the Plan - 40% of measures will be front-loaded; ƒ Raise €1.9 billion through income tax changes; ƒ Implement pension-related tax changes to yield €700 million, with €240 million in tax savings on the public service pension-related deduction; ƒ Abolish/curtail a range of tax expenditures yielding €755 million; ƒ Increase the standard rate of VAT from 21% to 22% in 2013, with a further increase to 23% in 2014. These changes will yield €620 million; 12
  • 13. ƒ Introduce a Site Value Tax to fund essential locally-delivered services. This will yield €530 million; ƒ Increase the price of carbon gradually from €15 to €30 per tonne, yielding €330 million; ƒ Reform Capital Acquisitions Tax and Capital Gains Tax to yield an additional €145 million; ƒ Transform the Business Expansion Scheme (BES) into a new Business Investment Targeting Employment Scheme (BITES). Conclusion Our economy is beginning to recover. There will be a small increase in GDP this year. Given the 7.6% decline recorded in 2009 that in itself is remarkable. The impact of our improved competitiveness can already be seen in our healthy export figures. Both our foreign owned and indigenous exporting companies have been extremely resilient throughout the downturn. Even in the difficult trading circumstances of this year, they have increased their market share. This Plan will enable us to build upon the many positive aspects of our economy so that we can return to a sustainable medium-term growth path. The measures it contains will: ƒ remove barriers to growth; ƒ boost our competitiveness; and ƒ restore order to our public finances. Detailed policy measures identified in the Plan will build on our strengths and develop other sectors to provide a balanced economy and employment for our citizens. Our future prosperity rests upon the implementation of this Plan over the next four years. 13
  • 14. Chapter 1 Economic Policy Key Messages ƒ The economy is expected to stabilise this year before expanding at an annual average rate of 2¾% between 2011 and 2014. ƒ A €15 billion package of measures is required to restore order to the public finances by 2014. ƒ This package will comprise two thirds expenditure and one third revenue measures. ƒ The adjustment will weigh on domestic demand, but its overall effect will be mitigated by the economy’s high propensity to import and by the positive impact of budgetary adjustments on competitiveness and confidence. ƒ Ireland is a small, open economy in which long-term sustainable growth depends on the health of its internationally trading sectors. ƒ The conditions for sustainable export-led growth are in place - good infrastructure, high-quality human capital, a favourable taxation environment and available credit for viable businesses. ƒ The Plan sets out policies to assist a resumption of output and employment growth, including structural reforms to enhance labour market flexibility and cost competitiveness. ƒ Export-led growth will foster recovery in the domestically trading sectors. ƒ Growth in GDP is expected to bring the unemployment rate down below 10% by 2014. ƒ The balance of payments (BoP) is expected to return to surplus in 2011 and the surplus will steadily increase over the following three years. This means that the economy as a whole will no longer be borrowing from the rest of the world. 1.1 The Economy in 2010 1.1.1 Current Position The economy is emerging from recession. The level of GDP in 2010 will be some 11% below and the level of GNP some 15% below their respective levels of 2007 in real terms. Employment has fallen by about 13% from its peak of 2007 while the unemployment rate has risen from 4.6% to 13.5%. A downturn of this size is without precedent in Ireland’s recorded economic history and has few modern parallels at an international level. It follows annual average growth of 7.3% and 6.6% in GDP and GNP respectively, and a cumulative increase of over 900,000 of the numbers at work, between 1994 and 2007. The recession was due in part to the effects of a steep economic downturn in our main trading partners and a deep global financial crisis. But it was exacerbated by the collapse of the domestic property market and construction industry and the associated banking crisis at home. As such, the 14
  • 15. severity of the recession may be attributed to the combination of excessive credit expansion, rapid property price inflation and disproportionate growth in construction output in the earlier 2000s. The crisis has had a severe impact on the public finances. Tax receipts in 2010 will be around 33% lower than in 2007, the steepness of the fall reflecting the over-dependence on property and construction-related revenue sources during the boom years. At the same time, net current spending has continued to rise because of the upward pressure exerted by a much increased Live Register, a mounting debt interest burden and falling receipts from sources such as PRSI. As a result, the public finances have deteriorated rapidly and a structural gap between spending and revenue has opened up which will not be closed by a cyclical recovery in the economy (see Annex 1). Recent data suggest that economic recovery is slowly taking shape. It is now expected that GDP will record a very small increase this year on the back of strong export growth. Exports in turn are being driven by improvements in competitiveness and a strengthening of international markets. Conditions in the labour market are also beginning to stabilise as indicated by the flattening of the unemployment rate and recent declines in the monthly Live Register. However, domestic demand remains weak as households and businesses continue to repair their balance sheets following a period of excessive debt accumulation. 1.1.2 Budgetary Outlook for 2010 Introduction In early November, the Department of Finance published an Information Note on the economic and budgetary outlook, based on detailed technical analysis and containing an assessment of future economic conditions. Further information on the economic and budgetary outlook can be found in that Note which is available on the Department’s website at www.finance.gov.ie. Additional economic data, including a comparison of the Department’s forecasts with those of other organisations, a discussion of risks, and sensitivity analysis associated with this Plan are set out in Annex 2. The Budget Deficit The latest Exchequer figures indicate that the Government will achieve its objective of stabilising the underlying budget deficit in 2010. Net voted current expenditure was €37.2 billion for the period January to October 2010, 2.7% below profile. Tax receipts for the same period amounted to €24.7 billion or 1% above profile. November will be a key month for tax receipts. However, tax revenue for the year as a whole is currently expected to amount to €31.5 billion, some €450 million above the level forecast in last December’s Budget. Taking account of the likely evolution of Government spending in the final months of the year, and excluding the impact of the bank support measures, the General Government deficit in 2010 is now expected to be 11.7% of GDP, in line with the Budget 2010 target of 11.6%. 15
  • 16. Public Debt Due to the strong performance of the economy through much of the 1990s and early 2000s, debt ratios fell dramatically. As a result, the General Government Gross Debt to GDP ratio had fallen to just 25% by end-2007. The underlying position was even stronger at that point: the net debt to GDP ratio was just 14%. By end-2009 however, reflecting the large deficits recorded in the intervening period, and other factors, General Government Gross Debt had reached 66% of GDP. It is currently estimated that the ratio will be 95% of GDP at end-2010. The main reason for the very large increase this year is that the capital support – some €31 billion – being provided to a number of institutions within the banking sector in 2010 is classified within the General Government Gross Debt measure. When account is taken of the value of assets in the National Pensions Reserve Fund (NPRF) and of Exchequer cash balances, the position is a good deal more favourable. The net debt measure that results from these adjustments is estimated at 69% of GDP at the end of 2010. 1.2 Budgetary Adjustment 1.2.1 Rationale for Adjustment In money terms, the gap between Government receipts and spending will come to almost €19 billion in 2010. This gap simply must be closed. Government has already taken significant actions to prevent the gap from widening. Table 1.1 shows the adjustments to expenditure and revenue, amounting to a cumulative €14.6 billion, already implemented between July 2008 and Budget 2010 in pursuit of this objective. Despite the scale of the adjustment, a very large and unsustainable gap remains between spending and revenues, which is filled by borrowing. Table 1.1 Budgetary Adjustments since mid-2008 – planned budgetary impact upon 2010 € billion July 2008 Expenditure Adjustments 1.0 Budget 2009 (October 2008) Revenue raising measures 2.0 February 2009* Expenditure Adjustments 2.1 Supplementary Budget (April 2009) Revenue-raising & expenditure-reducing measures 5.4 Budget 2010 (December 2009) Expenditure-reducing & minor revenue-raising measures 4.1 Total €14.6bn *Postponement of the pay increases contained in the ‘Towards 2016’ agreement generated another €1 billion in full year savings The current level of borrowing is unsustainable. Unless it is reduced, the burden of debt service will absorb a rapidly increasing proportion of tax revenue, even assuming no upward pressure on interest 16
  • 17. rates. More pertinently, as recent developments in the international bond markets have shown, persisting with the current scale of borrowing will result in interest rates remaining at unaffordable levels. Moving towards a balanced budget therefore is a prerequisite for future economic growth. Tackling the deficit now is essential in order to engender international confidence in our ability to meet our commitments. 1.2.2 Scale of adjustment required Ireland’s membership of the eurozone obliges us to adhere to the Stability and Growth Pact and bring the General Government deficit back below 3% of GDP. Budget 2010 assumed an adjustment package of €7.5 billion over a four-year period would be required to reach this target by 2014, the target year agreed with our European partners. It is now estimated that an adjustment of some €15 billion will be necessary to reach this target. Figure 1.1 Public Finances 2004-2014 -20-100102030405020042005200620072008200920102011201220132014Year % of GDP Underlying General Government Balance (% of GDP)General Government Revenue (% of GDP)General Government Expenditure (% of GDP) Reasons for the increase in the size of the budgetary adjustment required ƒ The economy is smaller, reflecting CSO revisions to the level of GDP in 2009 and previous years. ƒ The repair of household and company balance sheets after the damage caused by the bursting of the property bubble will dampen consumer and investment spending to a greater extent than previously thought. ƒ The level of prices in the economy is now forecast to rise more sluggishly than previously expected as economic activity generally is more muted. ƒ The impact of the Promissory Notes issued to Anglo Irish Bank, INBS and EBS, means that in order to achieve the budgetary targets by 2014 compensatory measures must be taken over the period 2011 to 2014. These costs will amount to an estimated €2.4 billion in 2014 and, if not addressed, would add about 1.3% to the deficit figure in that year. ƒ All of these factors suggest that the outlook for growth, both real and nominal, is less favourable than a year ago. This means having to adjust more and in so doing there is an additional negative impact on the economy. 17
  • 18. 1.2.3 The Composition of the Budgetary Adjustment It is clear that an adjustment of the magnitude required cannot be achieved by exclusive reliance on either tax increases or expenditure cuts. If taxes were raised by €15 billion over the next four years, the burden of taxation would increase to the point where competitiveness was hugely impaired and the economy’s capacity to generate growth in output and employment seriously damaged. Conversely, if the entire burden of the €15 billion reduction were to fall on Government spending, the impact on public services and social welfare provision would be unacceptable. It follows that the adjustments to be made must comprise a mix of revenue-raising and expenditure- reducing measures. In determining the appropriate balance between the two, the Government has been guided by the lessons of our past as well as the experience of other countries that have found themselves in similar circumstances. The international evidence, analysed by organisations such as the IMF, the EU Commission and the OECD, suggests that budgetary adjustments are more successful in reducing deficits and stabilising debt ratios when they rely more on reducing expenditure than increasing taxes. This is consistent with our own experience of the late 1980s. The unsuccessful attempts at restoring order to the public finances in the early part of that decade leaned heavily on tax increases, while the successful budgetary adjustment of the late 1980s relied more on controlling expenditure and, insofar as it included tax measures, concentrated on widening the base rather than increasing rates of tax. Of the €14.6 billion of budgetary adjustments that have already been undertaken since 2008 just under two-thirds have fallen on the expenditure side with the remainder comprising revenue-raising measures. Similar proportions will apply to the adjustments planned for the next four years: of the €15 billion overall adjustment to be made, €10 billion will be composed of expenditure reductions and €5 billion will comprise revenue-raising measures. Drawing on the experience of the 1980s, the proposed revenue-raising measures will concentrate on broadening the base as part of the reform of the tax system that was signalled in Budget 2010. The effect of the adjustment will be to raise the overall ratio of tax (including receipts from PRSI, the Health Levy and the National Training Fund Levy) to GDP by about 3% points between 2010 and 2014. This will still leave the ratio slightly below the level it was at in the late 1990s, a period during which the economy last experienced balanced export-led growth. Table 1.2 below shows the General Government Deficits in each of the years 2011-2014, arising out of an overall adjustment package of €15 billion. Achieving these budget targets is predicated on implementing the expenditure and taxation adjustments set out later in this document. Chapters 3 to 5 detail the required current and capital expenditure adjustments on a sector by sector basis. Chapter 6 sets out the individual revenue-raising measures which are necessary to generate an additional €5 billion in revenue. 18
  • 19. Table 1.2 – Forecast General Government Deficits and end-year Gross Debt Levels 2011 2012 2013 2014 General Government Deficit (% of GDP) 9.1% 7.0% 5.5% 2.8% Total Consolidation2 (Full-Year Impacts) €6.0bn €3.6bn €3.1bn €3.1bn ƒ Expenditure €3.9bn €2.1bn €2.0bn €2.0bn o Current €2.1bn €1.7bn €1.6bn €1.6bn o Capital €1.8bn €0.4bn €0.4bn €0.4bn ƒ Taxation €1.4bn €1.5bn €1.1bn €1.1bn ƒ Other €0.7bn General Government Gross Debt (% of GDP) 100% 101% 102% 100% Rounding may affect totals Implementing a package of budgetary adjustments totalling €15 billion over the next four years in the manner outlined above and a gradual unwinding of Exchequer cash balances is expected to result in the General Government Gross Debt peaking in 2013 at 102% of GDP before falling to 100% of GDP by 2014. The stabilisation and subsequent reduction of the ratio of debt to GDP is dependent, among other things, on the growth rate of nominal GDP and the average interest rate on the debt. The sensitivity of the ratio to these variables is explored in Annex 3. 1.3 Achieving Economic Recovery 1.3.1 Growth in an Open Regional Economy Ireland is an open regional economy. Its openness is most obvious in terms of the importance of international trade: exports and imports of goods and services are equal to 175% of GDP. But there are other dimensions of Ireland’s openness that are no less significant. One is its dependence on international capital flows, including flows of foreign direct investment from abroad. Another is the elasticity of its labour supply: the capacity for its labour force to be augmented by immigration and depleted by emigration. Ireland’s openness means that the economy here interacts widely and deeply with the rest of the world and is sensitive to changes in world economic conditions, while its size means that the domestic market is too small to provide the basis for long run sustainable growth. Long term growth in a small open economy therefore is a function of the export base, the collection of enterprises that are involved in the production of goods and services for international markets. 2 Total consolidation sums to more than €15 billion in Table 1.2 due to inclusion of non-recurring once-off items that impact in 2011 only. The full year impacts of expenditure and revenue measures are taken into account in the figures. 19
  • 20. The enterprises that make up these internationally trading sectors generate output and employment directly, but they also generate output and employment indirectly in Ireland through their demand for buildings, machinery, components, raw materials and a wide range of service inputs. On top of that, the internationally trading sector together with the local firms that supply it, create a multiplier effect throughout the wider economy, as the people employed in these sectors spend their wages and salaries. The vitality and dynamism of the Irish economy therefore depends ultimately on the vitality and dynamism of its internationally trading sector. This, in turn, depends on the competitiveness of the enterprises that go to make up the sector, that is, on their ability to win, retain and expand their share of the international markets which they serve. It also depends on Ireland’s attractiveness as a location for the establishment of new exporting activities. Long-term sustainable growth in the Irish economy is export-led. This is not to say that domestic demand is unimportant. On the contrary, balanced economic growth is attained when consumption and investment, as well as exports, are expanding at a healthy pace. Indeed, strong gains in employment typically require solid growth in domestic demand. This is because the sectors that serve domestic demand, like retailing and construction, tend to be more labour intensive than the exporting sectors. There are notable exceptions to this pattern. Tourism, for example, is an important exporting sector that is relatively labour intensive. In their recent analysis of the causes of the swift reversal of our economic fortunes, Klaus Regling and Max Watson3 conclude that in the period leading up to the current crisis, the share of construction sector in the economy became excessive and as our competitiveness deteriorated significantly, Ireland lost market shares in international trade. At the height of the building boom in 2007, the construction sector directly accounted for 13% of total employment, compared with an average of just over 7% for the 1990s. The appetite of a rampant building industry for labour and other resources put upward pressure on the economy’s cost structure and contributed to the deterioration in the competitiveness of the internationally trading sectors. The Irish economy did enjoy sustained balanced export-led growth as recently as the 1990s. Between 1993 and 2000, exports expanded at almost 18% per annum, driving average annual GDP growth of 9%, a cumulative increase of half-a-million people in employment, a cumulative rise in living standards of about 80%, and all in the context of maintaining a healthy balance of payments position and achieving a substantial government budget surplus. The formula for achieving the kind of balanced sustainable growth in output and employment that is appropriate to a small open economy, therefore, is not elusive. We discovered and applied that formula in the 1990s and we can do so again. 3 A Preliminary Report on the Sources of Ireland’s Banking Crisis by Klaus Regling and Max Watson – Published May 2010. 20
  • 21. 1.3.2 Economic Policy Principles Although Government has only a marginal presence in the production of internationally traded goods and services, it plays a vital part in creating the conditions in which the sector can grow and prosper. Equally important, Government is responsible for creating an environment that makes Ireland an attractive place in which to live and work. The most important of these conditions and the one for which the Government has the clearest and most direct responsibility is sound public finances. Unsustainable public finances undermine the framework for economic prosperity through at least three channels: (i) the upward pressure on interest rates and the consequent increase in the price of credit; (ii) the uncertainty created about the future course of taxes and the continued provision of essential public services, and (iii) the reputational damage to the country and its institutions. The restoration of sound public finances must be the cornerstone of any economic plan. The measures taken to restore sound public finances must observe certain principles and must have regard to the nature of the Irish economy. A key principle is that the measures be fair and be seen to be fair in order to maintain the highest degree of social cohesion. In deciding on the measures to be taken to restore sustainability to the public finances, the government has attempted to spread the burden of adjustment as equitably as possible. Over the past two years, the combination of tax and social welfare changes has reflected that spirit of fairness. Analysis of the distributive impact4 shows that the net impact of these changes has been progressive, with higher income groups carrying a larger burden than those on modest incomes. In real terms, the reduction in the cost of living has also helped to maintain living standards. A number of other considerations have informed the Government’s approach to framing the budgetary measures and the broader economic policy initiatives detailed later in this Plan: ƒ The need to boost competitiveness. This has, for example, influenced the composition of budgetary adjustment as between spending and revenue-raising and the emphasis in raising revenue on widening the base rather than raising tax rates. ƒ The need to enhance the economy’s productive capacity. The government has sought to make the bulk of the necessary spending reductions on the current side. In doing so it has ensured that sufficient funds are available to press ahead with key infrastructural projects and to maintain high levels of spending on education. ƒ The need to take a long-term view. At the core of our fiscal problem is a large structural deficit, the measures to eliminate which have to be structural in nature. These measures must be permanent in their impact and selected on the grounds of their appropriateness over the medium to long run. Charting our way out of our current difficulties requires long-term 4 Carried out by the Social Inclusion Unit in the then Department of Social and Family Affairs. 21
  • 22. planning. The proposals for reform of the budgetary process, outlined in Chapter 3, are intended to create a framework in which fiscal policy decisions are informed by a medium to long-term perspective. ƒ The need for credibility. This Plan must be credible, both to Irish citizens and to international markets. To that end, the Plan is based on a set of economic forecasts which the Government believes to be prudent, and sets out the policy measures which it is proposed to take at a level of detail designed to dispel uncertainty to the greatest degree possible. 1.3.3 Strategy for growth Figure 1.2 illustrates the anticipated path to economic recovery set out in this chapter. The process of recovery is founded on a number of essential conditions – which are either in place, or are being pursued actively - coupled with a range of specific policy actions detailed in Chapter 2. These measures will assist export recovery through enhanced competitiveness and sector-specific initiatives. Export growth will in turn deliver high value employment and act to stimulate the domestically trading sectors of the economy. The measures contained in Chapter 2 will also directly assist in job creation in the local economy by removing barriers to employment and disincentives to work. These developments will in turn boost consumption and, over time, reduce unemployment and lead to further employment gains. Figure 1.2 Summary Steps to Economic Recovery Consumption improves Exports recover 1. Horizontal Measures (a) Labour market reform (b) Steps to reduce costs (c) Public administration improvements 2. Specific sectoral initiatives Employmentgains, tax revenue increases, unemployment falls Credit availability Infrastructure Human Cap Favourable Taxation Sustainable public finances Employment increases Unemployment stabilises Essential conditions Anticipated outcomes Policies for growth 22
  • 23. Restoring competitiveness and retuning sectoral policy to grow exports and assist locally trading firms is the necessary first step on the path to economic recovery. This is Government’s core strategy for tackling unemployment. 1.3.4 Essential Conditions for Growth Our experience shows that economic growth and sustainable jobs are generated by the private sector in the main. But Government plays an important role in creating the framework conditions to enable growth. The budgetary adjustment measures set out in this Plan can deliver sustainable public finances. Other essential inputs from Government include: ƒ the provision of appropriate economic and social infrastructure; ƒ investment in human capital; ƒ ensuring adequate credit availability; and ƒ tax polices which are favourable to entrepreneurship, investment and work. Across these areas, conditions for growth are either already in place, or policies to achieve them are being pursued. Essential Conditions for Growth Physical infrastructure Improvements to our stock of economic and social infrastructure over the past decade or so are a visible legacy of the economic expansion of that period. In the years between 1997 and 2007 annual public capital allocations were quadrupled. This investment expanded capacity across a range of sectors and addressed the infrastructure deficit that had previously constrained the Irish economy. The current stock of infrastructure, which will be augmented by a substantial ongoing programme of public investment over the next four years, leaves the economy well-equipped to return to export-led growth. Capital investment will continue to support employment by providing a significant level of direct job supports to IDA Ireland and Enterprise Ireland. These supports will be maintained so that the Government will offer considerable direct assistance to the enterprise sector alongside measures to improve competitiveness. Available human capital As with the stock of physical infrastructure, the quality of Ireland’s human capital puts us in a strong position for a return to economic growth. The country continues to have a skilled and flexible labour force whose educational profile displays a number of 2positive characteristics. The 25-34 year old age cohort, for example, has a higher level of formal qualification than the OECD average, while the proportion of the population aged 20-24 with at least an upper second-level education is the highest in the EU15 (see figure 1.3) Amongst those who have become unemployed a large number have significant levels of skill and experience and a history of achievement across a range of sectors. Credit availability for business An overriding objective of the Government’s banking policy is to ensure that viable businesses, especially Small and Medium Enterprises (SMEs), can access the credit they need. To this end a Code of Conduct on SME Lending was introduced for the first time last year. The Code requires banks to deal fairly and transparently with their business customers. In addition, the Credit Review Office (CRO), set up under the NAMA legislation, provides a review mechanism for SMEs who have had credit refused, withdrawn, or offered on unreasonable conditions. In his latest quarterly report, Mr. John Trethowan of the CRO notes that the lending situation for SMEs is improving and that the recapitalisation strategy for the two largest banks (Bank of Ireland and Allied Irish Bank) is achieving its objective. 23
  • 24. Favourable taxation The tax burden in Ireland is relatively low and will remain so even after the revenue-raising measures contained in this Plan have been implemented. A key feature of the tax system is the 12½% corporation tax regime which represents an essential pillar of enterprise policy. Other important aspects of the corporation tax framework include: the R&D tax credit; the holding company tax regime and Ireland’s rapidly expanding network of double taxation agreements. Figure 1.3 Proportion of population with at least upper second level education 505560657075808590 PortugalSpainDenmarkGermany euro area ItalyNetherlandsLuxembourg EU27United KingdomGreeceBelgiumFranceFinlandAustriaSwedenIreland% of pop aged 20 - 24 Source: Eurostat 1.3.5 Retuning Policies for Growth Actions have been taken on all the essential conditions for growth but a number of critical reforms will further boost economic activity. These can be broadly categorised as follows: ƒ Labour market reforms to remove barriers to employment and disincentives to work; ƒ Reforms to improve the non-labour elements of cost competitiveness; and ƒ Supportive sectoral policies to assist recovery across the enterprise base. These structural reforms to bolster the private sector are presented in detail in Chapter 2. Over the medium-term they will be complemented by reforms to the operation of the public service, discussed in Chapter 4. The associated policy actions represent a coherent Government strategy for creating the conditions that will foster the resumption of growth in output and employment. 1.4 The Economic Outlook, 2011-2014 1.4.1 Output and Employment After two years of extremely sharp declines in output, the Irish economy, as noted above, is expected broadly to stabilise this year before expanding over the period 2011 to 2014. Consistent with the typical recovery path in a small open economy, the stabilisation and initial strengthening will be primarily driven by a recovery in exports. The recent performance of exports has been encouraging and it is now estimated that they will grow by about 6¼% in real terms in 2010. In 2011, there may be some slowdown, reflecting the moderation of the pace of recovery in our main trading partners, 24
  • 25. but taking the 2011-2014 period as a whole, exports can be expected to increase at a healthy pace as the competitiveness of Irish producers improves further and demand continues to grow in our overseas markets. Table 1.3 Medium term economic outlook (% change unless otherwise stated) 2011 2012 2013 2014 GDP real 1¾ 3¼ 3 2¾ GDP level ^ (€m) 161,200 168,100 175,400 183,500 GNP real 1 2½ 2½ 2½ GNP level ^ (€m) 127,900 132,500 137,600 143,400 components of real GDP Domestic demand - consumption 0 1 1½ 1¾ - government -3 -2 -2¼ -2 - investment -6 5¼ 5 5¼ Trade and external account - exports 5 5 4½ 4 - imports 2¾ 3 3¼ 3 - BOP current account (% GNP) ¼ 1½ 2½ 3½ price developments HICP ¾ 1 1¾ 1¾ GDP deflator ¾ 1 1¼ 1½ labour market Employment -¼ 1¼ 1½ 1¾ Unemployment (%) 13¼ 12 11 9¾ Source: Department of Finance forecast ^ Figures are rounded to the nearest €100 million As a healthy export performance filters through to investment and consumption, the recovery in economic activity should become more broadly-based. However, domestic demand is likely to respond sluggishly. Household finances have been significantly affected by house and other asset price declines in recent years and, while the unemployment rate is now stabilising, it is doing so at a high level and will take some time to decline. Households have entered a period of debt reduction. This in turn has reduced the amount of disposable income available for consumption and will continue to do so for some time to come. In these circumstances, the household savings rate will likely remain above its historical average, although it is expected to fall over the period of the Plan, as the crisis recedes, consumer confidence returns and labour market conditions improve. In these circumstances, real consumer spending is expected to be flat in 2011 before expanding modestly, at an annual average rate of around 1½% in the period 2012 to 2014. Some of the factors restraining consumer spending – in particular the need to repair balance sheets – are also likely to restrain investment spending by firms in the period ahead. Taken together with the outlook for public capital spending, this indicates that overall investment spending will provide limited support to domestic demand. A 6% fall is expected in 2011, followed by average annual growth of about 5% over the following three years. 25
  • 26. Real GDP is forecast to increase by an average of almost 2¾% in the years 2011 to 2014, with real GNP growing by an average of just over 2% over this period. Growth in 2011 however will be considerably below the average for the period as a whole. This moderate expansion in output is expected to be accompanied by the resumption of employment growth, starting in 2012 and averaging about 1½% a year between 2012 and 2014, generating a cumulative increase of about 90,000 over this period. This is consistent with a steady decline in the unemployment rate which is expected to have fallen below 10% by 2014. Reflecting the moderate pace of output growth, the amount of spare capacity in the economy and the likelihood that external pressures on prices will be modest, low rates of inflation are projected. Consumer price inflation should be contained at less than 1% in 2011 and is forecast to average 1½% in the years 2012 through 2014. The GDP deflator, which provides the most comprehensive measure of inflation in the economy, is expected to increase at a somewhat slower rate. Inflation, by either measure, is expected to be lower than in our main trading partners over the period of the Plan, reflecting and assisting the process of competitiveness improvement. This economic outlook summarised above takes account of the €15 billion budgetary adjustment package planned for 2011-2014. It also takes account of the favourable impact on output and employment expected to accrue from the proposed structural reforms to bolster labour market flexibility and cost competitiveness contained in Chapter 2. 1.4.2 The Impact of Fiscal Consolidation in an Open Economy Budgetary adjustment will clearly have a negative impact on household disposable income, thereby lowering personal consumption. However, the impact of the adjustment on consumption is unlikely to be one-for-one. This reflects the current elevated level of household savings. Figures from the Central Statistics Office (CSO) put the savings rate at over 12% in 2009, and Department of Finance estimates point to a broadly similar rate for this year. Households have increased their savings for a number of reasons: uncertainty regarding future income prospects has motivated an increase in precautionary savings while the decline in net household wealth (or more precisely the ratio of net wealth to disposable income) has prompted debt deleveraging within the household sector, a phenomenon which is expected to decline over the period of the Plan. Budgetary adjustment can potentially play a positive role in reducing precautionary savings by creating greater certainty about the prospects for household disposable income. In particular, permanent, targeted and well-designed budgetary adjustment measures can reasonably be expected to have a favourable effect on confidence, so that the impact on consumer spending of lower disposable income may be partly offset by a decline in the savings rate. In relation to specific measures, as noted earlier, the available evidence suggests that reductions in current spending have a smaller negative impact on economic activity than cuts in productive capital spending or tax increases. 26
  • 27. The available evidence also indicates that, when taxes need to be raised, measures that broaden the tax base are preferable to increases in tax rates. The openness of the Irish economy must also be borne in mind in assessing the effect of budgetary adjustment. In the first instance, the import content of spending in Ireland is relatively high. In other words, we import a large share of what we consume. Thus, while domestic demand will clearly decline because of the budgetary adjustments that need to be made, the consequent decline in imports will mean that the impact on GDP will be significantly less than it would otherwise be. At the same time, the budgetary adjustment will contribute to improving the economy’s competitiveness by putting downward pressure on the domestic cost base. This will have a positive effect on export performance which will provide some measure of offset to the dampening effect of fiscal correction on overall economic activity. 1.4.3 Savings, the Balance of Payments and the Banking System The current account of the balance of payments is a measure of the extent to which the economy as a whole is lending to or borrowing from the rest of the world. An important aspect of the behaviour of the Irish economy over the past few years relates to the balance of payments. Since 2008 there has been a sharp fall in the balance of payments current account deficit, which amounted to almost 6% of GDP in 2008, but which is estimated to have declined to 1.4% of GDP in 2010. What this signifies is a major reduction in the rate at which Ireland (public and private sectors together) has been borrowing from abroad. Given an underlying government budget deficit of 11.7% of GDP, the small current account deficit in 2010 indicates that the private sector is now running a very large financial surplus, equivalent to over 10% of GDP. This surplus reflects the combination of the steep fall in investment and the sharp increase in savings that has occurred in the recession. The increase in savings is especially evident in the household sector where the savings rate, according to the CSO, rose from less than 4% in 2008 to over 12% in 2009. This increase in savings has been used to rebuild household balance sheets. In part this has been achieved by the repayment of debt. Already, the value of outstanding loans to households has been reduced by about 10% from its January 2008 peak of €154 billion to €139 billion in September 2010. 27
  • 28. Figure 1.4 Balance of Payments Current Account (% of GDP) -7-6-5-4-3-2-101234 19981999200020012002200320042005200620072008200920102011201220132014 Years % of GDP The forecasts underpinning this Plan envisage the current account of the balance of payments recording a small surplus in 2011, and see that surplus growing steadily over the period to 2014, by which time it is expected to reach 2.7% of GDP. The budgetary programme is targeting a decline in the Government’s budget deficit from 9.1% to 2.8% of GDP over the same period. This combination of current account surpluses and substantial (though declining) budget deficits implies the continuation of a large private sector financial surplus throughout the period of the Plan. Much of this accumulation of financial surplus by the private sector will take the form of increased deposits with and reduced borrowing from domestic banks. The result will be a very substantial fall in the loan-to-deposit ratio of the domestic banking system and a corresponding reduction in the domestic banks’ reliance on external sources of funding. 28
  • 29. Chapter 2 Strategy for Competitiveness, Growth and Employment Key Messages ƒ Export led growth will fuel domestic recovery. ƒ Policy will foster the considerable growth potential of the Irish economy. ƒ Cost competitiveness will be improved through a series of specific measures in the waste, energy, transport, telecommunications, professional services and public administration sectors. ƒ Barriers to employment creation will be removed. o The level of the National Minimum Wage will be reduced by €1 an hour. o The Minister for Enterprise, Trade and Innovation will complete a review to eliminate anomalies in the framework REA and ERO agreements within three months. ƒ Welfare and labour market policies will be overhauled so that work is rewarded and those seeking work have a pathway to work, education and training. 2.1 Overview – the Strategy for Economic Recovery Competitiveness is the key to a return to economic growth and a resumption of sustainable employment creation. We have made progress over the last two years. But more needs to be done. This means reducing costs and improving productivity in all sectors. The job of Government is to support the private sector by removing structural impediments to competitiveness and employment creation and securing the conditions for growth. But the Government must also pursue appropriate sectoral policies to foster export growth and a recovery of domestic demand. This Chapter sets out the key reforms in each of these important areas. For a regional, open economy such as ours, sustained export growth will be a critical step on the path to economic recovery. Labour market reform and competitiveness measures in this Plan will assist this process and will help foster employment creation in domestically trading sectors such as retail and hospitality. The prospects for a return to enterprise-led growth are improved by the modern nature of Ireland’s export base as illustrated in Figure 2.1. The high proportion of exports from high-tech sectors5 indicates that the Irish economy has already established a strong base which can act as a platform for further advancement to a more knowledge intensive period of growth. 5 It should be noted that high-tech sectors may include manufacturing activities with low tech processes. Nonetheless the graph is a useful indicator of the comparative modernity of Ireland’s export base. 29
  • 30. Figure 2.1 High-tech exports as a proportion of total 0102030405060 PolandBulgariaRomaniaLatviaLithuaniaSloveniaSpainSlovakiaGreeceItalyBelgiumPortugalEstoniaAustriaCzech RepublicDenmarkSwedenGermany EU27FranceFinlandNetherlandsHungaryCyprusUKIrelandLuxembourgMaltaper cent of total Source: Eurostat Enterprise Policy – Driving the Smart Economy Agenda Alongside the sector specific policy supports set out in section 2.5, a number of cross-cutting issues relevant to enterprise policy warrant some discussion. This Plan builds on, and is consistent with, Building Ireland’s Smart Economy, the framework for sustainable economic recovery published in December 2008. This framework identified five action areas as the basis for the Government’s response to the crisis: ƒ securing the enterprise economy and restoring competitiveness; ƒ building the Ideas Economy; ƒ enhancing the environment and securing energy supplies; ƒ investing in critical infrastructure; and ƒ providing efficient and effective public services and smart regulation. It placed particular emphasis on increasing productivity across all sectors of the economy as the basis for sustainable improvements in living standards. It also stressed the role of knowledge and innovation in driving productivity. The Government has acted in all these areas to tackle short-term difficulties while laying the basis for future recovery. It has ƒ introduced supports for business, through short term measures such as the Enterprise Stabilisation Fund and the Employment Subsidy Scheme, while ensuring large gains in international competitiveness; ƒ begun to re-position Ireland as a Global Innovation Hub based on the work of the Innovation Taskforce, particularly through the establishment of Innovation Fund Ireland; ƒ sustained high levels of capital investment to support economic activity during the last two years, completed the inter-urban motorways and delivered new projects at reduced cost; and ƒ provided funding for R&D and commercialisation and for renewable energy including ocean energy and biomass. 30
  • 31. The Government recently launched a new strategy – Trading and Investing in a Smart Economy – to integrate the promotion of overseas trade, tourism and investment. This strategy sets out cross- sectoral priorities and targets, and a series of recommended actions that will ensure our trade, tourism and investment sectors are well positioned to respond effectively to emerging opportunities as the global economy recovers. The strategy focuses on specific sectors and markets and is expected to deliver 150,000 direct and 150,000 indirect new jobs. We have also set ambitious targets for new FDI investments, tourist numbers and exports. The selected sectors include services, tourism, food, education, life sciences, software, Next Generation Network-enabled sectors, green technology, construction and the built environment, creativity and design, and technologies for an ageing population (‘silver technologies’). Britain and the United States will continue to be our key markets. But there is considerable potential to expand business with our Euro area partners, as well as in new and high potential growth markets such as Brazil, China, India, Russia, Japan, and the Gulf States. Positioning Ireland’s brand and reputation in new growth markets and reinforcing positive messages about our brand and reputation in existing markets will support broadly based export-led economic recovery. 2.2 Restoring Cost Competitiveness Data on prices, costs and productivity point to a sustained improvement in competitiveness over 2009 and 2010. The fall in the euro exchange rate against the dollar and sterling in the first half of 2010, and lower inflation in Ireland has assisted export performance6. But improvements have been slower to materialise in some areas, principally in the locally trading sector of the economy. Table 2.1 shows our ranking in a selection of key competitiveness indicators. Table 2.1 Selected cost competitiveness indicators Cost category Rank among countries benchmarked Large energy user prices 6th / 14 Waste disposal costs 9th / 9 Water costs for industrial users 10th / 16 Mobile telephone costs (high usage) 5th / 13 Broadband low speeds (< 2mbps) 6th/24 Broadband medium speeds (2-12mbps) 11th/29 Broadband high speeds (12-32mbps) 10th/29 Prime industrial rental 11th / 13 Prime office space rental 8th / 13 Source: National Competitiveness Council, Eurostat and OECD 6 Central Bank (2010) Quarterly Economic Bulletin. Q4. 31
  • 32. A number of areas require further action in order to boost competitiveness. 2.2.1 Waste, Energy and Transport There has been a significant reduction in the cost of electricity for large users. For large energy users we are sixth cheapest out of 14 countries benchmarked. For SMEs we are now close to the EU average. A rebate of network charges to large energy users, combined with falling fuel prices and the development of renewable energy assisted this process. The Energy Regulator has taken steps to achieve efficiencies in network investment and operations. This has been matched by Government policy actions including the introduction this year of a carbon windfall levy on generators. The full opening up to competition of the supply and generation markets can be expected to have a positive impact on prices. Government will also take further actions. Action Points ƒ The Commission for Energy Regulation will continue to impose rigorous efficiency targets on the ESB, Bord Gáis and Eirgrid to drive efficiencies in the energy sector. ƒ Capital investment programmes by the utility companies will be commensurate with the infrastructure needs and energy demand of the Irish economy avoiding excess capacity and extra cost. ƒ The National Energy Efficiency Action Plan will be implemented in order to achieve a national energy saving of 20% by 20207 including measures to assist SMEs to lower electricity costs. When it comes to waste management costs and treatment options, Ireland needs to improve its performance. Action Points ƒ Major waste infrastructure will continue to be developed primarily by the private sector while public investment in recycling infrastructure will be maintained - both elements will expand capacity and assist competitiveness. ƒ Levies will be used to drive waste modernisation in accordance with a sustainable waste hierarchy, ensure compliance with EU legislation and create a revenue stream for investment in support of waste policy objectives and enforcement. ƒ Government will ensure greater competition for public transport routes following the establishment of the National Transport Authority. This will have further positive effects on competitiveness. 7 The Action Plan sets out a range of measures for achieving this saving including the National Retrofit Programme, supports to business for energy efficient technologies, a targeted energy reduction of 33% in the public service and the development of electric vehicles. 32
  • 33. 2.2.2 Telecommunications Ireland compares favourably on international telephone costs and high use mobile packages as well as low speed broadband. Over the past three years internet subscriptions have trebled and broadband speeds have doubled. However the economic importance of this area demands continued progress and further improvements in quality and reduction in cost will be needed. It will be important to ensure a high standard of international connectivity and to enhance the IT capacity of the network. Overall, the policy framework provides that investment in broadband infrastructure is primarily a matter for the market. State intervention is aimed at improving our digital skills, enhancing our international connectivity and addressing market failures where they exist. Action Points ƒ The regulatory regime will facilitate a collaborative approach to private investment. ƒ The Next Generation Broadband Taskforce will work with industry to enhance the business case for investment in NGN (Next Generation Network) delivery. ƒ Appropriate State investment will be undertaken in cases of market failure. ƒ The use of state infrastructure for the roll out of NGN networks will be maximised. 2.2.3 Professional Services In general, the cost of services to businesses has fallen, but this is not uniform across all professions. Although accounting costs have fallen, the cost of legal services remains high. Action Points ƒ Competition in the professions will be promoted and overseen by an independent figure, reporting regularly to Government. ƒ The Government will identify further ways to tackle increases in insurance costs, building on achievements of the Personal Injuries Assessment Board. ƒ All the restrictions on appropriately trained General Practitioners who wish to hold GMS contracts will be abolished. ƒ Provide for a more structured approach to mediation in the legal system and promote further the use of Alternative Dispute Resolution taking into account recommendations of the Law Reform Commission in its Final Report 2010 on the subject. ƒ A package of measures to reduce legal costs will be implemented, including o increased use of tendering by the State; o prioritising publication and enactment of the Legal Costs Bill; and o additional proposals for legislation to reduce legal costs, drawing on the recommendations of the Legal Costs Working Group and the Competition Authority. o Provide for increased use of arbitration and mediation. 33
  • 34. 2.2.4 Office Space/Property The construction cost of prime industrial sites fell by 14% between 2008 and 2009. Notwithstanding this reduction, costs in Ireland are still among the highest benchmarked by the NCC. The same applies to industrial rental costs, though office rental costs are now relatively competitive with a reduction of 18% recorded in 2009. There is scope for further improvement in this area. Action Points ƒ The proposals of the Working Group on Transparency in Commercial Rent Reviews will be implemented. ƒ The Office of Public Works will lead a coordinated effort to reduce office rents by up to 15% and review the efficiency of property arrangements across the public sector. ƒ Proposals will be brought to Government for legislation to overhaul and streamline the property revaluation process. The possibility of secondment of staff from local authorities is being explored. 2.2.5 Efficiency in Public Administration The Government charges for delivering services such as local government utilities and business administration. In addition, companies incur indirect costs in complying with regulations (health and safety, financial etc). Companies also incur costs in searching for business support services and in accessing similar services from multiple State providers. The Government will take specific steps to reduce the cost base for the private sector. This is part of the Public Sector Transformation programme (including the Croke Park agreement mechanisms) outlined in Chapter 4. The efficiency recommendations of the Local Government Efficiency Review Group will also play a role in streamlining administration. The Government will take the following steps to improve public administration for the benefit of business customers: Action points ƒ The 15 day prompt payment rule will be extended beyond Government Departments to the wider public sector. ƒ Over the duration of the plan, increases in government administrative charges8 will be avoided, and the scope for reductions examined where possible. ƒ The targeted 25% reduction of the regulatory burden on business will be achieved by end-2011. ƒ Local Authorities will be required to improve their efficiency, including through implementing relevant recommendations of the Local Government Efficiency Group, to reduce where possible, the level of rates charged to businesses. 8 This excludes levies payable by entities regulated by economic regulators e.g. ComReg, Commission for Energy Regulation, Central Bank etc. 34
  • 35. 2.3 Removing Barriers to Employment Creation and Disincentives to Work The central objective of this plan is to create the conditions for growing jobs and tackling unemployment. Although productivity and efficient use of resources will be important for economic recovery, unit labour costs must also be maintained at competitive levels. Labour costs are the key element in overall cost competitiveness. Labour costs also affect the cost of other inputs to the enterprise sector and play a critical role in influencing employment levels. A process of adjustment is underway: in 2009 there was a 6.75% improvement in unit labour costs vis-à-vis the euro area as illustrated in Figure 2.2. Figure 2.2 Change in unit labour costs, 2009 -4-20246810 euro areaIrelandBelgiumGermanyGreeceSpainFranceItalyCyprusLuxembourgMaltaNetherlandsAustriaPortugalSloveniaSlovakiaFinlandper cent change Source EU Commission Spring 2010 Forecast The official unemployment rate for the second quarter of 2010 was 13.6%. The extent of the unemployment problem varies geographically with the mid western and south eastern regions registering higher unemployment rates at 16.3% and 18.1% respectively. Similarly, there are differences across sectors with the industry, construction and retail sectors recording the largest percentage decreases in employment numbers. Given the scale of the unemployment problem, any legislative and policy obstacles to job creation must be removed. The State must also act to enhance the incentives to the unemployed to take up job opportunities. This combination of State interventions in the labour market must be carried out in an integrated manner. 2.3.1 Dismantling Barriers to Employment and Facilitating Employment Growth Introduced in 2000 at a rate of €5.59, the National Minimum Wage (NMW) is currently set at €8.65. It has been increased six times since its introduction and is now 55% higher than its original level. By end 2010 the consumer price index is forecast to have increased by approximately 28% since 2001. 35
  • 36. Our NMW is the second highest in absolute terms compared to other EU countries and is sixth when expressed in purchasing power terms. As a percentage of the average gross monthly earnings, Ireland has the sixth highest NMW. The majority of minimum wage workers are employed in textiles, retailing, hotels, restaurants and bars, and personal services. Employment in occupations covered by the NMW is typically dependant on domestic demand and is likely to be sensitive to changes in the wage rate. Given the desirability of growing employment in those sectors where significant jobs losses have occurred, and the importance of encouraging recruitment of young people in particular, the level of the minimum wage has significance beyond the numbers currently employed at that rate. Where a NMW is imposed at a level higher than the equilibrium wage rate, unemployment will result. Some workers will be willing to work for a wage lower than NMW but employers are restricted from providing these job opportunities. Other negative effects include: ƒ Acting as a barrier for younger9 and less skilled workers to enter the labour force and take up jobs; ƒ Preventing SME’s from adjusting wage costs downward in order to maintain viability and improve competitiveness; and ƒ Reducing the capacity of the services sector to generate additional activity and employment through lower prices for consumers. The NMW was introduced during a period of sustained economic growth and rapid wage increases. Our circumstances have changed dramatically in the last three years. Price levels have reduced and earnings have adjusted downwards to help to preserve jobs. A reduction in the minimum wage level – as proposed by the OECD10 - can also be expected to remove a barrier to job creation. Therefore the Government have decided to introduce legislation to reduce the rate of the minimum wage by €1 per hour, or 12% to €7.6511. Action point ƒ The minimum wage will be reduced by €1 to €7.65. The new rate will remain in the top tier of EU minimum wage rates. Other regulated wage levels exist in certain sectors where employers and workers reach specific agreements about pay and conditions of employment, either through Registered Employment Agreements (REA’s) or Employment Regulation Orders (ERO’s), following consideration by Joint 9 According to CSO QNHS Quarter 2 2010, youth unemployment is 25.8% for the age group 20 to 24. 10 OECD (2009) Economic Survey – Ireland. 11 Proportionate reductions of 12% will also take place for minimum wage rates related to employees under 18 years of age and employees aged 18 or over in their first and second years of employment. 36
  • 37. Labour Committees. The terms in each case are protected by legislation. These agreements apply mainly to the agricultural, catering, construction and electrical contracting sectors. Pay rates are typically above the NMW and in some cases incorporate significantly higher wage levels. Both types of agreements constitute another form of labour market rigidity by preventing wage levels from adjusting. This in turn affects the sustainability of existing jobs and may also prevent the creation of new jobs, particularly for younger people disproportionately affected by the employment crises who form part of the labour force for these sectors. Consistent with a proposed reduction in the minimum wage, it is important that any barriers to employment are removed in these regulated sectors given their significance for the traded sector of the economy. There is also a need to ensure these agreements are fit-for-purpose in the current economic climate. There is a strong case for removing anomalies and obsolete provisions, so as to have a more streamlined, transparent and flexible model of wage setting. Three particular aspects of these arrangements have been identified as potentially problematic from a competitiveness and job creation perspective. These are: o Specific cost-increasing conditions such as pay rates for Sunday working; o Geographical divisions which can sometimes appear arbitrary; and o Inflexibility in measures for adjusting agreements in line with broader labour market developments. These issues must be addressed in order to assist competitiveness and employment growth in these important sectors. Action Point ƒ A review of the framework REA and ERO arrangements will be undertaken by the Minister for Enterprise Trade and Innovation, to be finalised within three months. 2.3.2 Removing Disincentives to Work Social policy must continue to protect the most vulnerable in society and provide supports to those in unemployment. At the same time, our social protection system must not contain poverty traps and must not discourage those who are unemployed from returning to work. The jobseeker rate of social welfare payment almost doubled between 2001 and 2009 before being reduced in Budget 2010 to €196 per week. This rate of increase has had implications for replacement rates12 in the labour market which will also be impacted by the decision to reduce the minimum wage. 12 The replacement rates for given income levels measures the proportion of out of work benefits received when unemployed against take home pay if in work. 37
  • 38. The persistence of high replacement rates can act as a major disincentive to work. Replacement rates of the order of 70% can be considered to be a barrier to employment. Analysis of estimated replacement rates for different earning levels and family types undertaken by the Department of Finance in late 2009 revealed the following findings: ƒ In general, single people face high replacement rates at the earnings level of the NMW, but the issue does not arise for higher earning single people; ƒ Couples where both are not working face high replacement rates at income levels up to the average industrial wage; ƒ Couples with children where both are not working have higher replacement rates again; and ƒ One-parent families have low replacement rates except in cases where out-of-work income is supplemented by earnings from the community employment scheme. Rate reductions have been introduced for new jobseeker claimants under age 25 and without child dependants. The Qualified Adult rates applicable were also reduced. These rate reductions have had a significant downward impact on replacement rates for such claimants. In some cases, the effects of the proposed changes to the minimum wage will be to increase replacement rates. OECD analysis has pointed to a danger that the high rate of unemployment in Ireland could be sustained owing to weaknesses in activation policy and high replacement rates for those on below average wage levels13. Therefore, there is a need to strengthen activation measures and to ensure that replacement rates are not acting as a barrier for any cohorts in unemployment. Achieving the right balance between the level of the NMW, labour legislation, social welfare rates, taxation and levels of activation is crucial to avoiding work disincentives. High replacement rates need not necessarily give rise to high unemployment provided there is an effective activation strategy in place. Given the current dynamics in the labour market however, high replacements rates are viewed as a disincentive to work. Action Points ƒ Reform of the welfare system will reduce unemployment traps by incentivising employment and discouraging a long term attachment to the social welfare system. ƒ This will assist in removing disincentives to work and will be complemented by strengthened activation measures. 2.4 Re-orienting Activation Measures International evidence indicates that appropriate activation measures can increase the incentive to work, reduce the number of long term unemployed and increase aggregate employment. In particular, 13 OECD (2009) Economic Survey of Ireland. 38
  • 39. activation measures can help ensure that those at risk of long term unemployment14 are ready to avail of employment opportunities when economic recovery takes hold. It is critical that the unemployed are equipped with relevant skills and kept close to the labour market. There is a need for appropriate upskilling or reskilling so that the labour market can access the skills it requires. Elements of the Government’s Activation Policy Increased levels of engagement with the unemployed ƒ The National Employment Action Plan15 has increased substantially the number of interviews provided for the unemployed. ƒ Group interviews for the unemployed will be held after 3 months. Training/work experience places ƒ Significant numbers of additional places have been provided for education, training/work experience for the unemployed since 2008. ƒ The Work Placement Programme allows for up to 2,000 individuals to participate in work for periods of up to 9 months while in receipt of social welfare payments. ƒ Allocations from the Activation Fund (€20 million) and the European Globalisation Fund were used in 2010 to provide additional options to help people back to employment. Increased incentives for employers to create jobs ƒ The Employers’ PRSI scheme to encourage employers to recruit people who are unemployed was introduced in July 2010. Increased incentives for the unemployed to progress ƒ The targeted reductions in social welfare rates introduced in recent budgets have incentivised those under 25 to participate in education, training or work. ƒ Legislation has been put in place so that receipt of benefit payments will be conditional on participation in the National Employment Action Plan. The Government is improving the efficiency of activation structures by streamlining the Public Employment Services. The Community Employment Scheme and the FÁS employment services are being merged with the Department of Social Protection providing a single employment service for jobseekers. This will facilitate central monitoring and control of conditionality measures. 14 This includes former employees in declining sectors such as manufacturing and construction. 15 The Irish National Employment Action Plan was adopted by Government in response to the European Employment Guidelines. The Plan includes a commitment to a more systematic engagement of the Employment Services with the unemployed. Implementation of this commitment commenced in September, 1998. 39
  • 40. The scale of the unemployment problem justifies the introduction of further measures to improve national activation policies as recommended by the OECD. The focus must be on the provision of structured pathways to employment for those on the Live Register. Action Points A strengthened framework of additional activation measures will include: ƒ A community work placement programme. ƒ A Skills Development and Internship Programme. ƒ Additional placements on the work placement scheme. ƒ The extension of the PRSI Employers Exemption Scheme to end-2011. 2.5 Enterprise Policy - Investment, Exports and Sectoral Performance 2.5.1 Sectoral Outlook Figure 2.3 presents data on the sectoral contributions to gross value added (GVA) in the economy and how these have changed in recent years. GVA declined sharply in the Industry (including building) category. Value added also decreased in the distribution, transport and communication and other services sectors, reflecting the reduction in domestic demand and the impact of the financial crisis. Figure 2.3 GVA by Sector, 2007 and 2009 010,00020,00030,00040,00050,00060,00070,00080,00090,000Agriculture, forestryand fishingIndustry (includingbuilding) Distribution, transport andcommunicationPublic administrationand defenceOther services(including rent) Gross value added, constatnt prices €m 20072009 Source: CSO The largest falls occurred in 2009 when GDP decreased by 7.6%. In that year, ƒ industry and building output decreased by 7.8%; ƒ distribution, transport and communications output decreased by 9.3%; ƒ other services output decreased by 2.3%; and ƒ public administration and defence output decreased by 0.5%. 40
  • 41. Figure 2.4 presents the sectoral distribution of employment in the economy comparing data for Quarter 2 2010 and Quarter 2 2007.16 Not surprisingly, construction is the most affected sector. Encouragingly, employment increased in high value sectors such as information and communications technology and financial, insurance and real estate activities. Figure 2.4 Employment by sector, 2007 and 2010 050100150200250300350 Agriculture, Forestry & FishingIndustryConstructionWholesale & RetailTrade;repair of motorvehicles and motorcyclesTransportation and storageAccommodation and foodservice activitiesInformation andcommunicationFinancial, insurance andreal estate activitiesProfessional, scientific andtechnical activitiesAdministrative and supportservice activitiesPublic administration anddefence;compulsory socialsecurityEducationHuman health and socialwork activitiesOther NACE activitiespersons '000s Apr - Jun 07Apr - Jun 10 Source: CSO 2.5.2 Investment and Innovation Attracting Foreign Direct Investment (FDI) The attraction of FDI has driven growth in the Irish economy in the past and can do so again in the next phase of Ireland’s economic development. Foreign investment in Ireland is substantial in nature: IDA supported companies alone sustain over 135,000 jobs. Manufacturing of pharmaceuticals and medical devices, financial services and the provision of ICT and professional services are the key sectors. As noted in Chapter 1, our performance in this area has remained robust throughout the recession. Further steps can be taken to copper-fasten Ireland’s attractiveness as a location for internationally mobile investment. The implementation of the Government’s Trade, Tourism and Investment Strategy will encourage niche areas such as converging technologies to make Ireland a strategic base for multinational corporations (MNC’s). Government Departments will seek to form partnerships with multinational companies based in Ireland to develop, trial and roll out innovations which improve services in Ireland and can also have worldwide application. Supporting Indigenous Business Indigenous businesses, including large firms, high potential start ups and SME’s, are a major source of employment. They provide essential goods and services nationwide and are pivotal to the success of 16 The sectoral classifications by which GVA and employment data are published do not match exactly. 41
  • 42. larger enterprises. They are also successful exporters in their own right. The range of competitiveness measures and labour market reforms outlined earlier will assist these firms through these difficult times and lead ultimately to growth. A number of further steps will be taken to encourage small business development. Action Points ƒ The Business Expansion Scheme will be overhauled and improved. Full details are contained in Chapter 6. ƒ Enterprise agencies will work with SMEs to improve performance, productivity and competitiveness, assist them in developing exports in new and existing markets, help them to access public procurement opportunities and help firms develop a greater online presence. ƒ Core R&D supports and the innovation voucher system will continue to help small firms acquire cost-effective R&D and to move up the value-chain. ƒ The Government will investigate the potential for providing access to vacant or under-utilised public property for entrepreneurs or business start-ups to use as incubation centres. ƒ The Government is undertaking an overhaul of bankruptcy legislation. ƒ The 15 day prompt payment rule will be extended beyond Government Departments to the wider public sector. Making Ireland a Global Innovation Hub The Innovation Taskforce reported in March 2010 with recommendations to make Ireland a Global Innovation Hub. The aim is to make Ireland: ƒ The best place in Europe to turn research and knowledge into products and services; ƒ The best place in Europe to start and grow an innovative company; ƒ The best place to relocate or expand and scale an SME; and ƒ The best place in Europe for research-intensive multinationals to collaborate with each other and with clusters of small companies. In support of these goals, a number of important recommendations made by the innovation taskforce will be delivered. Action Points ƒ Innovation Fund Ireland will attract international venture capital fund managers to Ireland, making their expertise, experience and network available to our enterprises. ƒ IDA will introduce the European Accelerator Programme to attract fast growing firms to locate their European HQ in Ireland. 42