
Recommended
More Related Content
Viewers also liked
Images
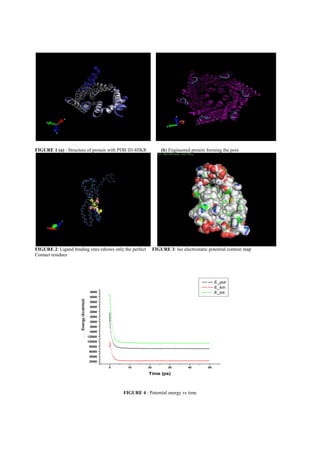
- 1. FIGURE 1 (a) : Structure of protein with PDB ID 4HKR (b) Engineered protein forming the pore FIGURE 2: Ligand binding sites (shows only the perfect FIGURE 3: Iso electrostatic potential contour map Contact residues FIGURE 4 : Potential energy vs time 0 10 20 30 40 50 2000 4000 6000 8000 10000 12000 14000 16000 18000 20000 22000 24000 26000 28000 30000 E_pot E_kin E_tot Enegy(kcal/mol) Time (ps) Energy(kcal/mol)
- 2. FIGURE 5. Water-ion model of the ion channel protein with PDB ID 4HKR