SlideShare a Scribd company logo
1 of 2
Download to read offline
Facebook – Revenue Growth By Source
Q2-2011 to Q3-2013
2.500

2.000

1.500

1.000

500

0
Q2-11

Q3-11

Q4-11

Q1-12

Q2-12

Advertising Revenue

Q3-12

Q4-12

Payments & Other Revenue

Q1-13

Q2-13

Q3-13
Need more metrics, statistics and
performance indicators on digital
leaders?
Visit: www.digital-quarterly.com

More Related Content

More from Self Employed

Apple Average Revenue By Device Sold 2007 to 2013
Apple Average Revenue By Device Sold 2007 to 2013Apple Average Revenue By Device Sold 2007 to 2013
Apple Average Revenue By Device Sold 2007 to 2013Self Employed
 
eBay Marketplace Top-Rated Sellers Share Of Total Sales 2012q3 to 2014q1
eBay Marketplace Top-Rated Sellers Share Of Total Sales 2012q3 to 2014q1eBay Marketplace Top-Rated Sellers Share Of Total Sales 2012q3 to 2014q1
eBay Marketplace Top-Rated Sellers Share Of Total Sales 2012q3 to 2014q1Self Employed
 
Apple Distribution Of Devices Sold 2007 to 2013
Apple Distribution Of Devices Sold 2007 to 2013Apple Distribution Of Devices Sold 2007 to 2013
Apple Distribution Of Devices Sold 2007 to 2013Self Employed
 
Amazon Kindle Direct Publishing Revenue Per Borrow 2011 to Q32013
Amazon Kindle Direct Publishing Revenue Per Borrow 2011 to Q32013Amazon Kindle Direct Publishing Revenue Per Borrow 2011 to Q32013
Amazon Kindle Direct Publishing Revenue Per Borrow 2011 to Q32013Self Employed
 
Apple Annual Revenue By Product 2007 to 2013
Apple Annual Revenue By Product 2007 to 2013Apple Annual Revenue By Product 2007 to 2013
Apple Annual Revenue By Product 2007 to 2013Self Employed
 
Facebook Monthly Active User Growth By Region 2011 to 2013 QQ
Facebook Monthly Active User Growth By Region 2011 to 2013 QQFacebook Monthly Active User Growth By Region 2011 to 2013 QQ
Facebook Monthly Active User Growth By Region 2011 to 2013 QQSelf Employed
 
Amazon Invested Capital As Percent Of Revenue 2009 to 2013 QQ
Amazon Invested Capital As Percent Of Revenue 2009 to 2013 QQAmazon Invested Capital As Percent Of Revenue 2009 to 2013 QQ
Amazon Invested Capital As Percent Of Revenue 2009 to 2013 QQSelf Employed
 
Apple Cumulative Unit Sales Per Quarter 2007 to 2013
Apple Cumulative Unit Sales Per Quarter 2007 to 2013Apple Cumulative Unit Sales Per Quarter 2007 to 2013
Apple Cumulative Unit Sales Per Quarter 2007 to 2013Self Employed
 
Linkedin Corporate Customers Plus Growth Rate 2010 to 2013
Linkedin Corporate Customers Plus Growth Rate 2010 to 2013Linkedin Corporate Customers Plus Growth Rate 2010 to 2013
Linkedin Corporate Customers Plus Growth Rate 2010 to 2013Self Employed
 
Linkedin Advertising Revenue Per Unique Visitor 2010 to 2013
Linkedin Advertising Revenue Per Unique Visitor 2010 to 2013Linkedin Advertising Revenue Per Unique Visitor 2010 to 2013
Linkedin Advertising Revenue Per Unique Visitor 2010 to 2013Self Employed
 
Amazon Invested Capital Sequential Growth 2009 to 2013
Amazon Invested Capital Sequential Growth 2009 to 2013Amazon Invested Capital Sequential Growth 2009 to 2013
Amazon Invested Capital Sequential Growth 2009 to 2013Self Employed
 
Linkedin Revenue per Corporate Customer 2010 to 2013
Linkedin Revenue per Corporate Customer 2010 to 2013Linkedin Revenue per Corporate Customer 2010 to 2013
Linkedin Revenue per Corporate Customer 2010 to 2013Self Employed
 
Google Chrome Active Users 2009 to 2013
Google Chrome Active Users 2009 to 2013Google Chrome Active Users 2009 to 2013
Google Chrome Active Users 2009 to 2013Self Employed
 
Apple iPad Sales by Primary Model 2010 to 2013
Apple iPad Sales by Primary Model 2010 to 2013Apple iPad Sales by Primary Model 2010 to 2013
Apple iPad Sales by Primary Model 2010 to 2013Self Employed
 
Apple Revenue Distribution by Product 2007 to 2013
Apple Revenue Distribution by Product 2007 to 2013Apple Revenue Distribution by Product 2007 to 2013
Apple Revenue Distribution by Product 2007 to 2013Self Employed
 
Facebook MAU versus DAU Ratio 2011 to 2013
Facebook MAU versus DAU Ratio 2011 to 2013Facebook MAU versus DAU Ratio 2011 to 2013
Facebook MAU versus DAU Ratio 2011 to 2013Self Employed
 
Facebook Monthly Mobile Active Users 2011 to 2013
Facebook Monthly Mobile Active Users 2011 to 2013Facebook Monthly Mobile Active Users 2011 to 2013
Facebook Monthly Mobile Active Users 2011 to 2013Self Employed
 
PayPal Revenue Per Active Account 2008 to 2013 (Per Quarter)
PayPal Revenue Per Active Account 2008 to 2013 (Per Quarter)PayPal Revenue Per Active Account 2008 to 2013 (Per Quarter)
PayPal Revenue Per Active Account 2008 to 2013 (Per Quarter)Self Employed
 
Apple App Store Available Apps 2008 to 2013
Apple App Store Available Apps 2008 to 2013Apple App Store Available Apps 2008 to 2013
Apple App Store Available Apps 2008 to 2013Self Employed
 
PayPal Net Revenue Per Payment 2008 to 2013
PayPal Net Revenue Per Payment 2008 to 2013PayPal Net Revenue Per Payment 2008 to 2013
PayPal Net Revenue Per Payment 2008 to 2013Self Employed
 

More from Self Employed (20)

Apple Average Revenue By Device Sold 2007 to 2013
Apple Average Revenue By Device Sold 2007 to 2013Apple Average Revenue By Device Sold 2007 to 2013
Apple Average Revenue By Device Sold 2007 to 2013
 
eBay Marketplace Top-Rated Sellers Share Of Total Sales 2012q3 to 2014q1
eBay Marketplace Top-Rated Sellers Share Of Total Sales 2012q3 to 2014q1eBay Marketplace Top-Rated Sellers Share Of Total Sales 2012q3 to 2014q1
eBay Marketplace Top-Rated Sellers Share Of Total Sales 2012q3 to 2014q1
 
Apple Distribution Of Devices Sold 2007 to 2013
Apple Distribution Of Devices Sold 2007 to 2013Apple Distribution Of Devices Sold 2007 to 2013
Apple Distribution Of Devices Sold 2007 to 2013
 
Amazon Kindle Direct Publishing Revenue Per Borrow 2011 to Q32013
Amazon Kindle Direct Publishing Revenue Per Borrow 2011 to Q32013Amazon Kindle Direct Publishing Revenue Per Borrow 2011 to Q32013
Amazon Kindle Direct Publishing Revenue Per Borrow 2011 to Q32013
 
Apple Annual Revenue By Product 2007 to 2013
Apple Annual Revenue By Product 2007 to 2013Apple Annual Revenue By Product 2007 to 2013
Apple Annual Revenue By Product 2007 to 2013
 
Facebook Monthly Active User Growth By Region 2011 to 2013 QQ
Facebook Monthly Active User Growth By Region 2011 to 2013 QQFacebook Monthly Active User Growth By Region 2011 to 2013 QQ
Facebook Monthly Active User Growth By Region 2011 to 2013 QQ
 
Amazon Invested Capital As Percent Of Revenue 2009 to 2013 QQ
Amazon Invested Capital As Percent Of Revenue 2009 to 2013 QQAmazon Invested Capital As Percent Of Revenue 2009 to 2013 QQ
Amazon Invested Capital As Percent Of Revenue 2009 to 2013 QQ
 
Apple Cumulative Unit Sales Per Quarter 2007 to 2013
Apple Cumulative Unit Sales Per Quarter 2007 to 2013Apple Cumulative Unit Sales Per Quarter 2007 to 2013
Apple Cumulative Unit Sales Per Quarter 2007 to 2013
 
Linkedin Corporate Customers Plus Growth Rate 2010 to 2013
Linkedin Corporate Customers Plus Growth Rate 2010 to 2013Linkedin Corporate Customers Plus Growth Rate 2010 to 2013
Linkedin Corporate Customers Plus Growth Rate 2010 to 2013
 
Linkedin Advertising Revenue Per Unique Visitor 2010 to 2013
Linkedin Advertising Revenue Per Unique Visitor 2010 to 2013Linkedin Advertising Revenue Per Unique Visitor 2010 to 2013
Linkedin Advertising Revenue Per Unique Visitor 2010 to 2013
 
Amazon Invested Capital Sequential Growth 2009 to 2013
Amazon Invested Capital Sequential Growth 2009 to 2013Amazon Invested Capital Sequential Growth 2009 to 2013
Amazon Invested Capital Sequential Growth 2009 to 2013
 
Linkedin Revenue per Corporate Customer 2010 to 2013
Linkedin Revenue per Corporate Customer 2010 to 2013Linkedin Revenue per Corporate Customer 2010 to 2013
Linkedin Revenue per Corporate Customer 2010 to 2013
 
Google Chrome Active Users 2009 to 2013
Google Chrome Active Users 2009 to 2013Google Chrome Active Users 2009 to 2013
Google Chrome Active Users 2009 to 2013
 
Apple iPad Sales by Primary Model 2010 to 2013
Apple iPad Sales by Primary Model 2010 to 2013Apple iPad Sales by Primary Model 2010 to 2013
Apple iPad Sales by Primary Model 2010 to 2013
 
Apple Revenue Distribution by Product 2007 to 2013
Apple Revenue Distribution by Product 2007 to 2013Apple Revenue Distribution by Product 2007 to 2013
Apple Revenue Distribution by Product 2007 to 2013
 
Facebook MAU versus DAU Ratio 2011 to 2013
Facebook MAU versus DAU Ratio 2011 to 2013Facebook MAU versus DAU Ratio 2011 to 2013
Facebook MAU versus DAU Ratio 2011 to 2013
 
Facebook Monthly Mobile Active Users 2011 to 2013
Facebook Monthly Mobile Active Users 2011 to 2013Facebook Monthly Mobile Active Users 2011 to 2013
Facebook Monthly Mobile Active Users 2011 to 2013
 
PayPal Revenue Per Active Account 2008 to 2013 (Per Quarter)
PayPal Revenue Per Active Account 2008 to 2013 (Per Quarter)PayPal Revenue Per Active Account 2008 to 2013 (Per Quarter)
PayPal Revenue Per Active Account 2008 to 2013 (Per Quarter)
 
Apple App Store Available Apps 2008 to 2013
Apple App Store Available Apps 2008 to 2013Apple App Store Available Apps 2008 to 2013
Apple App Store Available Apps 2008 to 2013
 
PayPal Net Revenue Per Payment 2008 to 2013
PayPal Net Revenue Per Payment 2008 to 2013PayPal Net Revenue Per Payment 2008 to 2013
PayPal Net Revenue Per Payment 2008 to 2013
 

Digital Quarterly: Facebook Revenue by revenue source - 2013 q3

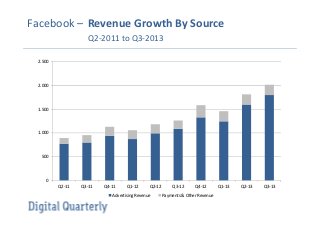
  • 1. Facebook – Revenue Growth By Source Q2-2011 to Q3-2013 2.500 2.000 1.500 1.000 500 0 Q2-11 Q3-11 Q4-11 Q1-12 Q2-12 Advertising Revenue Q3-12 Q4-12 Payments & Other Revenue Q1-13 Q2-13 Q3-13
  • 2. Need more metrics, statistics and performance indicators on digital leaders? Visit: www.digital-quarterly.com