Deutsche EuroShop | Quarterly Statement 9M 2021
•
0 likes•76 views

Deutsche EuroShop | Quarterly Statement 9M 2021

Recommended
Recommended
More Related Content
What's hot
What's hot (20)
Similar to Deutsche EuroShop | Quarterly Statement 9M 2021
Similar to Deutsche EuroShop | Quarterly Statement 9M 2021 (20)
More from Deutsche EuroShop AG
More from Deutsche EuroShop AG (20)
Recently uploaded
Recently uploaded (20)
Deutsche EuroShop | Quarterly Statement 9M 2021
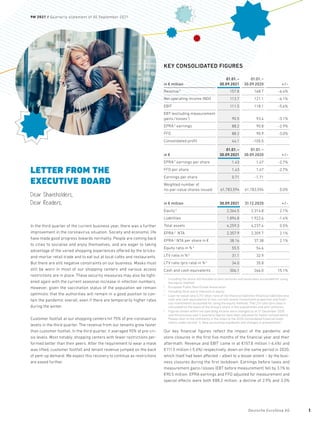
- 1. LETTER FROM THE EXECUTIVE BOARD Dear Shareholders, Dear Readers, In the third quarter of the current business year, there was a further improvement in the coronavirus situation. Society and economic life have made good progress towards normality. People are coming back to cities to socialise and enjoy themselves, and are eager to taking advantage of the varied shopping experiences offered by the bricks- and-mortar retail trade and to eat out at local cafés and restaurants. But there are still negative constraints on our business. Masks must still be worn in most of our shopping centers and various access restrictions are in place. These security measures may also be tight- ened again with the current seasonal increase in infection numbers. However, given the vaccination status of the population we remain optimistic that the authorities will remain in a good position to con- tain the pandemic overall, even if there are temporarily higher rates during the winter. Customer footfall at our shopping centers hit 75% of pre-coronavirus levels in the third quarter. The revenue from our tenants grew faster than customer footfall. In the third quarter, it averaged 90% of pre-cri- sis levels. Most notably, shopping centers with fewer restrictions per- formed better than their peers. After the requirement to wear a mask was lifted, customer footfall and tenant revenue jumped on the back of pent-up demand. We expect this recovery to continue as restrictions are eased further. KEY CONSOLIDATED FIGURES in € million 01.01. – 30.09.2021 01.01. – 30.09.2020 +/- Revenue5 157.8 168.7 -6.4% Net operating income (NOI) 113.7 121.1 -6.1% EBIT 111.5 118.1 -5.6% EBT (excluding measurement gains/losses1 ) 90.5 93.4 -3.1% EPRA 2 earnings 88.2 90.8 -2.9% FFO 88.2 90.9 -3.0% Consolidated profit 44.1 -105.5 in € 01.01. – 30.09.2021 01.01. – 30.09.2020 +/- EPRA 2 earnings per share 1.43 1.47 -2.7% FFO per share 1.43 1.47 -2.7% Earnings per share 0.71 -1.71 Weighted number of no-par-value shares issued 61,783,594 61,783,594 0.0% in € million 30.09.2021 31.12.2020 +/- Equity3 2,364.5 2,314.8 2.1% Liabilities 1,894.8 1,922.6 -1.4% Total assets 4,259.3 4,237.4 0.5% EPRA 2 NTA 2,357.9 2,309.7 2.1% EPRA 2 NTA per share in € 38.16 37.38 2.1% Equity ratio in % 3 55.5 54.6 LTV ratio in % 4 31.1 32.9 LTV ratio (pro rata) in % 4 34.0 35.8 Cash and cash equivalents 306.1 266.0 15.1% 1 Including the share attributable to joint ventures and associates accounted for using the equity method 2 European Public Real Estate Association 3 Including third-party interests in equity 4 Loan-to-value ratio (LTV ratio): ratio of net financial liabilities (financial liabilities less cash and cash equivalents) to non-current assets (investment properties and finan- cial investments accounted for using the equity method). The LTV ratio (pro rata) is calculated on the basis of the Group’s share in the subsidiaries and joint ventures. 5 Figures shown within net operating income were changed as at 31 December 2020 and the previous year’s quarterly figures have been adjusted for easier comparability. Please refer to the comments in the notes to the 2020 consolidated financial state- ments under section “4. New accounting standards and changes in presentation”. Our key financial figures reflect the impact of the pandemic and store closures in the first five months of the financial year and their aftermath. Revenue and EBIT came in at €157.8 million (-6.4%) and €111.5 million (-5.6%) respectively, down on the same period in 2020, which itself had been affected – albeit to a lesser extent – by the busi- ness closures during the first lockdown. Earnings before taxes and measurement gains/losses (EBT before measurement) fell by 3.1% to €90.5 million. EPRA earnings and FFO adjusted for measurement and special effects were both €88.2 million, a decline of 2.9% and 3.0% 9M 2021 / Quarterly statement of 30 September 2021 Deutsche EuroShop AG 1
- 2. respectively on the previous year. The collection ratio continued to improve as the reopenings progressed, rising to 98% in the third quar- ter. Group liquidity made further gains since the start of the year, aided by lower capital expenditure during the closure periods and payments for investment loans. We have reached agreements with many of our tenants to mitigate the negative effects and after-effects of the lockdown phases on the bricks-and-mortar retail trade. In addition, the recent significant improvement in government assistance programmes has afforded retailers some relief, which is helping to safeguard our properties. Our occupancy rate is currently 94.7%, compared with 95.4% at the end of 2020. In this situation, high priority has been given to re-let- ting expiring leases or coronavirus-related vacancies. By the summer, we were able to successfully conclude all pending refi- nancing transactions for the current financial year at attractive condi- tions. A total of four loans with a combined volume of €191 million have been extended or refinanced with our banking partners for a further ten years. There is good interest in the banking market for the current upcoming refinancing in 2022. During this phase, we will continue to coordinate with our financing banks and savings banks on an ongoing basis and in a spirit of trust. Based on the current situation, we are still expecting funds from oper- ations (FFO) of €1.70 to €1.90 per share for the 2021 financial year (2020: €2.00). This is based on a sustained ability to manage the pan- demic situation without fresh store closures or significant restrictions on center operations, a further recovery in tenant revenues, especially in the upcoming Christmas business period, as well as a stabilisation in the collection ratio at the recently significantly improved level. We thank you for your continued trust. Hamburg, November 2021 Wilhelm Wellner Olaf Borkers Wilhelm Wellner and Olaf Borkers 9M 2021 / Quarterly statement of 30 September 2021 Deutsche EuroShop AG 2
- 3. RESULTS OF OPERATIONS RESULTS OF OPERATIONS in € thousand 01.01. – 30.09.2021 01.01. – 30.09.2020 (adjusted) 1 Change +/- in % Revenue 157,815 168,689 -10,874 -6.4% Operating and administrative costs for property -23,551 -20,853 -2,698 -12.9% Write-downs and derecognition of receivables -20,537 -26,768 6,231 23.3% NOI 113,727 121,068 -7,341 -6.1% Other operating income 3,521 2,393 1,128 47.1% Other operating expenses -5,775 -5,390 -385 -7.1% EBIT 111,473 118,071 -6,598 -5.6% At-equity profit/loss 21,427 -31,934 Measurement gains/losses (at equity) -2,652 49,893 Deferred taxes (at equity) 14 -88 At-equity (operating) profit/loss 18,789 17,871 918 5.1% Interest expense -29,821 -32,746 2,925 8.9% Profit/loss attributable to limited partners -9,911 -9,802 -109 -1.1% Other financial gains or losses 5 8 -3 -37.5% Financial gains or losses (excl. measurement gains/losses) -20,938 -24,669 3,731 15.1% EBT (excl. measurement gains/losses) 90,535 93,402 -2,867 -3.1% Measurement gains/losses -40,276 -171,450 Measurement gains/losses (at equity) 2,652 -49,893 Measurement gains/losses (including at-equity profit/loss) -37,624 -221,343 183,719 83.0% Taxes on income and earnings -2,291 -2,536 245 9.7% Deferred taxes -6,536 24,856 Deferred taxes (at equity) -14 88 Deferred taxes (including at equity) -6,550 24,944 -31,494 CONSOLIDATED PROFIT 44,070 -105,533 149,603 1 Figures shown within net operating income were changed as at 31 December 2020 and the previous year’s quarterly figures have been adjusted for easier comparability. Please refer to the comments in the notes to the 2020 consolidated financial statements under section “4. New accounting standards and changes in presentation”. 9M 2021 / Quarterly statement of 30 September 2021 Deutsche EuroShop AG 3
- 4. Revenue affected by the coronavirus pandemic Revenue for the reporting period came in at €157.8 million. On a like- for-like basis, this constituted a decrease of 6.4% compared with the same period last year (€168.7 million) due to the longer store closure periods compared with 2020. In our foreign markets, statutory regu- lations, among other things, provided for the temporary suspension of payment obligations under rental agreements for tenants affected by the closures. Other factors responsible for the decline in reve- nue, mainly due to the pandemic, included losses from tenants who encountered payment difficulties, lower revenue-linked rents as well as higher vacancy rates. Center operating expenses up on previous year due to higher non-apportionable ancillary costs Center operating costs of €23.6 million in the reporting period, mainly comprising center management fees, non-apportionable ancillary costs, land taxes, building insurance and maintenance, increased year on year by 12.9%. This was due to higher vacan- cy-related, non-apportionable ancillary costs, which could not be fully offset despite the timely introduction of targeted cost-cutting measures. Coronavirus-related impairments had a significant negative impact on the first nine months of the year Write-downs and the derecognition of receivables weighed heavily on the first three quarters of 2021, at €20.5 million (previous year: €26.8 million). The extent of the write-downs depended on the cur- rent status of negotiations with tenants regarding lockdown-related rent reductions as well as on tenant payment patterns. Write-downs and the derecognition of receivables in the report- ing period of €16.4 million took into account both the rental conces- sions already contractually agreed and the further rental conces- sions expected on receivables outstanding as at the reporting date. In addition, receivables had to be derecognised or written down indi- vidually (€4.1 million), in particular due to insolvency. Other operating income and expenses Other operating income, stemming primarily from the reversal of provisions, from income from rental receivables for which impair- ment losses had been recognised in previous years and from additional payments with respect to ancillary costs, amounted to €3.5 million, representing an increase on the previous year. In addi- tion, a one-off gain from the refund of a road expansion contribu- tion paid in 2018 in the amount of €0.5 million had a positive effect. Due to coronavirus-related higher consulting costs, other operating expenses, which mainly comprise general administrative costs and personnel costs, came in slightly higher than in the previous year at €5.8 million. EBIT lower than last year Earnings before interest and taxes (EBIT) were €111.5 million, down on the figure for the previous year (€118.1 million), due largely to the coronavirus-driven decline in revenue. Improvement in financial gains or losses excluding measurement effects At €-20.9 million, net financial gains or losses (excluding measure- ment gains/losses) were up on the same period of 2020 (€-24.7 mil- lion). As in the previous year, at-equity (operating) earnings were negatively impacted by coronavirus-related write-downs on rental receivables and revenue arrears; they amounted to €18.8 million, only slightly above the prior-year level (€17.9 million). The interest expenses of Group companies were reduced by a further €2.9 mil- lion. In addition to scheduled repayments, the better refinancing terms for the City-Arkaden Wuppertal, the Billstedt-Center and the City-Galerie Wolfsburg had a particularly positive effect here. The share of earnings attributable to limited partners decreased slightly (by €0.1 million) in line with the reduced EBIT. EBT (excluding measurement gains/losses) down as a result of the pandemic The improved net financial income (excluding measurement gains/ losses) was not enough to offset the decline in EBIT, with the result that EBT (excluding measurement gains/losses) fell year on year from €93.4 million to €90.5 million (-3.1%). Small net measurement loss in a changed market environment In the previous year, the coronavirus pandemic likewise had a sig- nificant negative impact on the measurement of the Group’s real estate assets in accordance with IAS 40. The impact of the ongo- ing pandemic continued to be felt even after retail and gastronomy were reopened subject to restrictions and led to a slight correction in property values. With market yields largely unchanged over the course of the financial year due to a dearth of market transactions, adjusted market rents played a major role here. The measurement loss of €37.6 million included a measurement gain of €2.7 million from the revaluation of an undeveloped and currently unused piece of land. Of this fall in value as at 30 September 2021, €-40.3 million after minority interests was attributable to the measurement of the real estate assets reported by the Group and €+2.7 million to the meas- urement of the real estate assets of joint ventures accounted for using the equity method. The average value of Group properties after ongoing investments was 0.5% lower as at the reporting date; the range of changes in market value was between -7.0% and +2.9%. The occupancy rate was 94.7% compared with 95.4% at the end of 2020. 9M 2021 / Quarterly statement of 30 September 2021 Deutsche EuroShop AG 4
- 5. Taxes on income and earnings Taxes on income and earnings fell to €2.3 million (previous year: €2.5 million) as a result of the decline in earnings. Deferred taxes resulted in an expense of €6.6 million (previous year: tax income of €24.9 million) owing to the write-downs of tax balance sheet values and the fall in value of real estate assets. EPRA earnings down; consolidated profit positive EPRA earnings, which exclude measurement gains/losses, fell slightly to €88.2 million or €1.43 per share, due mainly to the decline in revenue. At €44.1 million, consolidated profit jumped by €149.6 million year on year (€-105.5 million) due to the high meas- urement losses in the same period of the previous year, while earn- ings per share increased accordingly by €2.42, from €-1.71 to €0.71. EPRA EARNINGS 01.01. – 30.09.2021 01.01. – 30.09.2020 in € thousand per share in € in € thousand per share in € Consolidated profit 44,070 0.71 -105,533 -1.71 Measurement gains/ losses on investment properties1 37,624 0.61 221,343 3.58 Measurement gains/ losses on derivative financial instruments1 0 0.00 -88 0.00 Deferred tax adjust- ments pursuant to EPRA 2 6,550 0.11 -24,944 -0.40 EPRA EARNINGS 88,244 1.43 90,778 1.47 Weighted number of no-par-value shares issued 61,783,594 61,783,594 1 Including the share attributable to joint ventures and associates accounted for using the equity method 2 Relates to deferred taxes on investment properties and derivative financial instruments Development of funds from operations Funds from operations (FFO) are used to finance our ongoing invest- ments in portfolio properties, scheduled repayments on our long- term bank loans and as the basis for the distribution of dividends. Significant non-recurring effects that are not part of the Group’s operating activities are eliminated in the calculation of FFO. FFO declined slightly from €90.9 million to €88.2 million or by €0.04 per share to €1.43. As an income-based figure, FFO does not reflect the increase in outstanding rent receivables due to the coronavirus, with the result that it also necessary to analyse tenants’ payment behaviour expressed in the collection ratio (see below: Net assets and liquidity). In the first nine months up to the end of September 2021, this averaged 90%, although it reached 98% again in the third quarter. FUNDS FROM OPERATIONS 01.01. – 30.09.2021 01.01. – 30.09.2020 in € thousand per share in € in € thousand per share in € Consolidated profit 44,070 0.71 -105,533 -1.71 Measurement gains/ losses on investment properties1 37,624 0.61 221,343 3.58 Deferred taxes1 6,550 0.11 -24,944 -0.40 FFO 88,244 1.43 90,866 1.47 Weighted number of no-par-value shares issued 61,783,594 61,783,594 1 Including the share attributable to joint ventures and associates accounted for using the equity method 9M 2021 / Quarterly statement of 30 September 2021 Deutsche EuroShop AG 5
- 6. FINANCIAL POSITION AND NET ASSETS NET ASSETS AND LIQUIDITY The Deutsche EuroShop Group’s total assets increased slightly compared with the last reporting date, rising by €21.9 million to €4,259.3 million. The main reason for the change was the increase in cash and cash equivalents, which was offset by a decline in the market value of real estate and a coronavirus-related increase in receivables. in € thousand 30.09.2021 31.12.2020 Change Current assets 346,730 303,657 43,073 Non-current assets 3,912,541 3,933,724 -21,183 Current liabilities 206,622 211,169 -4,547 Non-current liabilities 1,688,148 1,711,441 -23,293 Equity (including third-party interests) 2,364,501 2,314,771 49,730 TOTAL ASSETS 4,259,271 4,237,381 21,890 Investment properties as at 30 September 2021: in € thousand 2021 2020 Carrying amount at 01.01. 3,437,145 3,822,786 Disposals of investment properties 0 -490 Recognised construction measures 8,963 15,053 Unrealised changes in fair value -40,389 -400,204 Carrying amount at 30.09. / 31.12. 3,405,719 3,437,145 Investment properties (IAS 40) were measured at fair value. As at 30 September 2021, measurements were performed by the appraiser JLL, as they had been on 30 June 2021 and 31 Decem- ber 2020. The discounted cash flow method (DCF) was used, as at 31 December 2020. Refer to the explanations on the DCF method in our Annual Report 2020 on p. 46 et seq. REVENUE in € million 9M 2021 157.8 -6.4% 9M 2020 168.7 EBIT in € million 9M 2021 -5.6% 111.5 9M 2020 118.1 * excluding measurement gains / losses EBT * in € million 9M 2021 -3.1% 90.5 9M 2020 93.4 FFO PER SHARE in € 9M 2021 -2.7% 9M 2020 1.47 1.43 9M 2021 / Quarterly statement of 30 September 2021 Deutsche EuroShop AG 6
- 7. The following overview shows the key assumptions used by JLL to determine the market values: Valuation parameters in % 30.09.2021 31.12.2020 Rate of rent increases1 1.41 1.00 Cost ratio 11.60 12.00 Discount rate 6.05 6.07 Capitalisation interest rate 5.24 5.25 1 Nominal rental growth rate in the DCF model over the measurement period of 10 years, taking into account inflation-related rent indexation and changes in the occu- pancy rate JLL’s market value assessment was carried out under uncertainty. For example, since the outbreak of the pandemic there have been very few market transactions in the shopping center real estate seg- ment. There was also a higher degree of uncertainty when estimat- ing future rental payments. JLL has accounted for this increased uncertainty by, among other things, adjusting revenue-linked rents, lower or stable market rents, and conservative re-letting assumptions. A 25 or 100 bp change in a material parameter (sensitivity analysis) of real estate appraisals would have the following pre-tax impact on measurement gains/losses (including the share attributable to at-equity consolidated companies): Sensitivity analysis – Valuation parameters Basis Change in parameter in € million in % Rate of rent increases 1.41 + 0.25% - 0.25% 157.8 -97.4 4.4 -2.7 Cost ratio 11.60 + 1.00% - 1.00% -33.8 39.3 -0.9 1.1 Discount rate 6.05 + 0.25% - 0.25% -69.7 66.8 -2.0 1.9 Capitalisation interest rate 5.24 + 0.25% - 0.25% -104.6 114.2 -2.9 3.2 The appraisal showed that the real estate portfolio had a net ini- tial yield before transaction costs of 5.77% compared with 5.73% in financial year 2020, and a net initial yield after transaction costs of 5.45% compared with 5.41% in 2020. The collection ratio, representing the ratio of incoming payments to rent and ancillary cost receivables from tenants, showed the fol- lowing movements in each individual month in 2020 up to the end of September 2021 as a result of the coronavirus (adjustments from agreed rent reductions already taken into account): COLLECTION RATIO * in % Q1 2020 99 % 98 Jan. 100 Feb. 98 Mar. Q1 2021 84 % 87 Jan. 81 Feb. 83 Mar. Q2 2020 71 % 64 Apr. 72 May 76 June Q2 2021 89 % 88 Apr. 87 May 93 June Q3 2021 98 % 98 July 98 Aug. 99 Sep. Q3 2020 96 % 96 July 96 Aug. 95 Sep. Q4 2020 93 % 97 Oct. 92 Nov. 90 Dec. * after rent reductions 9M 2021 / Quarterly statement of 30 September 2021 Deutsche EuroShop AG 7
- 8. The Group’s receivables (after write-downs) increased accordingly by €3.3 million to €23.1 million (previous year: €19.8 million). The Group’s liquidity improved further to €306.1 million, partly due to the significantly lower levels of capital expenditure resulting from store closures and a €6.7 million increase in borrowing. Equity ratio of 55.5% The equity ratio (including the shares of third-party shareholders) was 55.5%, slightly up compared with the last reporting date (54.6%) and still at a very healthy level. Leverage ratio remains low As at 30 September 2021, current and non-current financial lia- bilities stood at €1,505.9 million, €35.5 million lower than at the end of 2020. In addition to scheduled repayments, the €30 mil- lion drawn-down at short notice against the credit line beyond the reporting date was repaid. The loan-to-value was a very solid 31.1% (31 December 2020: 32.9%). Based on the Group’s share in the sub- sidiaries and joint ventures, the loan-to-value ratio was 34.0% (31 December 2020: 35.8%). We were able to successfully conclude all pending refinancing of our loans for the current financial year at attractive conditions. A total of four loans with a combined volume of €191 million have been extended or refinanced with our banking partners for 10 years, with interest rates of between 1.18% and 1.64%. We are currently negoti- ating with banks on refinancings due in 2022 and regularly coordi- nate on the impact of pandemic-related store closures on our finan- cial covenants and loan covenants. As at 30 September 2021, all loan covenants were met. Non-current deferred tax liabilities increased slightly by €6.6 million to €331.6 million. Other current and non-current liabilities and provi- sions decreased by €1.1 million. Current assets Non-current assets Current liabilities Non-current liabilities Equity (includ- ing third-party interests) BALANCE SHEET STRUCTURE in € million Assets Liabilities 2021 4,259.3 206.7 1,688.1 2,364.5 2021 346.7 3,912.6 4,259.3 2020 303.7 3,933.7 4,237.4 2020 4,237.4 211.2 1,711.4 2,314.8 9M 2021 / Quarterly statement of 30 September 2021 Deutsche EuroShop AG 8
- 9. Net tangible assets according to EPRA EPRA net tangible assets (NAV) as at 30 September 2021 were €2,357.9 million, compared with €2,309.7 million at the end of 2020. This was equivalent to a modest increase in NTA per share of €0.78, from €37.38 to €38.16 per share (2.1%), essentially due to higher liquidity. EPRA NTA 30.09.2021 31.12.2020 in € thousand per share in € in € thousand per share in € Equity 2,045,235 33.10 2,003,246 32.42 Derivative financial instruments measured at fair value1 25,659 0.42 26,138 0.42 Equity excluding derivative financial instruments 2,070,894 33.52 2,029,384 32.84 Deferred taxes on investment properties and derivative financial instruments1 338,715 5.48 332,059 5.38 Intangible assets -36 0.00 -13 0.00 Goodwill as a result of deferred taxes -51,719 -0.84 -51,719 -0.84 EPRA NTA 2,357,854 38.16 2,309,711 37.38 Number of no-par-value shares issued as at the reporting date 61,783,594 61,783,594 1 Including the share attributable to equity-accounted joint ventures and associates REPORT ON EVENTS AFTER THE REPORTING DATE No significant events occurred between the reporting date of 30 Sep- tember 2021 and the date of preparation of the financial statements. OUTLOOK After reopenings continued in the second quarter of 2021, our ten- ants’ operating figures – particularly customer footfall and tenant revenue – have trended upwards, and collection ratios have also con- tinued to improve. In the half-year financial statements for the period ended 30 June 2021, we put our expectations for funds from operations (FFO) for financial year 2021 at €1.70 to €1.90. The third quarter of 2021 confirmed this expectation and we are therefore maintaining our forecast. The prerequisites for this are unchanged: a sustained ability to man- age the pandemic situation without fresh store closures or signifi- cant restrictions on center operations, as well as a further stabilisa- tion and improvement in tenant revenues, especially with regard to the important Christmas business period in 2021. FFO PER SHARE in € 2019 Result 2.42 2020 Result 2.00 2021 Goal 1.70 – 1.90 9M 2021 / Quarterly statement of 30 September 2021 Deutsche EuroShop AG 9
- 10. RISK REPORT There have been no significant changes since the beginning of the financial year with regard to the risks associated with future busi- ness performance. We do not believe that the Company currently faces any risks capable of jeopardising its continued existence. The information provided in the risk report of the consolidated finan- cial statements as at 31 December 2020 is therefore still applicable (Annual Report 2020, p. 19 et seq.). CONSOLIDATED BALANCE SHEET ASSETS in € thousand 30.09.2021 31.12.2020 ASSETS Non-current assets Intangible assets 51,755 51,732 Property, plant and equipment 283 330 Investment properties 3,405,719 3,437,145 Investments accounted for using the equity method 454,784 444,517 Non-current assets 3,912,541 3,933,724 Current assets Trade receivables 23,161 19,822 Other current assets 17,491 17,805 Cash and cash equivalents 306,078 266,030 Current assets 346,730 303,657 TOTAL ASSETS 4,259,271 4,237,381 LIABILITIES in € thousand 30.09.2021 31.12.2020 EQUITY AND LIABILITIES Equity and reserves Subscribed capital 61,784 61,784 Capital reserves 1,217,560 1,217,560 Retained earnings 765,891 723,902 Total equity 2,045,235 2,003,246 Non-current liabilities Financial liabilities 1,330,342 1,359,612 Deferred tax liabilities 331,605 324,978 Right of redemption of limited partners 319,266 311,525 Other liabilities 26,201 26,851 Non-current liabilities 2,007,414 2,022,966 Current liabilities Financial liabilities 175,561 181,816 Trade payables 3,252 3,303 Tax liabilities 1,019 456 Other provisions 7,628 8,313 Other liabilities 19,162 17,281 Current liabilities 206,622 211,169 TOTAL EQUITY AND LIABILITIES 4,259,271 4,237,381 9M 2021 / Quarterly statement of 30 September 2021 Deutsche EuroShop AG 10
- 11. CONSOLIDATED INCOME STATEMENT in € thousand 01.07. – 30.09.2021 01.07. – 30.09.2020 (adjusted) 1 01.01. – 30.09.2021 01.01. – 30.09.2020 (adjusted) 1 Revenue 52,887 56,415 157,815 168,689 Property operating costs -5,868 -5,082 -15,769 -13,258 Property management costs -2,721 -2,545 -7,782 -7,595 Write-downs and disposals of financial assets -2,434 -7,766 -20,537 -26,768 Net operating income (NOI) 41,864 41,022 113,727 121,068 Other operating income 1,212 304 3,521 2,393 Other operating expenses -2,125 -1,754 -5,775 -5,390 Earnings before interest and taxes (EBIT) 40,951 39,572 111,473 118,071 Share in the profit or loss of associates and joint ventures accounted for using the equity method 8,149 5,366 21,427 -31,934 Interest expense -9,338 -10,767 -29,821 -32,746 Profit/loss attributable to limited partners -4,104 -3,604 -9,911 -9,802 Interest income 1 2 5 8 Financial gains or losses -5,292 -9,003 -18,300 -74,474 Measurement gains/losses -27,186 -2,748 -40,276 -171,450 Earnings before tax (EBT) 8,473 27,821 52,897 -127,853 Taxes on income and earnings -1,210 -4,049 -8,827 22,320 CONSOLIDATED PROFIT 7,263 23,772 44,070 -105,533 Earnings per share (€), undiluted and diluted 0.11 0.38 0.71 -1.71 1 Figures shown within net operating income were changed as at 31 December 2020 and the previous year’s quarterly figures have been adjusted for easier comparability. Please refer to the comments in the notes to the 2020 consolidated financial statements under section “4. New accounting standards and changes in presentation”. STATEMENT OF COMPREHENSIVE INCOME in € thousand 01.07. – 30.09.2021 01.07. – 30.09.2020 01.01. – 30.09.2021 01.01. – 30.09.2020 Consolidated profit 7,263 23,772 44,070 -105,533 Items which under certain conditions in the future will be reclassified to the income statement: Actual share of the profits and losses from instruments used to hedge cash flows 1,635 1,516 479 5,519 Deferred taxes on changes in value offset directly against equity -359 -335 -89 -1,223 Total earnings recognised directly in equity 1,276 1,181 390 4,296 TOTAL PROFIT 8,539 24,953 44,460 -101,237 Share of Group shareholders 8,539 24,953 44,460 -101,237 9M 2021 / Quarterly statement of 30 September 2021 Deutsche EuroShop AG 11
- 12. CONSOLIDATED STATEMENT OF CHANGES IN EQUITY in € thousand Number of shares outstanding Share capital Capital reserves Other retained earnings Statutory reserve Cash flow hedge reserve Total 01.01.2020 61,783,594 61,784 1,217,560 993,900 2,000 -25,671 2,249,573 Total profit 0 0 -105,533 0 4,296 -101,237 Dividend payments 0 0 0 0 0 0 30.09.2020 61,783,594 61,784 1,217,560 888,367 2,000 -21,375 2,148,336 01.01.2021 61,783,594 61,784 1,217,560 742,183 2,000 -20,281 2,003,246 Total profit 0 0 44,070 0 390 44,460 Dividend payments 0 0 -2,471 0 0 -2,471 30.09.2021 61,783,594 61,784 1,217,560 783,782 2,000 -19,891 2,045,235 CONSOLIDATED CASH FLOW STATEMENT in € thousand 01.01. – 30.09.2021 01.01. – 30.09.2020 Consolidated profit 44,070 -105,533 Income taxes 8,827 -22,320 Financial gains or losses 18,300 74,474 Amortisation / depreciation of intangible assets and property, plant and equipment with a finite life 79 108 Unrealised changes in fair value of investment property and other measurement gains / losses 40,276 171,450 Distributions and capital repayments received 11,160 6,505 Changes in trade receivables and other assets -3,716 -11,984 Changes in current provisions -685 -106 Changes in liabilities 1,721 5,844 Cash flow from operating activities 120,032 118,438 Interest paid -29,613 -32,595 Interest received 5 8 Income taxes paid -1,037 -2,573 Net cash flow from operating activities 89,387 83,278 Outflows for the acquisition of investment properties -8,963 -8,894 Inflows from the disposal of investment properties 0 490 Outflows for the acquisition of intangible assets and property, plant and equipment -42 -12 Cash flow from investing activities -9,011 -8,416 Inflows from financial liabilities 6,678 7,416 Outflows from the repayment of financial liabilities -42,411 -13,148 Outflows from the repayment of lease liabilities -67 -67 Payments to limited partners -2,057 -3,888 Payments to Group shareholders -2,471 0 Cash flow from financing activities -40,328 -9,687 Net change in cash and cash equivalents 40,048 65,175 Cash and cash equivalents at beginning of period 266,030 148,087 CASH AND CASH EQUIVALENTS AT END OF PERIOD 306,078 213,262 9M 2021 / Quarterly statement of 30 September 2021 Deutsche EuroShop AG 12
- 13. SEGMENT REPORTING Segment reporting by Deutsche EuroShop AG is carried out on the basis of internal reports that are used by the Executive Board to manage the Group. Internal reports distinguish between shopping centers in Germany (“domestic”) and other European countries (“abroad”). As the Group’s main decision-making body, the Deutsche EuroShop AG Executive Board first and foremost assesses the per- formance of the segments based on revenue, EBIT and EBT exclud- ing measurement gains/losses. The measurement principles for segment reporting correspond to those of the Group. To assess the contribution of the segments to the individual perfor- mance indicators as well as to the Group’s performance, the income, expenditure, assets and liabilities of the joint ventures are included in internal reporting in proportion to the Group’s share in them. Sim- ilarly, for subsidiaries in which the Group is not the sole shareholder, income, expenditure, assets and liabilities are only consolidated in proportion to the corresponding Group share. This results in the segments being divided as follows: BREAKDOWN BY SEGMENT in € thousand Domestic Abroad Total Reconciliation 01.01. – 30.09.2021 Revenue (01.01. – 30.09.2020) 138,399 (148,075) 30,463 (31,507) 168,862 (179,582) -11,047 (-10,893) 157,815 (168,689) EBIT (01.01. – 30.09.2020) 98,147 (105,141) 25,146 (24,221) 123,293 (129,362) -11,820 (-11,291) 111,473 (118,071) EBT excl. measurement gains/losses (01.01. – 30.09.2020) 73,942 (77,924) 19,984 (18,981) 93,926 (96,905) -3,391 (-3,503) 90,535 (93,402) 30.09.2021 Segment assets (31.12.2020) 3,078,110 (3,083,333) 725,861 (714,838) 3,803,971 (3,798,171) 455,300 (439,210) 4,259,271 (4,237,381) of which investment properties (31.12.2020) 2,873,204 (2,900,461) 678,781 (680,092) 3,551,985 (3,580,553) -146,266 (-143,408) 3,405,719 (3,437,145) The adjustment of the proportionate consolidation of the joint ven- tures and subsidiaries in which the Group does not own a 100% stake is carried out in the reconciliation column. Deferred tax liabilities are considered by the Executive Board of Deutsche EuroShop AG in a cross-segment manner and are therefore included in the reconcilia- tion column of the segment liabilities. Accordingly, the goodwill from the acquisition of Olympia Brno was allocated to the reconciliation column of the segment assets. The reconciliation column also con- tains the companies that are not allocated to either of the two seg- ments (Deutsche EuroShop AG, DES Management GmbH, DES Beteili- gungs GmbH Co. KG). In view of the geographical segmentation, no further information pur- suant to IFRS 8.33 is given. RELATED PARTIES FOR THE PURPOSES OF IAS 24 With regard to disclosures regarding related parties, please refer to the consolidated financial statements as at 31 December 2020 (Annual Report 2020, p. 62), which did not undergo any material changes up to 30 September 2021. OTHER DISCLOSURES Dividend On 18 June 2021, distribution of a dividend of €0.04 per share was approved for financial year 2020; this was paid out on 23 June 2021. 9M 2021 / Quarterly statement of 30 September 2021 Deutsche EuroShop AG 13
- 14. Responsibility statement by the Executive Board To the best of our knowledge, and in accordance with the applicable reporting principles for interim financial reporting, the interim con- solidated financial statements give a true and fair view of the assets, liabilities, financial position and profit or loss of the Group, and the interim management report of the Group includes a fair review of the performance of the business, including the operating results and the position of the Group, together with a description of the principal opportunities and risks associated with the expected performance of the Group for the remainder of the financial year. Hamburg, 11 November 2021 Wilhelm Wellner Olaf Borkers THE SHOPPING CENTER SHARE After closing the year1 2020 at €18.45, the Deutsche EuroShop share started the first weeks of 2021 with no clear trend, moving in a range of around €16 to €19. On both 18 and 19 February 2021, the share closed at €16.18, marking the lowest price in the first nine months of the year. The DES share then performed erratically again, before entering a modest recovery phase from the beginning of June at prices around €20. The high for the period was reached on 13 August 2021 at €21.30. The share subsequently ticked downwards to close at €17.63 on 30 September 2021. Taking into account the dividend of €0.04 per share paid on 23 June 2021, this corresponds to a performance of -4.3%. The SDAX rose by 11.8% over the same period. Deutsche EuroShop’s market capitalisation stood at €1.1 bil- lion at the end of the reporting period. 1 Unless otherwise specified, all information and calculations are based on Xetra closing prices. KEY SHARE DATA Sector/industry group Financial services / real estate Share capital as at 30.09.2021 €61,783,594.00 Number of shares as at 30.09.2021 (no-par-value registered shares) 61,783,594 Dividend for 2020 €0.04 Share price on 30.12.2020 €18.45 Share price on 30.09.2021 €17.63 Low / high for the period under review €16.18 / €21.30 Market capitalisation on 30.09.2021 €1.1 billion Prime Standard Frankfurt and Xetra OTC markets Berlin, Düsseldorf, Hamburg, Hanover, Munich and Stuttgart Indices SDAX, EPRA, GPR 250, EPIX 30, MSCI Small Cap, HASPAX, F.A.Z.-Index ISIN DE 000748 020 4 Ticker symbol DEQ, Reuters: DEQGn.DE DEUTSCHE EUROSHOP VS SDAX AND EPRA COMPARISON, JANUARY TO NOVEMBER 2021 indexed, base of 100, in % Deutsche EuroShop EPRA SDAX 120 115 110 105 125 90 95 85 100 Jan. Feb. Mar. Apr. May June July Aug. Sep. Oct. Nov. 9M 2021 / Quarterly statement of 30 September 2021 Deutsche EuroShop AG 14
- 15. Forward-looking statements This quarterly statement contains forward-looking statements based on estimates of future developments by the Executive Board. The statements and forecasts represent estimates based on all of the information available at the current time. If the assumptions on which these statements and forecasts are based do not materialise, the actual results may differ from those currently forecast. Rounding and rates of change Percentages and figures stated in this report may be subject to round- ing differences. The sign used to indicate rates of change is based on economic considerations: improvements are indicated by a plus (+); deterioration by a minus (-). FINANCIAL CALENDAR 2021 11.11. Quarterly statement 9M 2021 29.11. Citi’s REIT Call Series (virtual) 01.12. DZ Bank Equity Conference, Frankfurt 2022 06.01. Oddo BHF Forum (virtual) 19.01. Kepler Cheuvreux GCC (virtual) 22.03. Preliminary results for the financial year 2021 26.04. Publication of Annual Report 2021 12.05. Quarterly statement 3M 2022 18.-19.05. Kempen European Property Seminar, Amsterdam 23.06. Annual General Meeting 11.08. Half-year Financial Report 2022 10.11. Quarterly statement 9M 2022 Our financial calendar is updated continuously. Please check our website for the latest events: www.deutsche-euroshop.com/ir Nicolas Lissner and Patrick Kiss WOULD YOU LIKE ADDITIONAL INFORMATION? Then visit us online or call us: Patrick Kiss and Nicolas Lissner Phone: +49 (0)40 - 41 35 79 20/-22 Fax: +49 (0)40 - 41 35 79 29 www.deutsche-euroshop.de/ir E-Mail: ir@deutsche-euroshop.de 9M 2021 / Quarterly statement of 30 September 2021 Deutsche EuroShop AG 15