
Recommended
Recommended
More Related Content
Viewers also liked
Viewers also liked (18)
Similar to Why Volatility Matters
Similar to Why Volatility Matters (20)
Why Volatility Matters
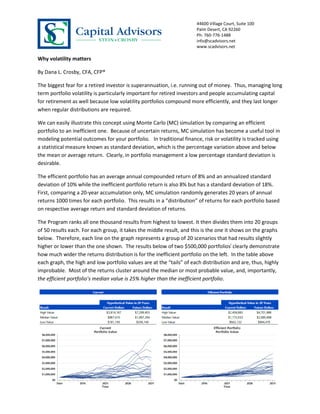
- 1. 44600 Village Court, Suite 100 Palm Desert, CA 92260 Ph: 760-776-1488 info@scadvisors.net www.scadvisors.net Why volatility matters By Dana L. Crosby, CFA, CFP® The biggest fear for a retired investor is superannuation, i.e. running out of money. Thus, managing long term portfolio volatility is particularly important for retired investors and people accumulating capital for retirement as well because low volatility portfolios compound more efficiently, and they last longer when regular distributions are required. We can easily illustrate this concept using Monte Carlo (MC) simulation by comparing an efficient portfolio to an inefficient one. Because of uncertain returns, MC simulation has become a useful tool in modeling potential outcomes for your portfolio. In traditional finance, risk or volatility is tracked using a statistical measure known as standard deviation, which is the percentage variation above and below the mean or average return. Clearly, in portfolio management a low percentage standard deviation is desirable. The efficient portfolio has an average annual compounded return of 8% and an annualized standard deviation of 10% while the inefficient portfolio return is also 8% but has a standard deviation of 18%. First, comparing a 20-year accumulation only, MC simulation randomly generates 20 years of annual returns 1000 times for each portfolio. This results in a “distribution” of returns for each portfolio based on respective average return and standard deviation of returns. The Program ranks all one thousand results from highest to lowest. It then divides them into 20 groups of 50 results each. For each group, it takes the middle result, and this is the one it shows on the graphs below. Therefore, each line on the graph represents a group of 20 scenarios that had results slightly higher or lower than the one shown. The results below of two $500,000 portfoliosi clearly demonstrate how much wider the returns distribution is for the inefficient portfolio on the left. In the table above each graph, the high and low portfolio values are at the “tails” of each distribution and are, thus, highly improbable. Most of the returns cluster around the median or most probable value, and, importantly, the efficient portfolio’s median value is 25% higher than the inefficient portfolio.
- 2. 2|Page SC Capital Advisors May 11, 2012 Portfolio Distributions Now we test a 30-year distribution of $4,000 a month, inflated by 3% per year after 20 years of accumulation. The more efficient low volatility portfolio had a 74% likelihood of lasting the 30 year distribution period versus 48% for the inefficient, high volatility portfolio. This means that 740 of the 1000 scenarios never ran out of money for the efficient portfolio; only 480 of 1000 scenarios for the inefficient portfolio never ran out of money. The median value for the efficient portfolio was in excess of $5,000,000 for the efficient portfolio and had real growth over inflation. The median result for the inefficient portfolio ran out of money after 28 years. Our approach to managing volatility is multifold. We invest in uncorrelated asset classes and industries and avoid concentrated positions in individual companies and sectors. Covered call writing can also reduce volatility. The consistent presence of short options positions in a portfolio that move opposite of their underlying positions can have a dramatic effect in reducing portfolio volatility over time. We firmly believe attention to risk as well as return will help our clients consistently get a better night’s sleep. i Assumes each portfolio is a Roth IRA with no tax consequences during accumulation or distribution.