3. FP7‐ICT‐257245 ‐ VITRO
D4.3 ‐Trusted Routing Protocol Prototype Implementation And Simulation Results
3 of 118
Document Revision History
Date Issue Author/Editor/Contributor Summary of main changes
13/9/2011 0.1 Terpsi Velivassaki (TEIHAL) ToC
19/9/2011 0.2 Nelly Leligou (TEIHAL) ToC (extended and finalised)
10/10/2011 0.3 N. Leligou, Th. Zahariadis, D.
Bargiotas, P. Karkazis, T.
Velivassaki (TEIHAL)
Claudio Malavenda (SSI)
Kyriakos Georgouleas (HAI)
Contributions in several sections
10/10/2011 0.4 Claudio Malavenda (SSI) 2nd
Contribution
10/10/2011 0.5 Kyriakos Georgouleas (HAI) 2nd
Contribution
10/10/2011 0.6 Christian Ibars CTTC Contribution
03/11/2011 0.7 Lambros Sarakis, Chris
Matrakidis, Th. Tsiodras
(TEIHAL)
Contribution in chapter 1 and in
section 3.3
15/11/2011 0.8 M. Navarro, C. Ibars, S.
Pfletschinger
Contribution to section 3.2
21/11/2011 0.9 TEIHAL (N. Leligou, L. Sarakis,
Th. Tsiodras, S. Voliotis), SSI
(Claudio Malavenda), CTTC
(Monica Navaro), CTI
(Thanasis Antoniou),
Updated contributions in all
sections
28/11/2011 1.0 M. Navarro, C. Ibars, S.
Pfletschinger, Claudio
Malavenda (SSI),
Konstantinos Moustakakis,
Thanasis Antoniou (CTI)
Update of simulation results and
additional contribution to section
3.2, Update of simulation results
and additional contribution
regarding CBox RPL
4. FP7‐ICT‐257245 ‐ VITRO
D4.3 ‐Trusted Routing Protocol Prototype Implementation And Simulation Results
4 of 118
Table of contents
Disclaimer ..................................................................................................................................... 2
Document Revision History ........................................................................................................... 3
Executive Summary ....................................................................................................................... 5
1. Introduction ............................................................................................................................. 6
1.1. Document context ....................................................................................................................... 6
1.2. Document purpose ...................................................................................................................... 6
1.3. Document structure .................................................................................................................... 7
1.4. References ................................................................................................................................... 7
1.5. Glossary ....................................................................................................................................... 7
1.6. Bibliography ................................................................................................................................ 8
2. Design Finalization and Performance Assessment Methodology ............................................. 10
2.1. The VITRO Routing framework .................................................................................................. 10
2.2. Cross‐layer metrics ‐ Involvement of radiation pattern in the choice of metrics ...................... 13
2.3. Performance Assessment Methodology .................................................................................... 17
3. Simulation Platforms and Validation Results .......................................................................... 20
3.1. Simulations on RPL .................................................................................................................... 20
3.2. The CBox‐RPL protocol .............................................................................................................. 47
3.3. Simulation platform and results on Opportunistic Network Coding ......................................... 60
3.4. Simulation platform and results on DTN ................................................................................... 73
4. VITRO routing protocol implementation ................................................................................. 88
4.1. Implementation of the DTN scheme ......................................................................................... 88
4.2. Implementation of Trust‐aware Routing Protocol Solution ...................................................... 93
5. Conclusions .......................................................................................................................... 107
Annex A: ROUTING ALGEBRA FORMALISM FOR MULTIHOP WIRELESS NETWORKS .................... 109
1. WSN Graph Model ............................................................................................................... 109
2. Routing Algebra Formalism ................................................................................................ 109
3. Routing Protocol Requirements ......................................................................................... 110
4. Routing Metrics Properties .................................................................................................. 110
5. Routing Composition Approaches ..................................................................................... 111
5.1. Lexical Metric Composition ................................................................................................. 111
5.2. Additive Metric Composition ............................................................................................... 111
Annex B: Proof of Isotonicity and Monotonicity Properties for Additive Metric Composition ..... 113
Annex C: J‐SIM Installation Guidelines for Windows XP and Unix .............................................. 115
Annex D: J‐SIM Installation Guidelines for MACOSX 10.6.4 (Snow Leopard) ............................... 117
5. FP7‐ICT‐257245 ‐ VITRO
D4.3 ‐Trusted Routing Protocol Prototype Implementation And Simulation Results
5 of 118
Executive Summary
In the current deliverable, the novel VITRO routing solutions are finalized, modeled and evaluated
using computer simulations. Based on the results, we assess:
The performance achieved for different objective functions in the RPL‐based routing
protocol. The performance differentiation shows that the VITRO design is suitable for
supporting a great variety of applications with diverse Quality of Service requirements.
The reliability of the designed solution when a) misbehaving (malicious or not) nodes exist
in the network, and b) the communication links between neighbors are weak/faulty. The
first behavior is defended based on a subset of the routing metrics, while the second is
alleviated combining the RPL‐based protocol with the network coding scheme.
The performance of the CBox RPL‐like protocol which deals with topological changes.
The performance of the Spray and Wait routing protocol which is suitable for delay‐tolerant
applications deployed over either static or mobile networks. The relation between the
protocol parameters and the network dimensions is investigated based on the developed
model.
Based on this thorough investigation, the user of the VITRO routing modules can adapt the flexible
solutions to the situation at hand each time. To guide the user to the best choices, the impact of the
adoption of each routing metric is correlated with the achieved performance, the conditions under
which the use of cross‐layer routing metrics is valid are defined (based on experiments in anechoic
chamber), alternative ways to combine the metrics guaranteeing convergence and optimality are
provided, and the use of other schemes (network coding, extensions to support mobility) are
detailed. (Guidelines are provided in the conclusions chapter.)
Finally, the implementation architecture of the VITRO routing modules is presented in this
deliverable tackling also the design challenges in accommodating such a flexible routing solution in
a resource‐constrained sensor node. This architecture presentation is accompanied by the
description of the debugging tools and the developed code that is made available from now on to
WP6 for integration to the VITRO system.
6. FP7‐ICT‐257245 ‐ VITRO
D4.3 ‐Trusted Routing Protocol Prototype Implementation And Simulation Results
6 of 118
1. Introduction
1.1. Document context
This document reports work carried out in the framework of task 4.3. Based primarily on task 4.2
and D4.2, the partners involved in this task (HAI, CTTC, CTI, TEIHAL, SSI):
developed simulation models of the routing solutions outlined in D4.2 in order to
investigate the achieved performance;
developed the code implementing the VITRO routing solution in real motes;
investigated correlations between other VITRO WP objectives and building blocks (network
coding algorithms, delay tolerant networking techniques, management issues) and the
routing protocol.
The simulation results reported in this document will be forwarded for dissemination activities to
WP7 and the routing prototype will be delivered to WP6 for integration in the VITRO demonstrator.
1.2. Document purpose
The prime purpose of this document is the evaluation of the VITRO routing solution based on
computer simulations before it is implemented and integrated in the VITRO demonstrator. In more
detail, our aim is to:
Fine‐tune the routing protocol design based on computer simulations and experiments
regarding the cross layer metrics adopted in VITRO;
Assess the performance of the protocol under a variety of circumstances, compare different
design alternatives and identify the parameter that mostly affect the performance;
Verify that the designed solution meets the VITRO requirements;
Provide guidelines for its use and configuration in a real environment;
Implement it on real motes running TinyOS (the implementation architecture along with the
faced challenges are presented).
Given that the VITRO routing solution is more a routing framework which enables the realization of
multiple routing solutions than a single routing solution, (in other words, the flexibility to decide
which primary metrics to combine is left to the system designer), a variety of specific routing
solutions can be built. This is totally in line with the VITRO philosophy, which targets the support of
different applications using the same physical sensing and resource infrastructure consisting of
heterogeneous devices participating in several instantiations.
Furthermore, an extension of the VITRO routing protocol, the CBox‐RPL routing protocol, designed
to facilitate the self‐organisation of a network of heterogeneous devices in the face of frequent
topological changes (mobility, environmental conditions), is also presented and evaluated. The set
of routing metrics described in D4.2 are still used to quantify the rank of each node which is used
for the handling of topological changes and tree construction.
Also, the exploitation of the routing information for improving the network coding performance in
terms of reliability is also investigated. A scheme using the node’s rank value to decide the
7. FP7‐ICT‐257245 ‐ VITRO
D4.3 ‐Trusted Routing Protocol Prototype Implementation And Simulation Results
7 of 118
redundant paths that the network coding scheme will use is defined and evaluated based on
computer simulations.
Finally, considering a wireless sensor island implementing different approaches than the VITRO
routing solution, the “Spray and Wait” DTN approach (described in D3.2), which represents a
routing scheme that is used for asynchronous packets exchange, is evaluated from a routing
perspective based on computer simulations
1.3. Document structure
This document is organized in 5 chapters:
Chapter 2: Design Finalisation and Performance Assessment Methodology
Chapter 3: Simulation Platforms and Validation Results
Chapter 4: VITRO routing protocol implementation
Chapter 5: Conclusions
1.4. References
Reference Document
[DoW] VITRO project, Annex I ‐ “Description of Work”, V4.0, dated 2011‐01‐14.
[D3.1] VITRO project, Deliverable 3.1, “Efficient and Reliable MAC Protocol Specification”,
v1.0, dated 2011‐04‐11
[D4.2] VITRO project, Deliverable 4.2, “Trust‐aware Routing Protocol Specifications”, v1.2,
dated 2011‐07‐12
[D3.2] VITRO project, Deliverable 3.2, “Delay Tolerant Networking and Context Awareness”,
v1.0, dated 2011‐07‐27
1.5. Glossary
Acronym/abbreviation Explanation
PDR Packet Delivery Rate
WSN Wireless Sensor Network
BLIP Berkeley Low‐power IP
WSI Wireless Sensor Island
RPL Routing Protocol for Low‐power and Lossy Networks
MP2P Multipoint‐to‐Point
VaSNs Vitro‐aware Sensor Nodes
MCU MicroController Units
VGWs VITRO Gateways
LQI Link Quality Indicator
8. FP7‐ICT‐257245 ‐ VITRO
D4.3 ‐Trusted Routing Protocol Prototype Implementation And Simulation Results
8 of 118
ETX Expected Transmission Count
RSS Received Signal Strength
NC Network Coding
RSSI Received Signal Strength Indication
SnW Spray and Wait
VITRO Virtualized dIsTRibuted Platforms of smart Objects
VSN Virtual Sensor Networks
WP Work package
WSN Wireless Sensor Networks
1.6. Bibliography
[BLIP] http://code.google.com/p/tinyos‐main/source/browse/branches/blip‐rpl‐
devel/
[Contiki] http://www.contiki‐os.org/
[ContikiRPL] N. Tsiftes, J. Eriksson, and A. Dunkels, “Low‐Power Wireless IPv6 Routing with
ContikiRPL”, In Proceedings of the International Conference on Information
Processing in Sensor Networks (ACM/IEEE IPSN), Stockholm, Sweden, April
2010.
[ContikiTinyOSRPL] JeongGil Ko, Joakim Eriksson, Nicolas Tsiftes, Stephen Dawson‐Haggerty,
Andreas Terzis, Adam Dunkels and David Culler, “Contiki RPL and TinyRPL:
Happy Together”, IPSN’11, April 12–14, 2011, Chicago, Illinois
[DaintreeSNA] Daintree Sensor Network Analyzer, 103A‐ATB Atmel Development Kit Basic
Edition
[Gou03] M. G. Gouda, M. Schneider, “Maximizable routing metrics”, IEEE/ACM
Transactions on Networking, vol. 11, no. 4, Aug. 2003, pp. 663‐675
[Humb11] http://hwl.hu‐berlin.de/publications/mesh/link‐asymmetry/
[I.D.‐ietf‐roll‐
minrank‐
hysteresis‐of‐02]
O. Gnawali, P. Levis, “The Minimum Rank Objective Function with Hysteresis”,
draft‐ietf‐roll‐minrank‐hysteresis‐of‐02, Apr. 2011
[I‐D.ietf‐roll‐of0‐
05]
P. Thubert, “RPL Objective Function 0”, draft‐ietf‐roll‐of0‐05, Jan. 2011
[I‐D.ietf‐roll‐
routing‐metrics]
Vasseur, JP., Kim, M., Pister, K., Dejean, N., Barthel, D., "Routing Metrics used
for Path Calculation in Low Power and Lossy Networks", draft‐ietf‐roll‐routing‐
metrics‐19 (RFC Ed Queue), Mar. 2011
[Jam09] A. Jamil, S.H.S. Ariffin, A. A. Abdullah, N. Fisal, K. Saleem, S. K. Syed‐Yusof,
“Optimal Forwarding Routing Protocol in IPv6‐based Wireless Sensor
Networks”, Proceedings of the 2009 IEEE 9th
Malaysia International
Conference on Communications, 15‐17 December 2009, Kuala Lumpur,
Malaysia, pp. 310‐315.
[Kann07] Bounpadith Kannhavong, Hidehisa Nakayama, Yoshiaki Nemoto, And Nei Kato,
Abbas Jamalipour, “A survey of routing attacks in mobile ad hoc networks”,
IEEE Wireless Communications, Vol 14, Iss. 5, October 2007, pp. 85‐9
[Kwon09] J. Kwon, G. Ahn, S. Kim, S. Kang, H. Kim, “A Study on Energy‐Efficient Tree
Routing Protocol based on Link Quality Metrics for Remote Air Environmental
9. FP7‐ICT‐257245 ‐ VITRO
D4.3 ‐Trusted Routing Protocol Prototype Implementation And Simulation Results
9 of 118
Monitoring System“, ICROS‐SICE International Joint Conference 2009, Aufust
18‐21, 2009, Fukuoka, Japan, pp. 4863‐4868.
[PASTRY]
M. Castro, P. Druschel, Y. C. Hu and A. Rowstron, "Exploiting network
proximity in peer‐to‐peer overlay networks", Technical report MSR‐TR‐2002‐
82, 2002.
[Pol10]
Yury Polyanskiy, H. Vincent Poor, Sergio Verdú, “Channel Coding Rate in the
Finite Blocklength Regime”, IEEE Transactions on Information Theory, vol. 56,
no. 5, pp. 2307‐2359, May 2010
[RFC2460] S. Deering, R. Hinden, “Internet Protocol, Version 6 (IPv6)”, RFC2460, Dec.
1998
[SHAWN]
A. Kröller, D. Pfisterer, C. Buschmann, S. P. Fekete and S. Fischer: “Shawn: A
new approach to simulating wireless sensor networks”. In Proceedings of the
Design, Analysis, and Simulation of Distributed Systems Symposium 2005,
(DASD' 05), pages 117‐124, Apr. 2005.
[Sob02] J. L. Sobrinho, “Algebra and algorithms for QoS path computation and hop‐by‐
hop routing in the Internet,” IEEE/ACM Trans. Netw., vol. 10, no. 4, pp. 541–
550, Aug. 2002
[Sob03] J. Sobrinho, “Network routing with path vector protocols: theory and
applications”, in ACM SIGCOMM, 2003, pp. 49‐60.
[Sri06] K.Srinivasan, P.Dutta, A.Tavakoli, P. Levis, “Understanding the cause of packet
delivery success and failure in dense wireless sensor network”, Technical
Report SING‐06‐00
[TinyOS] http://www.tinyos.net
[TinyRPL] http://code.google.com/p/tinyos‐
main/source/browse/#svn%2Fbranches%2Fblip‐rpl‐devel
[Vas11] JP. Vasseur, et. Al.“Routing Metrics used for Path Calculation in Low Power
and Lossy Networks”, March 1, 2011, available at
http://tools.ietf.org/pdf/draft‐ietf‐roll‐routing‐metrics‐19.pdf
[WISELIB]
T. Baumgartner, I. Chatzigiannakis, S. P. Fekete, C. Koninis, A. Kröller and A.
Pyrgelis: “Wiselib: A generic algorithm library for heterogeneous sensor
networks”, in ‘Proceedings of the Seventh European Conference on Wireless
Sensor Networks (EWSN 2010)’, Springer‐Verlag LNCS 5970, Coimbra,
Portugal, pp. 162–177, 2010.
[Yan05] Y. Yang, J. Wang, “Designing routing metrics for mesh networks”, Wi‐Mesh
2005, Santa Clara, CA
[Yan08] Y. Yang, J. Wang, “Design guidelines for routing metrics in multihop wireless
networks”, IEEE INFOCOM 2008, pp. 1615‐1623
[Zah11]
T. Zahariadis, P. Trakadas, “Design Guidelines for Routing Metrics Composition
in LLN”, draft‐zahariadis‐roll‐metrics‐composition‐02, November 2011, work
in progress.
10. FP7‐ICT‐257245 ‐ VITRO
D4.3 ‐Trusted Routing Protocol Prototype Implementation And Simulation Results
10 of 118
2. Design Finalization and Performance Assessment
Methodology
Based on the design principles included in D4.1 and the description of the VITRO routing protocol
specifications included in D4.2, in this chapter we refine and finalise the VITRO routing solution
which was modeled using the JSIM open simulation platform and further implemented for motes
running the TinyOS operating system. We also present the methodology that is followed for
performance assessment.
2.1. The VITRO Routing framework
While utilization of single, network‐specific routing metrics can capture the characteristics of their
target networks, there is a lack of knowledge about the impact of these routing metrics (from an
operational point of view) when applied to other routing protocols. Furthermore, the diversity of
multi‐hop wireless networks and the quality of service (QoS) requirements dictated by modern and
demanding applications, motivate the design of composite routing metrics. However, the selection
of routing metrics to design an efficient composite metric is neither an arbitrary nor a trivial task.
This is mainly due to the fact that each routing metric is characterized by three fundamental
properties: the metric domain, the metric operator and the metric order relation.
Metric Domain
According to their definition and design structure, routing metrics are defined in different domains.
For example, ETX metric is defined in ,1 , while Remaining Energy Percentage (RE) is defined in
1,0 . Also, according to [Vas11], Link Quality Level (LQL) is defined in 7,...,2,1,0 , where 0 means
undetermined, 1 indicates the highest and 7 the lowest link quality level.
Metric Operator
The second property of a routing metric is related to the way that link weight is aggregated along
the traversed path. Let ji vvw , be the weight (metric value) for the link ji vv , , then for any path
nnn vvvvvvp ,,...,, 1211 , we define that the metric is:
Additive if nn vvwvvwvvwpw ,...,, 13221 .
Multiplicative if nn vvwvvwvvwpw ,...,, 13221 .
Concave if ],,...,,,,min[ 13221 nn vvwvvwvvwpw or ],,...,,,,max[ 13221 nn vvwvvwvvwpw .
Hence, routing metrics differ in the link aggregation rule (metric operator) they follow. As an
example, Hop‐Count (HC) and ETX are additive metrics, while Throughput and Bandwidth are
representative examples of concave metrics.
Metric Order Relation
Finally, another categorization of routing metrics is derived from the fact that some are
maximizable ( ) (the higher path weight value, the better) while others are minimizable ( ) (the
lower path weight value, the better). For example, a source node selects the neighboring node that
advertises the minimum HC (or aggregated ETX) value to reach destination node. On the other
hand, if the path calculation algorithm is based on RSSI (or Throughput) values, then the maximum
value will lead the process of the path (or node) selection.
11. FP7‐ICT‐257245 ‐ VITRO
D4.3 ‐Trusted Routing Protocol Prototype Implementation And Simulation Results
11 of 118
Table 1 presents a classification of the most commonly used routing metrics in wireless ad‐hoc and
sensor networks. It is worth mentioning that for RSSI, there is no standardized manner to quantify it
and several options appear in the literature.
Table 1: Routing metrics properties and rules.
Metric Domain Aggregation
Rule
Order Relation
Hop‐Count {1} additive <
ETX ,1 additive
<
LQL {0,1,2, …,7} concave (min) max
Latency
additive <
Bandwidth
concave (min) max
RSSI
additive >
Rem. Energy
Percentage
[0 , 1] concave (min) max
In order to reach its goals, VITRO has defined a set of routing metrics which can guide the selection
of the route accommodating different QoS requirements, by composing objective functions taking
into consideration more than one metrics. An extensive study on composite routing metrics design
principles can be found in [Zah11].
According to routing algebra formalism, presented in Annex A, two approaches can be used in order
to combine several metrics, namely lexical and additive approaches, as discussed in D4.2. The
important difference between these two approaches is that lexical composition can be applied to
any two metrics, irrespective of their properties and rules, while for utilizing additive metric
composition approach, all metrics included must share the same domain, operator and order
relation. In general, as stated in [Sob02], [Sob03] and [Gou03], if two routing metrics are monotonic
and strictly isotonic, then their lexical composition metric is also monotonic and isotonic. However,
this statement does not hold in general for the additive composition of two routing metrics.
Since the additive metric composition approach provides many advantages over its lexical
counterpart, we investigated several approaches and finally proved that a composite additive
metric consisting of two primary metrics defined in ,1 with metric operator + and order relation
< can be combined, providing a composite metric that satisfies properties of monotonicity and
isotonicity and thus being able to be applied in any routing protocol (a formal proof is described in
Annex B). On the contrary, the approach of defining a composite metric by deriving primary metrics
in the form of X
11 , where X is any metric taken into account, does not always satisfy
properties of monotonicity and isotonicity.
Hence, we will explain how primary routing metrics can be transformed in order to be defined in
,1 with metric operator + and order relation <:
Hop‐Count (HC) is a routing metric that is used to report the number of traversed nodes
along the path. This metric increases strictly monotonically from the root towards the leaf
nodes, and additionally it is strictly isotonic since the order of the path weight values of two
paths is preserved if they are appended or prefixed by a common third link or path.
12. FP7‐ICT‐257245 ‐ VITRO
D4.3 ‐Trusted Routing Protocol Prototype Implementation And Simulation Results
12 of 118
Expected Transmission Count (ETX) is a routing metric capturing the reliability of the link.
ETX is expressed as the number of transmissions (including retransmissions) a node expects
to make to a destination in order to successfully deliver a packet [Vas11]. The ETX of a path
is defined as the summation of the ETX's of all links along the path in [Yan05], and on each
link it expresses the number of link layer transmissions required for the successful delivery
of a message. Assuming that node i transmits towards node j, and that s packets were
successfully delivered and f failures were observed (through the absence of link layer
acknowledgement), the related metric can be quantified as:
1,
s
fs
ETX ji
Thus, ji
ETX ,
is a positive real number, monotonically increasing (considering this as an
additive metric along the path) and is minimized to the lower advertised values (i.e. the
node advertising the lowest value is preferred). It is also straightforward to prove that ETX is
strictly isotonic [Yan08].
Apart from ETX, another link reliability metric is expressed by the Received Signal Strength
Indication (RSSI) which is widely used in the literature. Intuitively, the highest the strength of
the received signal is, the better the link quality. Hence, RSSI is a maximizable metric and
must be transformed into a minimizable one. Furthermore, the RSSI measured value is
usually expressed as a negative order of 10 (e.g. 10‐9
). In order to transform RSSI metric into
an additive one, defined in ,1 and being minimizable, we perform the following: first we
multiply by 109
(assuming that 10‐9
is the lowest detected signal strength) and then we
subtract this value from a maximum one (e.g. 10). For example, consider that node A has
two neighboring nodes, B and C, with respective RSSI values 9
109
and 9
105
. Under
primary RSSI metric, node A would select node B as its parent. Applying the abovementioned
formula, for node B we have 11010910 99
while for node C we have
51010510 99
. So, again, node A will select node B (advertizing the minimum value)
as its parent.
As regards the Node Energy object for battery‐operated devices, RPL specifies that the
respective metric Energy‐Estimation (E‐E) is the current expected lifetime divided by the
desired minimum lifetime, in units of percent. Among the examples provided in [Vas11], we
opt for calculating the node remaining energy indicator (RE) as the ratio between the
maximum (initial) energy maxV and the current energy value nowV , i.e.
1max
nowV
V
RE
Thus, each node will prefer to cooperate with a neighbor with higher nowV value, i.e. lower
RE value. It is also evident that RE is a positive real number. We consider that the RE weight
value of a path is the summation of the RE values of the nodes along that path, and we are
minimizing this metric which is increasing monotonically. Its isotonicity is proved in a similar
to the ETX manner.
In addition to the primary routing metrics described in [Vas11], placing emphasis on the
routing procedure security, we have identified the packet forwarding indication (PFI) metric.
In LLN a very common routing attack [Kann07] is the black hole/grey hole attack during
which an adversary node refuses forwarding all or part of the traffic acting maliciously or
selfishly (for example, to economise energy). The impact on the network performance is
aggravated if it additionally advertises light/short routes to the root, where light is expressed
13. FP7‐ICT‐257245 ‐ VITRO
D4.3 ‐Trusted Routing Protocol Prototype Implementation And Simulation Results
13 of 118
in the adopted routing metric. Such failures in cooperation for routing purposes can also
happen when a node is malfunctioning, receiving but not forwarding traffic. For this reason,
we propose to enrich the routing metric set with PFI, defining that each node after
transmitting a packet to a neighbor, it enters the promiscuous mode and waits to listen
whether the selected neighbor has actually forwarded its packet, i.e. it does not rely on the
link layer acknowledgement alone since a malicious node may acknowledge the message but
not forward it. Assuming that sf packets were actually forwarded and ff packets failed to be
forwarded (realized through the absence of overheard packet being forwarded), the related
metric can be quantified as
1,
sf
ffsf
PFI ji
Although
ji
PFI ,
is expressed in a similar to ETX manner, it is stressed that a neighbor
acting maliciously, may transmit link layer acknowledgment for the reception of the packet
but may not actually further forward it. As a routing metric, PFI is minimizable since lower
PFI values indicate lower failures and exhibits the same properties of monotonicity and
isotonicity as ETX.
2.2. Cross‐layer metrics ‐ Involvement of radiation pattern in
the choice of metrics
The virtualization and trust‐aware metrics of the VITRO routing framework include cross‐layer
metrics in an attempt to enable the optimization with respect to packet loss. In other words, each
node before forwarding a packet towards a neighbour, it takes into account the quality of the link
between them to avoid lossy links. Most routing protocols rely on metrics expressing the quality of
the link between the nodes in order to select the best route for packets. In this section, we shed
light on the most widely used methods for evaluating the condition of the link.
For instance, in the OFPR protocol [Jam09], a node sends a request to its entire neighbourhood to
collect response messages and measure link parameters as RSSI and Link Quality Indicator (LQI). In
CLQM‐TR protocol [Kwon09] several measurements toward a sink node are performed to estimate
the RSSI and LQI values, to be used to map the communication link quality.
In this paragraph our aim is to analyze whether the RSSI and LQI measurements obtained for
incoming packets can be used to estimate the link quality for outgoing packets, i.e. whether it is
possible to estimate the quality of links between nodes in both directions by measuring the RSSI and
LQI in only one direction. This analysis takes into account physical parameters which affect the
wireless link quality (but not the wired links).
16. FP7‐ICT‐257245 ‐ VITRO
D4.3 ‐Trusted Routing Protocol Prototype Implementation And Simulation Results
16 of 118
In Figure 4, there is a comparison between the radiation pattern of the antenna used standalone
and the radiation pattern measured when it is installed on the device with another antenna placed
nearby.
a) b)
Figure 4: Radiation Pattern comparison of standalone antenna vs final device – Vertical Plane
The comparison denotes that the real pattern that the node has to deal with has a hole of reception
between 15° and 30° of elevation on the ground plane, while the ideal one had the same
characteristic near zero degree.
In the comparison between the horizontal pattern and the real one the measurements (included in
Figure 5) reveal an abnormal directionality of the right lobe of device that does not appear in the
antenna pattern. This can be one of the causes of non‐directionality of sensor nodes transmission. It
could lead to asymmetry in radio links established by nodes. In fact the difference of several dBm in
radiated power is translated in a shorter path of the radio wave emitted. This is reflected on the
actual radio covertures of devices and in the range they can achieve.
a) b)
Figure 5: Radiation Pattern comparison of standalone antenna vs final device – Horizontal Plane
For instance, in the radiation pattern shown in Figure 5b, the emission in direction 270° is 8.3dBm
higher than the emission in direction 0°. So, if in 270° direction the communication reaches a level
of ‐80dBm (that can be considered the limit of power needed for a good reception rate for the
analyzed device) at 500meters, in direction 0° the same RF level is reached at 180m.
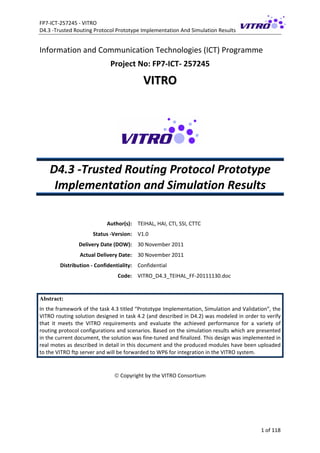
Figure 6 shows the asymmetry in direct link communication range.
17. FP7‐ICT‐257245 ‐ VITRO
D4.3 ‐Trusted Routing Protocol Prototype Implementation And Simulation Results
17 of 118
Figure 6: Communication range asymmetry
For instance the following case may occur:
1. ‘B’ transmits a packet in direction 0° with a 0dBm of Tx power with a 0dBi antenna gain and
an example frequency of 420MHz that has an attenuation of 70dBm at 200m.
2. The radio signal reaches the ‘A’ antenna with a theoretical power of ‐70dBm.
3. If a multipath happens and for instance the angle of reception is one of the peak (135° or
45°) the RSSI associated with the link of this path can be of ‐71dBi.
4. ‘A’ associates the ‘link’ quality with ‘B’ and the RSSI just received. When node ‘A’ tries to
transmit a packet to ‘B’, it will use the RSSI received to forecast the connection with ‘B’.
5. ‘A’ transmits to ‘B’ using a false forecast: actually the message transmitted by ‘A’ does not
even have the power to reach ‘B’.
Nodes that work with protocols based on the same physical layer as 802.15.4 are affected more by
multipath, so it is important to have a full control of their radiation pattern in order to avoid relying
on inaccurate link metrics (assuming symmetric links).
As reported by [Humb11], the 40% of links that use protocols operating in 2.4GHz are affected by
link asymmetry. In that test the metric used to have an estimation of the link asymmetry is the
packet delivery rate (PDR). The majority of the tested links has a very asymmetric PDR and only in
few cases nearly symmetric links were measured.
The main cause of asymmetry is interference and in fact a packet transmitted with a low bit‐rate is
more vulnerable to interference due to its longer transmission time on the wireless medium. These
considerations can be applied to all link quality estimator metrics like RSSI, LQI, LQL because they
are all affected by physical RF power that reaches the receiver node.
The risk is to use a metric for something that it does not model, i.e. assuming a symmetric link
evaluator while the wirelesses link is not.
2.3. Performance Assessment Methodology
Before proceeding to the implementation of the VITRO routing solution, a simulation model was
developed to investigate the behavior of the designed protocol and the different possible
configurations, to fine tune the design choices and evaluate the achieved performance with respect
to the requirements set in the previous deliverables.
Max 500m
200m
A B
A‐Rx =‐70dBm B doesn’t Rx Max 180m
18. FP7‐ICT‐257245 ‐ VITRO
D4.3 ‐Trusted Routing Protocol Prototype Implementation And Simulation Results
18 of 118
In more detail, the steps followed in the performance assessment procedure are the following:
Model development and verification based on the JSIM simulation platform and controlled
scenarios. J‐Sim is a platform‐independent, extensible simulation environment,
implemented on top of a component‐based software architecture, called Autonomous
Component Architecture (ACA). The basic entities in the ACA are components, which
exchange data via ports. The component behavior is specified at system design time in
contracts, providing loosely‐coupled component architecture, processing the arriving data
at the port in an independent execution context (thread). On top of ACA, J‐Sim provides a
generalized packet‐switched internetworking framework, called INET. Moreover, J‐Sim
provides an interface that allows its integration with the Tcl scripting language. Therefore, J‐
Sim is a dual‐language simulation environment in which classes are written in Java and
glued together using Tcl/Java. Within VITRO a complete RPL simulation platform has been
developed, providing:
o multiple instances support, each one characterized by a unique OF,
o modeling of several link and node, static and dynamic metrics and constraints,
o modeling of many types of events, affecting routing metrics and routing decision
process,
o wireless medium characteristics handling per link or node,
o GUI for easy debugging that allows for link and node behavior changes during
simulation run‐time,
o development of routing algebra formalism framework for defining OFs based on
composite routing metrics to support advanced QoS requirements,
o development of a variety of performance metrics.
Evaluation of the VITRO routing solution for objective functions incorporating single routing
metrics based on extensive computer simulations. The target in this step is to show that
each of them leads to optimization of a specific performance parameter, capturing events
related to the metric in use.
Evaluation of the VITRO routing solution for objective functions incorporating more than
one routing metrics based on extensive computer simulations. The target in this step is to:
o assess how well the different performance targets are met adopting different
composition approaches (e.g. lexical, additive). For example, an application may
tolerate a low packet loss value but require very low latency. In this case, the
objective function should combine ETX with HC. The combinations are tested to
evaluate the performance achievements.
o provide guidelines on the use of the routing metrics and their combinations (which
approach fits to which quality of service metrics) and on how to handle the
flexibility of the VITRO routing solution (i.e. which metrics to combine, how to set
the metric weight factors).
Verify the VITRO routing protocol design and provide guidelines on its handling under
different circumstances.
The main performance metrics measured include:
Packet loss: this metric indicates whether the routing protocol avoids lossy links and
misbehaving nodes.
20. FP7‐ICT‐257245 ‐ VITRO
D4.3 ‐Trusted Routing Protocol Prototype Implementation And Simulation Results
20 of 118
3. Simulation Platforms and Validation Results
In this chapter we present the models developed in the framework of WP4 for the evaluation of the
protocols affecting the routing performance and the results obtained through extensive simulations.
3.1. Simulations on RPL
To evaluate the efficiency of the VITRO cross‐layer and trust‐aware routing protocol which is
compatible with the IETF RPL protocol, we have modeled our solution using the open source JSIM
simulation platform. We have chosen JSIM because it offers physical layer models for wireless
sensor networks and allows for simulating large number of nodes (which suits the VITRO vision). In
Annexes C and D, an installation guide for JSIM is presented for WINDOWS, UNIX and MAC
Operating Systems.
In all the simulation runs reported in this section, the network consists of 100 nodes, placed on a
10x10 grid. The numbering scheme followed is shown in Figure 7. The sources generating data
follow the Constant Bit Rate model and transmit a data packet in strictly periodic manner (every 2s
unless otherwise stated). The same happens with the DIO messages. Since in VITRO we consider
that the adopted parameters change dynamically, the trickle time was not modeled and the inter‐
DIO time was assumed constant and equal to 4s.
n8 n18 n28 n38 n48 n58 n68 n78 n88 n98
n6 n16 n26 n36 n46 n56 n66 n76 n86 n96
n4 n14 n24 n34 n44 n54 n64 n74 n84 n94
n2 n12 n22 n32 n42 n52 n62 n72 n82 n92
n9 n19 n29 n39 n49 n59 n69 n79 n89 n99
n7 n17 n27 n37 n47 n57 n67 n77 n87 n97
n5 n15 n25 n35 n45 n55 n65 n75 n85 n95
n3 n13 n23 n33 n43 n53 n63 n73 n83 n93
n1 n11 n21 n31 n41 n51 n61 n71 n81 n91
n0 n10 n20 n30 n40 n50 n60 n70 n80 n90
Figure 7: The topology considered during the simulation tests
Based on the developed model, it is possible to measure the performance using objective functions
where only one primary metric is taken into account or multiple routing metrics are combined
either in lexical or additive manner. The performance metrics supported by our model include:
latency, throughput, packet loss, energy, attacks, overhead (DIO, Data messages).
In the sequel, we investigate and compare the performance for different objective functions in
order to reach conclusion regarding their use.
22. FP7‐ICT‐257245 ‐ VITRO
D4.3 ‐Trusted Routing Protocol Prototype Implementation And Simulation Results
22 of 118
Figure 9: The Energy consumption of key nodes
It is evident that node 11 consumes significantly more energy than node 68 since it is used for
forwarding data packets generated by nodes 20, 50, 80, 97, 65. Node 11 consumes 50% of its
energy in the first 3400s while node 68 consumes less than 25% in the same time period. Comparing
the energy consumption of nodes 12 and 68, we see that node 12 consumes more energy because it
forwards control traffic gathered from 7 nodes (in the path) while node 68 is forwarding data
packets from one session and control traffic from one node.
3.1.1.2 ETX metric simulation results
Adopting only ETX as the routing metric results in the same DODAG formation as well as energy and
latency results when all links are good and all layer 2 frames are acknowledged.
Setting two nodes (namely nodes 10 and 11) receiving correctly half of the packets transmitted to
them and thus acknowledging half of the received traffic, the DODAG structure becomes as shown
in Figure 10. The length of the paths has not changed but the nodes not receiving all packets
correctly are avoided.
Figure 10: The DODAG structure when nodes 10 and 11 are not receiving all packets correctly and
ETX is adopted as the only routing metric
23. FP7‐ICT‐257245 ‐ VITRO
D4.3 ‐Trusted Routing Protocol Prototype Implementation And Simulation Results
23 of 118
As regards energy consumption, the results depicted in Figure 11 show that the energy
consumption for node 11 is reduced since it is no longer part of the paths forwarding data
messages, while for node 12 no significant difference is observed. (In this figure the energy
consumption for the first 3500s is shown since in this time period data packet forwarding takes
place.)
Figure 11: Energy consumption when nodes 10 and 11 are acknowledging half of the received
frames and ETX is adopted as the only routing metric
When the number of nodes not receiving correctly all layer 2 traffic (called hereafter congested
nodes) increases, the path length (in general) increases to avoid the congested nodes up to a certain
extent which depends on the exact ETX values. For example, when the situation becomes as shown
in Figure 12 (left hand figure), where nodes 10, 11, and 12 receive correctly half of the traffic while
nodes 13, 14, 15 and 16 acknowledge only 10% of the received traffic, the congested nodes’ column
is traversed at the node with the higher link rate (the node which drops the less layer 2 frames). In
this case, the DODAG structure becomes as shown in Figure 12 right hand figure. Note that to avoid
all nodes dropping partly the received traffic would lead to a total rank value higher than the one
calculated for the followed path.
Figure 12: The topology and DODAG structure adopting ETX as the routing metric in the case
where 7 nodes drop layer 2 frames
Moreover, we have run a simulation scenario set for different number of nodes not acknowledging
30% of the received frames by adopting a) only ETX as the routing metric and b) only HC as the
routing metric. The results in terms of frame delivery rate are included in Figure 13. It is obvious
24. FP7‐ICT‐257245 ‐ VITRO
D4.3 ‐Trusted Routing Protocol Prototype Implementation And Simulation Results
24 of 118
that when the objective function is evaluated based on the ETX only, the frame delivery ratio is very
close to 100% even when 30 nodes are congested (the precise value obtained for 30 congested
nodes was 99.94%). Calculating the objective function based only on HC, the congested links are not
detected and thus the frame delivery rate drops to 85%. It is worth reminding that these losses will
be recovered based on link‐layer retransmissions, which however introduce significant latency and
more importantly energy cost.
0
10
20
30
40
50
60
70
80
90
100
0 5 10 15 20 25 30 35
Frame delivery (%)
Congested nodes (%)
ETX
HC
Figure 13: Frame delivery rate for different number of “congested nodes” i.e. node acknowledging
part of the received traffic using HC or ETX for the evaluation of the objective function.
The measured mean packet latency is shown in Figure 14 and shows that as the number of
congested nodes increases, when routing decisions are based on ETX, to avoid the congested links,
longer paths are selected. The difference is less than one hop on average (each hop costs 1.5ms).
These results show that the latency when all links/nodes are good is almost the same irrespective of
the metric adopted for the formation of the DODAG. When this assumption does not hold, making
the routing decisions based on ETX leads to better performance in terms of frame delivery ratio
than based on HC at the cost of a slight increase in latency. (Of course, this holds as soon as a
reliable way to evaluate the link quality is adopted, given the considerations and results presented
in Section 2.2.)
0
2
4
6
8
10
12
14
16
0 5 10 15 20 25 30 35
Mean Latency (ms)
Congested nodes (%)
ETX
HC
Figure 14: Mean packet latency for different number of “congested nodes” i.e. node
acknowledging part of the received traffic using HC or ETX for the evaluation of the objective
function.
25. FP7‐ICT‐257245 ‐ VITRO
D4.3 ‐Trusted Routing Protocol Prototype Implementation And Simulation Results
25 of 118
3.1.1.3 RSSI metric simulation results
The situation changes when RSSI is adopted as the sole routing metric. In this case, the DODAG
becomes as shown in Figure 15. Since each node prefers to use as parent the node associated with
the stronger received signal strength, the closer node is chosen. This has a direct impact on the
number of hops traversed by the data packets and on the overall energy consumption. In other
words, since the paths include more nodes, more energy is consumed for the transmission of the
same amount of data as shown in Figure 16. In detail, for the correct delivery of (1600*7=) 11.200
data packets to their destination, adopting only HC or only ETX, 79.991 transmissions were
performed. In the RSSI case, this number raised to 119.997, i.e. almost 40% more transmissions.
Figure 15: The DODAG structure when RSSI is adopted as the routing metric
Figure 16: The energy consumption for the RSSI routing metric
3.1.1.4 PFI metric simulation results
In the case that a network operates in an adversary environment and the cooperation with
benevolent nodes is of prime importance, the PFI metric can be used to evaluate the rank of each
node. When no malicious nodes exist in the network, the constructed DODAG is the same with the
one formed based on HC or ETX. When malicious nodes exist, the path is altered so as to avoid the
malicious nodes. This is proved a) by the DODAG structure shown in Figure 17 and b) by the
27. FP7‐ICT‐257245 ‐ VITRO
D4.3 ‐Trusted Routing Protocol Prototype Implementation And Simulation Results
27 of 118
0
2
4
6
8
10
12
14
16
18
0 5 10 15 20 25 30 35
Mean latency (ms)
Penetration of GH (%)
HC
PFI
Figure 19: Mean packet latency for different penetration of grey‐hole nodes evaluating the rank
based on HC or PFI
In Figure 20, we present results from an extreme scenario, where 48 nodes are acting maliciously
(33 grey‐holes and 15 black‐holes). For the session from node 96 to node 0, it took 89 attempts
through malicious nodes (33 grey‐hole attacks and 15 black‐hole attacks) to discover a route
bypassing all malicious nodes. A first important conclusion is the ability of the routing protocol to
stretch to that extend that nearly doubles the number of hops (from ideally 9 to realistic 16 hops). A
second conclusion is related to the responsiveness of the routing protocol in the presence of
malicious nodes reaching almost 50% of the total number of nodes comprising the network
topology. It can be observed that after the 100th
packet, the traversed path is free from attacking
nodes.
Figure 20: A network topology consisting of 48 misbehaving nodes and the respective DAG
structure when PFI is only taken into account
3.1.2. Combining routing metrics
The reason we defined multiple primary routing metrics in VITRO was to enable the realisation of a
routing protocol that can meet the quality of service requirements of different applications. For
example, mission critical applications may require low latency while environmental monitoring
application may require extended lifetime. To satisfy the QoS requirements of the application that
the VITRO solution can serve, the objective function can be built on one or more primary routing
metrics. For example, an application may set a threshold on the tolerated packet loss and define
that apart from this threshold, the network lifetime is of importance to this application. In this case,
28. FP7‐ICT‐257245 ‐ VITRO
D4.3 ‐Trusted Routing Protocol Prototype Implementation And Simulation Results
28 of 118
primary routing metrics that target the improvement of reliability should be combined with the
remaining energy primary routing metric. In other words, VITRO does not propose to use the
defined routing metric all together. More precisely, special care has to be paid on the combination
of the primary routing metrics. As shown in the previous section, HC and ETX lead to the
construction of shorter paths while RSSI leads to (possibly) longer but stronger paths. In this view,
there is no incentive in combining HC and RSSI in a composite routing function.
Our aim in this section is to investigate the performance achieved when two or more primary
routing metrics are combined in order to:
a) assess the benefits of composite routing metrics, and
b) guide a prospective user to define the appropriate objective function depending on the QoS
requirements imposed by an application.
3.1.2.1 Combining HC and PFI
If an application has latency and loss (either caused from congestion or malicious behaviours or any
other reason) requirements, the hop count or the latency has to be combined with the PFI routing
metric. To evaluate the benefits of this metric combination, we have carried out simulations for
different penetrations of misbehaving nodes performing grey‐hole attacks and different composite
metrics. In these simulations, it is assumed that the nodes that perform grey‐hole attacks randomly
drop half of the received traffic, i.e. they deny forwarding 50% of the data traffic passing through
them, and they are randomly distributed in the grid. Six data sessions are initiated with the sources
being randomly distributed and the root node being the node in the upper left corner (i.e., node 0).
We compare the case where Hop count is used as the only routing metric to the case where Hop
Count is combined with PFI in either additive or lexical routing metrics. More specifically, for the
additive composite metric, we tested different weights for the pair (HC, PFI), i.e. the objective
function adopted is: PFIaHCm 21
The adopted performance metrics are packet loss and latency since they express the application
requirements. The results are depicted in Figure 21.
0
10
20
30
40
50
60
70
0 10 20 30
Packet loss (%)
Penetration of misbehaving nodes (%)
HC
Add HC, PFI (0.25, 0.75)
Add HC, PFI (0.5, 0.5)
Add HC, PFI (0.75, 0.25)
Lex (HC, PFI)
Lex (PFI, HC)
Add HC, PFI (0.1, 0.9)
Add HC, PFI (0.9, 0.1)
PFI
Figure 21: Packet loss vs. penetration of misbehaving nodes for different metric combinations
The packet loss results show that if the hop count is the only routing criterion, then, even with low
penetration of misbehaving nodes and even if these nodes perform grey‐hole (and not black‐hole)
attacks, the packet loss raises very rapidly. All tested composite routing function combining PFI with
hop count offers better performance in terms of packet loss. The improvement ranges from 5‐60%
which shows that the composite routing functions enable the detection of misbehaving nodes and
the selection of paths that are more reliable concurrently.
29. FP7‐ICT‐257245 ‐ VITRO
D4.3 ‐Trusted Routing Protocol Prototype Implementation And Simulation Results
29 of 118
Another very interesting result is that the additive composite function for any tested metric weight
pair leads to significantly better performance than the lexical composite function when the hop
count is inspected first. This is due to the fact that in the case of lexical combination, the PFI metric
is inspected only when alternative paths of equal length with different PFI values exist. The paths
avoiding the misbehaving nodes are longer (as indicated by the latency results shown in Figure 22)
since to avoid the misbehaving nodes the shortest path can no further be used. The increase in
latency is on average less than one hop time (in our model, each hop costs 1.5ms of delay), which is
rather negligible compared to the packet loss improvements.
0
2
4
6
8
10
12
14
16
18
0 5 10 15 20 25 30
MEan latency (ms)
Penetration of grey hole nodes (%)
HC
Add HC, PFI (0.25, 0.75)
Add HC, PFI (0.5, 0.5)
Add HC, PFI (0.75, 0.25)
Lex (HC, PFI)
Lex(PFI, HC)
Add HC, PFI (0.1, 0.9)
Add HC, PFI (0.9, 0.1)
PFI
Figure 22: Latency vs. penetration of misbehaving nodes for different metric combinations
Focusing on the additive composite routing metric, significant differences are observed for different
weight value pairs. When emphasis is put on hop count (e.g., weight pair=(0.75, 0.25)), the packet
loss is higher than the case where the HC is assigned a lower weight shifting emphasis on reliability
through the PFI metric. This always comes at the cost of small increase in latency.
With respect to how fast the misbehaving nodes are detected and the path is modified, based on a
highly dynamic metric as the PFI, the faster the detection of misbehavior is, the less “attacks” in
terms of packets not being forwarded are observed. For this reason we have also measured the
attacks and the results are shown in Figure 23. The performed attacks curves match the packet loss
curves, which is completely expected.
0
1000
2000
3000
4000
5000
6000
7000
8000
9000
0 10 20 30
Performanc eattacks
Penetration of misbehaving nodes
HC
Add HC, PFI (0.25, 0.75)
Add HC, PFI(0.5, 0.5)
Add HC, PFI (0.75, 0.25)
Lex (HC, PFI)
PFI
Figure 23: Measured attacks vs. penetration of misbehaving nodes for different metric
combinations
30. FP7‐ICT‐257245 ‐ VITRO
D4.3 ‐Trusted Routing Protocol Prototype Implementation And Simulation Results
30 of 118
3.1.2.2 Combining HC and RE
To evaluate the benefits of combining the remaining energy levels with the distance‐related
attributes (e.g. HC) we have carried out a simulation scenario set where several nodes are
transmitting data packets towards the same destination (root node) in the topology of 10x10 grid.
The initial energy of each node is set equal to 1000 energy units and the transmission power is set
equal to 6.6energy units per second. It is worth noticing that our aim is to evaluate the differences
in energy consumption between different routing protocol alternatives and thus no special care was
paid to choose these values in a realistic manner.
When the Hop Count is the only routing metric used, the paths to the root are static, since no
dynamic routing metric is taken into account. The data paths from five data sessions pass from the
same node (which is close to the root), namely node 11, while a neighbouring node (node 12)
forwards packet from one flow only. Thus, the energy consumption rate of node 11 is expected to
be higher than that of node 12. Another node, node 68, is neither generating nor forwarding data
packets and, consequently, has lower energy consumption rate than both nodes 11 and 12. Taking
into account that the network lifetime is in general expressed as the time during which the
percentage of alive nodes is higher than a pre‐set threshold, it is evident that balancing the energy
consumption can be interpreted in longer network lifetime. For this reason, we focus our
measurements on the energy consumption of nodes 11, 12 and 68. The results regarding the energy
consumption rate, expressed in ratio of initial energy consumed every ms, are depicted in Figure 24
(the number of routed flows depicted in the labels corresponds to the case when the HC is the only
routing metric).
0
0.03
0.06
0.09
0.12
0.15
0.18
Energy consumption rate
Node 11 (routing 5 flows)
Node 12 (routing 1 flow)
Node 68 (routing 1 flow)
Figure 24: Performance comparison in terms of energy consumption rate expressed in ratio of
initial energy consumed every ms combining Hop Count and remaining energy in composite
routing metrics
Combining the hop count metric with the remaining energy metric (which is a highly dynamic
metric) is expected to relief node 11 from its forwarding task. As shown in Figure 24, when routing
is decided based only on hop count, node 11 has the higher energy consumption rate, with node 12
following while node’s 68 energy consumption is the lowest of the three. Combining hop count with
the remaining energy, either in a lexical or in an additive manner, the neighbors of node 11 will
select another node offering a path to the root for forwarding their packets. This is proven by our
simulation results, which show that node 11 and node 12 “share” the forwarding load and have
almost equal energy consumption for any tested combination of the hop count and remaining
energy metrics. Their energy consumption rate is 15% lower on average than the one observed for
the hop count case. The energy consumption of both node 11 and node 12 is lower than the one
observed for routing based on the hop count only, which also indicates that the path alters
31. FP7‐ICT‐257245 ‐ VITRO
D4.3 ‐Trusted Routing Protocol Prototype Implementation And Simulation Results
31 of 118
dynamically based on the remaining energy of the candidate forwarding nodes. This comes at the
cost of energy consumption increase for node 68, since the forwarding load can be distributed but
not avoided. It is evident from the results that the energy consumption is better distributed among
the nodes in the network. It is particularly important that the major difference is observed in the
energy consumption of node 11 which, in case of using only the HC as routing metric, is the most
stressed node.
With regards to the additive composite metric, we have tested different weight factors for hop
count and remaining energy. The weights tested sum up to 1 and the weight of hop count is also
indicated in the figure. While the differences are not evident in the figure, as the weight of hop
count decreases an additional 1% energy saving is achieved. Comparing the additive case with the
lexical, the energy consumption of the lexical is almost the same with the one observed for hop
count weight below 0.6.
12.5
13
13.5
14
14.5
15
15.5
Average Latency (ms)
Figure 25: Performance comparison in terms of latency combining Hop Count and remaining
energy in composite routing metrics
If the remaining energy is combined with hop count in a lexical composite metric (HC, Remaining
Energy), then the selected path will always be the shortest, i.e. the one that would be selected
adopting only hop count. If the remaining energy and hop count are combined in an additive
manner, then it is possible that a neighbor with slightly longer path to the root than the optimal can
be selected if its remaining energy is significantly higher than the energy of the best neighbor. To
assess this effect, we have measured the average latency observed for all the data packets
transmitted in the network. The results, shown in Figure 25, reveal interesting features: first, the
latency observed for lexical combination of hop count and remaining energy is significantly lower
than the one observed for routing on hop count. The reason is that when the hop count is only
taken into account, there are nodes (like node 11) that forward data from multiple flows and thus
they queue packets before forwarding them, while additionally the related links become congested.
By adopting the lexical approach, the shortest path is selected but among nodes offering paths of
equal length, the one that has higher remaining energy is selected, i.e. the load is distributed. This
can be easily explained using the following Figure 26. While adopting hop count, the paths towards
the root node (node 2) from nodes 32 and 52 pass from node 11 (solid lines); when the remaining
energy is taken into account, node 32 decides to route its packets through node 22 (dashed lines)
and thus node 11 is relieved from this data flow. The remaining energy is a highly dynamic node
attribute and can drive nodes to change their parent after each transmission, since its remaining
energy may be less than the other’s. To avoid frequent parent shifting, a hysteresis threshold can be
defined such that small alterations in Rank will not dictate frequent parent shifting, thus preserving
32. FP7‐ICT‐257245 ‐ VITRO
D4.3 ‐Trusted Routing Protocol Prototype Implementation And Simulation Results
32 of 118
route stability. The hysteresis function can be used with additive metrics that must be minimized on
the paths selected for routing.
1
2
11
12
21
22
31
32
41
42
51
52
Figure 26: Example topology: alternative paths of equal length exist for node 32 (e.g. solid line,
dashed line)
Comparing the latency results for the additive approach, the latency strongly depends on the
adopted weight values. For weight values greater than 0.6 for the hop count, the latency is very low
and is equal to the one observed for the lexical approach.
To this end, when the hop count and the remaining energy are combined either in a lexical or
additive composite function significant energy savings can be reached. Additionally, significant
improvements in quality of service in terms of latency are observed using lexical or additive with hop
count weight above 0.6, due to the observed load balancing effect.
3.1.2.3 Combining ETX and PFI
To investigate the behaviour of the VITRO routing solution taking into account the ETX and PFI
routing metrics, we have carried out a scenario set where different combinations of ETX and PFI
were used in the objective function.
First we performed simulations where the Objective Function was based on ETX only. In this case,
the shortest path is defined, in case no ETX variations among nodes are measured, i.e. all nodes
forward data and no congestion occurs. The path followed for the data session between node 97
and 2 is shown in Figure 27. A path of equal length is followed when PFI is adopted and no malicious
nodes exist in the network.
a) b)
Figure 27: The path connecting node 97 with the root node 2 when a) no malicious nodes exist
and b) when a grey‐hole node and a node with low layer‐2 reliability exist in the path
To investigate the impact of nodes which are not acknowledging all layer‐2 frames (called congested
or “NoAck” nodes) and nodes dropping half of the received traffic (called hereafter grey‐hole
nodes), we run a scenario where node 86 and 87 are behaving as NoAck and Greyhole nodes
respectively. Adopting the lex(ETX, PFI) combination, the path becomes as shown in Figure 27b, i.e.
the misbehaving nodes are detected and avoided.
34. FP7‐ICT‐257245 ‐ VITRO
D4.3 ‐Trusted Routing Protocol Prototype Implementation And Simulation Results
34 of 118
To evaluate the performance difference, we summarised the results of all the scenarios run for this
purpose in Figure 30.
0
10
20
30
40
50
60
70
0 5 10 15 20 25 30
Packet Loss (%)
Penetration of misbehaving nodes (%)
ETX
PFI
Lex(ETX, PFI)
Lex(PFI, ETX)
Add(ETX, PFI) (0.5, 0.5)
Add(ETX, PFI) (0.25, 0.75)
Add(ETX, PFI) (0.75, 0.25)
Figure 30: Packet loss vs. penetration of misbehaving nodes for different combinations of ETX and
PFI routing metrics
It is evident that the packet loss observed for the case where only ETX is taken into account is the
highest, since such a routing metric does not take into account any malicious behavior. In other
words, if a node acknowledges the reception of frames, even if this node does not actually forward
this packet, the source node will continue to co‐operate with it. Any other objective function taking
into account PFI succeeds in detecting malicious nodes and avoids them. Although performance
differences exist among them, the difference from the ETX case is evident.
The lexical (ETX, PFI) composite routing metric behaves more close to the primary ETX metric, as
expected. Additionally, among the additive composite routing functions tested the add(ETX, PFI)
with weight values (0.75, 0.25) exhibits performance close to the Lex(ETX, PFI) since this additive
places more emphasis on the ETX metric. Similarly, the Lex(PFI, ETX) composite routing function
performs similarly to the add(ETX, PFI) with weight values (0.25, 0.75) shifting emphasis to PFI.
Finally, very low packet loss is observed for the balanced additive composite routing metric where
equal weights are assigned to the two primary routing metrics.
With regards to the latency, this is depicted in Figure 31 for all tested routing metric combinations.
It is obvious that the improvement in packet loss comes at the cost of increase in latency which is,
however, on average very low (lower than 1ms) apart from the PFI case in extremely adversary
environments.
12
13
14
15
16
17
18
19
0 10 20 30 40
Latency (ms)
Penetration of misbehaving nodes (%)
ETX
PFI
Lex(ETX, PFI)
Lex(PFI, ETX)
Add(ETX, PFI) (0.5, 0.5)
Add(ETX, PFI) (0.25, 0.75)
Add(ETX, PFI) (0.75, 0.25)
Figure 31: Mean latency vs. penetration of misbehaving nodes for different combinations of ETX
and PFI routing metrics
35. FP7‐ICT‐257245 ‐ VITRO
D4.3 ‐Trusted Routing Protocol Prototype Implementation And Simulation Results
35 of 118
To assess how fast the malicious nodes are detected, we measured the grey‐hole attacks (i.e. the
number of packets not forwarded by network nodes) and the MAC attacks (i.e. the number of
frames not acknowledged at layer 2 by the congested, or NoAck, nodes). The results are included in
Figure 32 and Figure 33. It is evident that the composite routing functions placing emphasis on the
detection of grey hole attacks (e.g. Lex(PFI, ETX) or Add(ETX, PFI) with weight values equal to (0.25,
0.75)) succeed in detecting grey‐hole attackers very promptly while they need some time to detect
the “MAC attackers”. The reverse is the case for the composite routing functions placing emphasis
on the detection of grey‐hole (i.e. routing) attacks. This observation leads to the conclusion that
(since the situation is not known a priori), using the additive composite routing function with equal
weights assigned to PFI, ETX leads to good performance in both cases and in much better
performance than adopting only one primary routing metric.
0
1000
2000
3000
4000
5000
6000
0 10 20 30
GH attacks
Penetration of misbehaving nodes(%)
Lex(ETX, PFI)
Lex(PFI, ETX)
Add(ETX, PFI) (0.5, 0.5)
Add(ETX, PFI) (0.25, 0.75)
Add(ETX, PFI) (0.75, 0.25)
Figure 32: Grey Hole Attacks vs. penetration of misbehaving nodes for different combinations of
ETX and PFI routing metrics
0
5000
10000
15000
20000
25000
30000
35000
0 10 20 30
MAC attacks
Penetrations of misbehaving nodes(%)
ETX
PFI
Lex(ETX, PFI)
Lex(PFI, ETX)
Add(ETX, PFI) (0.5, 0.5)
Add(ETX, PFI) (0.25, 0.75)
Add(ETX, PFI) (0.75, 0.25)
Figure 33: Mac Attacks vs. penetration of misbehaving nodes for different combinations of ETX
and PFI routing metrics
3.1.2.4 Combining HC and ETX
For a path to the root to be constructed, at least one strictly monotonic metric has to be taken into
account. If only HC is considered, the shortest path to the root is defined and each node selects as
36. FP7‐ICT‐257245 ‐ VITRO
D4.3 ‐Trusted Routing Protocol Prototype Implementation And Simulation Results
36 of 118
its parent the one‐hop neighbour that is closer to the root. The same path is constructed if only ETX
is taken into account and all links are equally lossy/reliable. On the contrary, the use of RSSI leads to
the construction of a really strong path with many hops and, thus, the latency and energy
consumption increases.
To create short paths avoiding lossy links (i.e., links with losses that are due either to congestion or
any physical layer reason), the hop count can be combined with ETX. To investigate the impact of
this combination, we have performed simulations where only one node, the node located in the
lower right corner of the grid (node 99) transmits data towards the root which is located in the
upper left corner of the grid (node 0). The paths established based only on the hop count are shown
in Figure 34a, and these are the shortest ones. (It is reminded that in our RPL model the paths are
constructed prior to any data exchange activity between the nodes and the root.)
Assuming that node 44 acknowledges 20% of the received traffic, if this node is not avoided (as
would happen if only HC was taken into account), then very high frame loss (equal to 80%) would be
observed. If the ETX is taken into account, the ETX value calculated for this node’s link increases and
if routing is decided based on the ETX metric only, the path changes to the one shown in Figure 34b,
i.e. the lossy link is avoided. This path is longer by one hop than the shortest path, which causes an
increase in latency and in the number of transmissions needed for the frames to reach the root,
however, achieving zero packet loss. In other words, latency is sacrificed to reduce (or eliminate if
possible) packet loss.
a
Node 44
b
Figure 34: Paths constructed based a) on hop count (b) on ETX when node 44 acknowledges 20%
of the received messages
Combining the hop count and ETX in a lexical composite routing metric, the simulations have shown
that different ETX values will cause a path alteration, only if alternative paths with the same hop
count exist, which is not the case in the presented example. In other words, in this case, the lexical
composite routing of HC and ETX does not lead to loss‐free path.
Combining the hop count and ETX in an additive manner, the constructed path avoids the weak link
(i.e. the path becomes as shown in Figure 34b) as soon as the hop count metric is assigned a weight
value α1 lower than 0.75. In other words, the path increases by one hop to avoid the weak link. For
weight values greater than or equal to 0.75, i.e. when emphasis is placed on the hop count, the
constructed path is the path calculated when only HC is taken into account, i.e. the shortest one,
even though lossy. It should be stressed here that if more than one weak links exist in the path, then
the probability for a packet to successfully reach the root drops dramatically since the loss
probability of the path is the combination of the loss probability of the links. In this case, the
combination of HC and ETX has significantly better results in terms of packet loss compared to the
case where only HC is used.