1. BMAN
31000
5832846
-‐1-‐
Environment
and
Financial
Sustainability
of
BMW
Table
of
Contents
1.0
EXECUTIVE
SUMMARY
.............................................................................................
2
2.0
OUR
PROFILE
.......................................................................................................
2
2.1
Sustainability
–
An
Introduction
............................................................................................
3
2.2
Task
.......................................................................................................................................
4
3.0
INDUSTRY
ANALYSIS
................................................................................................
4
4.0
BRAND
POWER
.....................................................................................................
6
5.0
REGULATION
........................................................................................................
7
5.1
Non-‐industry
specific
treaties
...............................................................................................
8
5.2
Industry
Specific
Agreements
................................................................................................
8
5.3
Excise
Based
Regulation
......................................................................................................
10
6.0
SUSTAINABLE
MANUFACTURING
................................................................................
12
6.1
Introduction
........................................................................................................................
12
6.2
Emission
Figures
.................................................................................................................
13
6.2.1
CO2
Emissions
(tonnes/unit)
.......................................................................................
13
6.2.2
Energy
Consumption
(MWH/unit)
...............................................................................
13
6.2.3
Total
Freshwater
Consumption
and
Total
Wastewater
(m3
/unit)
...............................
13
6.2.4
Investment
in
Environmental
Protection
(euro/unit)
..................................................
14
6.2.5
Summary
......................................................................................................................
14
6.3
Current
Drive-‐train
Innovation
............................................................................................
14
6.4
Medium
Term
–
In
the
Pipeline
...........................................................................................
16
6.4.1
New
Vehicles
...............................................................................................................
16
6.4.2
Passive
modification
....................................................................................................
17
6.5
Long
Term
–
The
Future
......................................................................................................
18
7.0
FINANCIAL
ANALYSIS
.............................................................................................
19
7.1
Profitability
.........................................................................................................................
19
7.1.1
Net
Revenue
................................................................................................................
20
7.1.2
Net
Margin
...................................................................................................................
20
7.1.3
Return
on
Equity
(ROE)
................................................................................................
21
7.1.4
Price/Earnings
(P/E)
Ratio
............................................................................................
21
7.1.5
Return
on
Asset
(ROA)
(%)
..........................................................................................
22
7.2
Environmental
Indicators
....................................................................................................
22
7.2.1
Property,
Plant
and
Equipment
...................................................................................
22
7.2.2
R&D/Sales
Ratio
...........................................................................................................
23
7.3
Share
Price
Information
......................................................................................................
23
7.3.1
Shareholder
Constitution
.............................................................................................
23
7.3.2
Findings
........................................................................................................................
24
8.0
FUTURE
OUTLOOK
................................................................................................
25
8.1
SWOT
Analysis
....................................................................................................................
25
8.1.1
Strengths
......................................................................................................................
25
8.1.2
Weaknesses
.................................................................................................................
25
8.1.3
Opportunities
...............................................................................................................
26
8.1.4
Threats
.........................................................................................................................
26
9.0
PROPOSAL
........................................................................................................
27
10.0
BIBLIOGRAPHY
..................................................................................................
29
2. BMAN
31000
5832846
-‐2-‐
1.0 Executive Summary
The report begins by introducing the pension fund and briefly explaining current problems
faced by the global population and how to solve them. The companies under review –BMW and
VW are introduced briefly; followed by a historical industrial account of the motor-car, how it is
perceived today and potential change in the future. The performance of the company is glanced
through and how the automotive industry is affected by regulation is highlighted. Next we examine
the sustainability of the firms, first by looking at emissions and investment in environmental
protection. We then move on to the strategies they have in place, technologies in the pipe line and
lastly what is installed for the future. The profitability of the company and its commitment towards
the environment is studied, ending with a SWOT analysis and a proposal for A&O.
2.0 Our Profile
At Alpha&Omega (A&O) Pension Fund, our main objectives are to provide the best rates to
our policyholders to guarantee a happy, worry-free retirement. Secondly, we focus on socially
responsible investments (SRI), by not exploiting the poor and ensuring that the well being of
communities are cared for; whilst enhancing our portfolio.
There is also significant pressure to increase the value of our fund more effectively and
efficiently than in the past few decades due to the ageing population – the baby boomers and
dropping birthrates in the UK and Europe1
. The elderly form an even larger part of the population.
The result is a smaller workforce to fund a larger crowd of pensioners.
We have to be more vigilant on our asset holdings due to a recent increase in policyholders
who arrived after suspension of numerous company schemes guaranteeing a fixed proportion of
salary in old age2
.
Conventionally, funds have been invested by replicating stocks in portfolios, holding stocks
for 1-2 years, selling to realise meagre gains of up to 15%. At A&O, we want to focus on long term
1
Human Development Report, United Nations, 2005
2
How bad is the UK pension crisis, BBC News, 23 Sept 2005
3. BMAN
31000
5832846
-‐3-‐
gains with high returns to boost our reserves. We wish to ensure that clients retreat into a
comfortable old age with their funds maturing gracefully under our management, boosting the base
annuity payout with a bonus by investing wisely in sustainable companies.
A referendum has been drafted by the investment committee to reevaluate our position in the
global economy to ensure the best growth and maturity of the fund over a 15 – 20 year horizon.
Sustainable economic developments in various global industries have been highlighted as these
sectors can generate ethical yet abundant income towards our fund.
2.1 Sustainability – An Introduction
“The concept of sustainable development [is the] guiding principle for a livable future
[where needs are met] without compromising the ability of future generations to meet their own
needs.”3
Lately, we are plagued with surmounting concerns of Global Warming and are at the most
crucial period in deciding the future economic global performance. “One percent of global GDP per
annum is required to be invested to avoid the worst effects of climate change. Failure to do so could
risk global GDP being up to twenty percent lower than it otherwise might be…our actions over the
coming few decades could create risks of major disruption to economic and social activity…
[similar] to the great wars and the economic depression of the first half of the 20th century.4
”
The public is becoming more and more aware of the impact of their actions towards the
environment; an emerging market towards sustainability has surfaced. Coupled with increasing
costs of petrol, consumers are switching over to more fuel efficient cars. Many companies have
altered their strategy to accommodate an ever-warming world.
Our decisions will affect the livelihood of our offspring and we must act to improve their
quality of life. At A&O, we have the collective authority to support corporations which are
authentic in their cause and are responsible towards sustainable development.
3
Report of the World Commission on Environment and Development, United Nations, 1987
4
Stern Review on the Economics of Climate Change, 2006
4. BMAN
31000
5832846
-‐4-‐
2.2 Task
This report is aimed at investigating sustainable manufacturing in the automotive industry.
Two companies will be closely examined in this report. The main company in focus is BMW;
Volkswagen (VW) will be of secondary importance and will be the benchmark. VW serves as a
background to contrast the main subject, BMW.
Bayerische Motoren Werke (BMW), headquartered in Munich, Germany is the world's
leading performance-luxury manufacturers of cars. BMW is the parent company for Mini and Rolls-
Royce. At the core of BMW, radiates respect for the environment. Their users come from a niche
market that are willing to pay a premium for quality, performance and eco-friendly credentials; a
distinctive perception of luxury.
VW is the largest car manufacturer in Europe and the fourth largest in the world. Regardless
of income level, VW caters to everyone’s needs, synonymous with its name, which means
“People’s Car” in German. Its brands consist of Audi, Bentley, Bugatti, Lamborghini, Seat and
Skoda. VW is a large company by size, about 1 in 5 cars in Europe is a VW. VW has a significant
market share in the luxury market too through Audi, Bentley, Bugatti and Lamborghini.
VW’s huge scope makes it the ideal company to contrast financial and management
performance with BMW. BMW and VW are direct competitors, under the Audi brand. In the report,
we will investigate closely the development of sustainability in the premium segment.
3.0 Industry Analysis
The automotive industry is highly flexible, competitive and unique. Users come from
different hierarchies, ranging from low cost, mid-segment to the premium market. In the past few
decades, cars have become an essential part of life. “Without my car, I could not live where I do, eat,
shop, travel as I do, holiday where I do, perceive the world as I do.5
” It symbolises freedom and
independence.
5
Brandon, Auto mobile, p. 6
5. BMAN
31000
5832846
-‐5-‐
Tough competition exists in mature markets such as the United States and Western Europe;
with limited growth and strong cyclicality, variation in overall demand is an important driver of
earnings6
. The issue might be different for emerging markets where economic boom is at its peak
with many first time buyers. The motor car differentiates individuals and echoes class and status. ‘It
has long been recognized as a potent symbol of masculinity’7
. Each motor car portrays an image;
think James Bond and Aston Martin comes to mind.
Our addiction not only for raw brawn but also individual mobility has trapped us in a traffic
congested world. Many people would rather drive and be stuck in traffic than take public transport.
The consequence is energy waste leading to accelerated global warming.
It also fuels a country’s economy by providing work and creating a foreign trade surplus. In
Germany, 85% of the export surplus is generated by the motor industry which equated to €97
billion in 20068
. In Europe, there are 250 automotive production sites, supporting over 12 million
families9
.
Cars undergo constant innovation to improve performance and safety and new models are
launched every 4 -7 years. Those who can afford to replace their cars; will sell their previous car in
the second-hand market, where vehicles are bought by those who cannot afford new cars.
Through their manufacture and use automobiles create substantial wealth, investment and
jobs. But recently, competition with firms has amplified and manufacturers are suppressed by
regulation. The main factors are pollution – the cause of global warming, depletion of raw materials
and fuel causing an increase in prices. Only the fittest firms will survive.
Liquidity is tied up in Work in Progress and the design and development of a model is
critical to its success in the future. Every step has to be laid out methodically, as models for 2012
are already on the drawing tables today. Failure of a product launch will create extensive losses; all
is determined by public reception of the vehicle.
6
J Froud, Financialisation…
7
Thomas et al, Motor Car and the Popular Culture of the 20th
Century p. 3
8
VDA Annual Report, 2007
9
ACEA, http://www.acea.be
6. BMAN
31000
5832846
-‐6-‐
Foreign Direct Investment (FDI) is also important in this sector as the firms have to take
advantage of the foreign currency exchange rate. Decisions made can result in huge profits or
unwanted losses. For example, VW decided to set up a FDI in Brazil, but the high Brazilian Real10
is hurting its regional exports to the rest of South America. Manufacturing a low-range car in
Germany for sale in South America is not sensible, due to high labour costs eating up most of the
sale price. A strong currency is not always good. Recently, the weaker US Dollar and the stronger
Euro has caused dents in BMW’s profits. BMW has countered this by increasing production
capacity in their Spartanburg plant in the US and upping the amount of parts sourced in the US to
counter this loss11
. Most BMWs are manufactured in Germany and sold in the States; the labour is
priced in Euros but sold in US dollars (USD).When the USD depreciates a loss is experienced as
BMW cannot increase prices due to stiff competition from US and Japanese manufacturers.
4.0 Brand Power
One of the most
important elements in the
automotive industry is the
image that a brand name
portrays. ‘BMW is the
most focused brand in the industry, and a model for any company trying to figure out what it stands
for.’12
The company is ‘grounded in nearly airtight consistency [and] authenticity when it [comes to
their] vehicles13
’.
This is what gives BMW the competitive advantage over its rivals; reflected in their motto
‘The Ultimate Driving Machine’. BMW engineers fun, exhilaration and excitement into their
products. All of this comes at a premium, which consumers are willing to pay.
10
Fields of cars under gathering clouds, The Economist, Aug 31 2006
11
BMW CFO to boost defence against weak dollar – report, Reuters UK, Apr 12 2008
12
Bob Lutz, General Motors, Vice-Chairman of Product Development, Driven p. 2
13
ibid p.1
Figure
1:
BMW
historical
sales,
source:
Forbes
7. BMAN
31000
5832846
-‐7-‐
The brand gives BMW the advantage during publicity and advertising. As this image is
intertwined with the company name, BMW just has to deliver their products up to the driver’s
expectations and they have succeeded through their perseverance for consistency.
Over the years, their brand has grown in strength. Production has never once plummeted. In
2007, BMW group sold 1.5 million cars and have set their targets to 1.8 million per annum by 2012
to strengthen their global market position. The Mini has been an unexpected success; BMW had
found a premium small car which has sold 900,000 units globally since 2001.
VW’s humble origins from the Beetles in the 1960s to acquisition of more premium brands;
Bugatti, Lamborghini and Bentley in 1998 has made it a more recognized global player today. With
a huge number of brands under its umbrella, VW has a variety of models, catering for different
levels of society. Audi has been doing well with sales increasing by 9.2%14
in 2006, and VW sales
increased by 10%14
while Skoda was up by 11.7%14
in sales. The only problem child dragging
down sales volumes of VW is Seat where sales increased by only 1.9% in 200614
.
With a line of new and interesting models being launched, such as the new Audi TT, Audi
R8, which has been a success and their line of eco-friendly BlueMotion vehicles, is bound to
capture a loyal band of followers and buyers. In the next financial section, the attractiveness of VW
as an investment will be highlighted. VW captures a wider market; it concentrates on cost
leadership and differentiation through its premium brands at the same time.
5.0 Regulation
Government and regulatory bodies have drafted legislation to ensure products in the industry
are in line with the interest of Global Warming. Around 16%15
of global CO2 emissions and 27%16
of EU emissions (about half from cars) originate from Road Transport. There is abundant regulation
on vehicles on the road but in this section we will focus mainly on sustainability.
14
La galaxie VW au zenith, Capital, p. 32, Avril 2007
15
http://oica.net/category/climate-change-and-co2/
16
Collision course, The Economist, Dec 19 2007
8. BMAN
31000
5832846
-‐8-‐
5.1 Non-industry specific treaties
International treaties also exist to regulate the greenhouse gas (GHG) emissions such as the
Kyoto Protocol which came into force in 2005 and expires in 201217
. Lack of cooperation from the
United States and Russia has made it less successful. It is subjective as developing countries
(especially India and China) are exempted from emission reductions. However it serves as a
foundation for further development. Countries who have committed themselves to the treaty work
round the different sectors of their economy, cutting emissions where ever possible.
Following its footsteps, the European Emissions Trading Scheme (EU ETS) is a regional
agreement where Member States agree to national emission caps18
. Emissions (Carbon Credits) are
traded like a commodity where countries or companies that have excess emissions can trade with
those who need it. The automotive sector may be victimised to extreme standards to meet the
requirements. The two of these agreements are examples of national agreements which will
indirectly affect the automotive industry.
5.2 Industry Specific Agreements
A voluntary agreement was signed between European
Automobile Manufacturers Association (ACEA) and the EU in 1998
to reduce the average CO2 emissions to 140gCO2/km, a 25% reduction
from levels of 1998 (186gCO2/km). VW and BMW are struggling to
meet these targets, because they are makers of premium marques,
but BMW is one of the fastest-improving European carmakers;
Efficient Dynamics may push it to the top of the league in 200819
.
Further threat is on its way, when the European Commission in December 2007 published
its final proposals of an emission limit of 120gCO2/km by 2012. Failure to comply entails a fine of
€95 per gCO2/km for exceeding the limit of 120g/km19
. This is quite a stern ruling, practically, the
figure could be lower but we have a rough idea of the severity in the automotive industry. This
17
http://www.kyotoprotocol.com
18
http://ec.europa.eu/environment/climat/emission.htm
19
Collision course, The Economist, Dec 19 2007
Figure
2:
CO2
emissions
by
firm,
source:
Economist
9. BMAN
31000
5832846
-‐9-‐
shows the EC’s disdain with the automotive industry failing to comply with the 140g/km voluntary
limit, the average of the European car fleet in 2007 was 160g/km.
In October 2000, an EC directive on the End-of-Life vehicles (ELV) was passed and became
law in Member States in 2002 - aiming to reduce, or prevent, the amount of waste produced from
ELVs and increase the recovery and recycling of ELVs that do arise. Since its implementation,
manufacturers play an enhanced role in the recycling of their vehicles. Ecological compliance is
imperative as disposal of wastes will be borne by the car-maker.
This has spurred a greater sense of conscientiousness at the drawing table to use eco-friendly
and recyclable materials. Use of heavy metals has been banned by the law, such as lead, mercury,
cadmium and hexavalent chromium which is detrimental to health. Vehicles manufactured after
2005 must be a minimum of 95% recyclable20
. A recycling collection network has been formed
throughout the EU to ensure all cars are properly recycled, improper handling can lead to
contamination; ‘one litre of waste oil is sufficient to contaminate one million litres of water and oil
poured onto the ground will affect soil fertility’20
. The introduction of this bill leads to the
accelerated sale of Rover; BMW had to pay €400 million21
for ELV and scrappage costs for Rover.
Emission standards play an important role in influencing the deceleration of global warming.
Stringent standards ensure that pollution is under control as well as setting challenges and
expectations for manufacturers to comply. Currently, in Europe the standard in place is Euro 4 since
Jan 2005, and is upgraded every 4-5 year; which signals for better quality control and research as
each year progresses.
Pollutant
18
PM
(mg/km)
18
NOx
(mg/km)
18
HC
(mg/km)
18
CO
(mg/km)
18
Emission
Standard
/
Engine
Diesel
Petrol
Diesel
Petrol
Diesel
Petrol
Diesel
Petrol
Euro
2
(1996)
100
-‐
-‐
-‐
-‐
-‐
1000
2200
Euro
3
(2000)
50
-‐
500
150
-‐
200
640
2300
Euro
4
(2005)
25
-‐
250
80
-‐
100
500
1000
Euro
5
(2009)
5
5
180
70
-‐
100
500
1000
Euro
6
(2014)
5
5
80
70
-‐
100
500
1000
20
http://www.wasteonline.org.uk/resources/InformationSheets/vehicle.htm
21
BMW Group, Global Insight Report, April 2008
Table
1:
Euro
Emission
Standards,
source
:
EC
Environment
10. BMAN
31000
5832846
-‐10-‐
These standards set the limit (g/km) of Carbon Monoxide, Hydrocarbon, Nitrogen Oxides
and Particulate Matter that can be emitted into the environment. These gases cause global warming
and are a health hazard, causing respiratory problems and cancer.
Approval of the launch of a car is subject to meeting these emission standards. The
challenge car manufacturers have to face is complex. Euro 5 will enter into force in 2009; the limit
on Particulate Matter (PM) for diesel engines will decrease by 80%22
. This is particularly difficult to
achieve, whilst the EC has been more relaxed on NOx emissions in Euro 5, a reduction of 28%; it is
to further decrease by 50% in the Euro 6 emission standards.
Another aspect closely related to sustainability is the Euro New Car Assessment Programme
(NCAP); assessing car safety in a collision. Lives are at stake everyday in road crashes and a slight
alteration in safety standards will spare undesirable grievance.
Founded in 1997, by the UK Department of Transport, the Euro NCAP publishes safety
reports on new cars, and awards 'star ratings' based on the performance of the vehicles in a variety
of crash tests, including front, side and pole impact, and pedestrian impact. This gives buyers better
information regarding their safety and protection in the event of a mishap. The safety of cars has
increased 5-fold17
in the past decade with credence to the establishment of the body. For example,
in 1997 the Rover 100 scored one star out of five for occupant crash safety causing production to
phase out eventually due to public reaction23
. Public awareness is more pronounced and currently
crash safety is a vital factor in the purchase of a motor-vehicle.
5.3 Excise Based Regulation
The congestion charge (CC) is another tool directly associated with sustainable regulation.
Its main aim is directed at traffic jams in vast metropolitan areas around the world to curb traffic
congestion in peak hours. Pioneered by Singapore in 1975, followed by London in 2003; New York
22
http://www.euractiv.com/en/transport/euro-5-emissions-standards-cars/article-133325
23
http://www.racfoundation.org/index.php?option=com_content&task=view&id=327&Itemid=0
11. BMAN
31000
5832846
-‐11-‐
is about to follow suit, with proposals being approved in 200824
. Its positives impacts on the
environment have been documented by Transport for London (TfL)25
; refer to the table below.
London
Congestion
Charge
Charging
Zone
18
Inner
Ring
Road
18
Change
(%)
18
N2O
PM
CO2
N2O
PM
CO2
Overall
traffic
emission
change
2003
vs.
2002
-‐13.4
-‐15.5
-‐16.4
-‐6.9
-‐6.8
-‐5.4
Overall
traffic
emission
change
2004
vs.
2003
-‐5.2
-‐6.9
-‐0.9
-‐5.6
-‐6.3
-‐0.8
Changes
due
to
improved
vehicle
technology
-‐17.3
-‐23.8
-‐3.4
-‐17.5
-‐20.9
-‐2.4
The TfL report makes it apparent that a one-off reduction of emissions could be expected
from the introduction of the charge, whilst further reductions are unlikely26
. However, the current
price of £8 is about to change in October 200827
, favouring cars emitting below 120 gCO2/km, which
are exempted from the congestion charge. Larger cars (above 3000cc) and cars emitting 225
gCO2/km will be charged £2520
a day. Economically, if the price increases, emissions will further
reduce as £25/day is too exorbitant and a preference towards environmentally friendly cars will alter
the automotive market.
In Europe, annual excise duty is payable for motor vehicles owned. Currently in the UK,
vehicle owners have to pay Vehicle Excise Duty (VED) based on the Carbon Emissions of their
vehicle, with an exemption for vehicles registered before March 2001. Vehicles before this date
were charged on a two tier rate
based on the engine capacity
(1549cc). It is obvious that the
government has placed an
emphasis on emissions, after the
ill-effects of greenhouse gases
24
http://www.nytimes.com/2008/04/01/nyregion/01congestion.html?_r=1&ref=nyregion&oref=slogin
25
Impacts of Motoring – Fourth Annual Report, Transport of London, June 2006
26
Impacts of Motoring – Fifth Annual Report, Transport of London, June 2007
27
http://www.tfl.gov.uk/roadusers/congestioncharging/7394.aspx
28
http://direct.gov.uk/en/Motoring/OwningAVehicle/HowToTaxYourVehicle/DG_4022118
VED
band
28
(2008/9)
CO2
(g/km)
Alternative
Fuel
Cars
Petrol
Fuel
Cars
Diesel
Fuel
Cars
A
100
and
below
£0
£0
£0
B
101
-‐
120
£15
£35
£35
C
121
-‐
150
£100
£120
£120
D
151
-‐
165
£125
£145
£145
E
166
-‐
185
£150
£170
£170
F
186
-‐
225
£195
£210
£210
G
226
and
above
£385
£400
£400
Table
3:
Vehicle
Excise
Duty,
Source
:
Directgov,
Motoring
Table
2:
Change
in
emissions
after
implementing
CC,
Source:
TfL
12. BMAN
31000
5832846
-‐12-‐
have been illustrated clearly at the turn of the millennium. Based on the table above, it is clear that
the higher the CO2 emissions the more the driver will be penalized for polluting the environment. A
vehicle that emits 226 g/km is charged 3.3 times more than a car that emits 130 g/km.
This duty is not only charged by the UK only, but is widespread in almost all countries. It
originates from an economic principle. Usually, premium cars and sports cars emit more CO2 g/km.
Hence, the government takes advantage of this to tax the richer population and at the same time,
sending a message to the public not to buy a car which speeds up global warming.
It is evident how regulation wants to shape the industry, the main aim of the above
mentioned rulings point towards lower carbon emissions and greater fuel efficiency in vehicles.
Consumer tax also inhibits demand for larger vehicles and sports cars which drink more fuel.
6.0 Sustainable Manufacturing
6.1 Introduction
About 1.5 tonnes (3.7%) of CO2 is emitted during production of a vehicle while 39 tonnes
(96.3%) is released during the entire life time (~ 150000 km) of the vehicle29
. Therefore, the
technology that runs the car is of primary importance for environmental sustainability.
This does not rule out the production phase of the car, with tens of millions produced each
year and collectively having a significant effect. Emission reduction and energy conservation in the
supply chain and production phase prevents environmental damage. These are exemplified by VW
and BMW where all plants have an ISO 14001 certification, a recognised standard for effective
minimisation of negative environmental impact with regard to water and energy use, emissions and
waste associated with the production process.
The emergence of greater technological advances shall not be ignored. At present the diesel
engine is gaining unprecedented recognition. It is more efficient than the petrol engine in terms of
fuel consumption. Diesel engines once unable to meet emission requirements in the United States
29
Sustainable Automotive Transport, p. 141
13. BMAN
31000
5832846
-‐13-‐
CO2
Emissions
(tonnes/unit)
0
0.2
0.4
0.6
0.8
1
1.2
1.4
2004 2005 2006
BMW
VW
Total
Freshwater
consumption
(m3
/unit)
0
1
2
3
4
5
6
7
2004 2005 2006
BMW
VW
are making a comeback. Car manufacturers have developed filtering technology that now meet
stringent requirements in the United States.
6.2 Emission Figures
Environmental audits determine the
ecological impact of a company based on decisions
made by the management. Figures have been
extracted from VW and BMW sustainability reports
to compare and contrast the effects of producing
one vehicle towards the environment.
6.2.1 CO2 Emissions (tonnes/unit)
CO2 emissions from both BMW and VW are
below the average of 1.5 tonnes/unit23
. However,
BMW’s emissions have been consistently below 1.0
tonne/unit, while VW has been struggling to bring
its levels down to below 1.0 tonne/unit.
6.2.2 Energy Consumption (MWH/unit)
Again, BMW has been very consistent in
maintaining its levels of energy usage between 2.95
and 2.9 MWH/unit. VW had higher usage in 2004
and 2005, but in 2006 brought its levels down from
3.1 to 2.9 MWH//unit which is a commendable
achievement.
6.2.3 Total Freshwater Consumption and Total
Wastewater (m3
/unit)
BMW again has an unvarying performance,
Energy
Consumption
(MWH/unit)
2.75
2.8
2.85
2.9
2.95
3
3.05
3.1
3.15
2004 2005 2006
BMW
VW
Total
wastewater
(m3
/unit)
0
0.5
1
1.5
2
2.5
3
3.5
4
4.5
5
2004 2005 2006
BMW
VW
Figure
3:
CO2
emissions;
BMW
&
VW**
Figure
4:
Energy
Consumption;
BMW
&
VW**
Figure
5:
Total
Freshwater
Consumption;
BMW
&
VW**
Figure
6:
Total
wastewater;
BMW
&
VW**
14. BMAN
31000
5832846
-‐14-‐
remaining more or less the same over the past 3 years. However, VW has appallingly high levels of
freshwater consumption and wastewater generation. It is half as efficient as BMW in conserving
freshwater and 5 times less efficient in reducing waste water.
6.2.4 Investment in Environmental Protection
(euro/unit)
In 2004, BMW devoted 2.5 times more
capital in environmental protection compared to
VW. However, in 2005 and 2006, both the
companies’ expenditure is equivalent.
6.2.5 Summary
Generally BMW has managed its resources well, but there is still room for improvement.
VW has to invest heavily in fresh water and waste water management, as clean water is becoming
difficult to come by in third world countries, it should be managed carefully.
6.3 Current Drive-train Innovation
BMW has a strategy tailored specifically for the environment; Efficient Dynamics -
designed to improve fuel economy without compromising agility and performance. As of autumn
2007, 40% (21 models) of BMW fleet have met the voluntary target of 140gCO2/km30
. Achieving
this has been painstaking as it is directly conflicting with BMW’s core strategy; to deliver products
with a dynamic driving experience with high performance engines.
30
BMW Sustainable Value Report 2007/8 p. 27
Investment
in
env
protection
(euro/unit)
0
5
10
15
20
25
30
2004 2005 2006
BMW
VW
Figure
7:
Investment
in
Env.
Protection;
BMW
&
VW**
Figure
8:
Roadmap
to
sustainability
mobility,
BMW,
source:
BMW
SVR
2007/8
15. BMAN
31000
5832846
-‐15-‐
The latest innovation coined by BMW is Brake Energy Regeneration, Gear Shift Indicator
and Air Flap Control – for better aerodynamics reducing wind resistance. This is a remarkable
achievement, for cutting corners at the right places BMW is not depending on a hybrid engine yet to
claim its green credentials, unlike Toyota’s Prius. In an experiment by the Sunday Times driving
from London to Geneva, a BMW 520d outperformed the Toyota Prius in terms of fuel economy
each returning 41.9 and 40.1 mpg respectively31
.
The official fuel consumption of the Prius is 65.7 mpg (104gCO2/km), but the Mini Cooper D
can return 72.4 mpg (104gCO2/km). Currently, BMW is leading the way for sustainability in the
industry. Last month, the BMW 118d (62.8 mpg, 119gCO2/km) was awarded 2008 World Green Car
at the New York International Auto Show32
.
VW on the other hand has created a new technology – BlueMotion for diesel engines in
conjunction with Daimler. This application increases the compression ratio to increase power, but at
the same time creating more NOx (Nitrogen Oxides); beyond the legal limit. However, addition of a
substance, Urea converts the harmful NOx back to water and Nitrogen.
Hence, more power is achieved with even less pollution, enhancing efficiency. This has
enabled VW and Daimler to increase diesel passenger share in the US, where strict emission rules
on NOx has prohibited sales of diesel cars before.
The Volkswagen BlueMotion Polo attains 72.4mpg (99gCO2/km) which is a diesel
outperforms the Toyota Prius’ 65.7 mpg (104gCO2/km). This technology will be employed
throughout Volkswagen’s entire fleet and will help to bring down emissions substantially.
The use of bio-diesel reduces emissions too, but will be excluded as its use is quite
controversial, contributing to increased tension in rising food prices around the world, which
threatens political stability due to outbreak of riots in Haiti, Cameroon and Côte d'Ivoire33
.
31
Toyota Prius proved gas guzzler in a race with BMW 520d, Sunday Times, 16 March 2008
32
www.carpages.co.uk, BMW wins World Green Car 2008
Figure
9:
NOx
chemical
equilibrium,
source:
VW
SR
2007/8
16. BMAN
31000
5832846
-‐16-‐
6.4 Medium Term – In the Pipeline
6.4.1 New Vehicles
33
Next year, BMW will be introducing hybrid vehicles to their fleet, further improving fuel
consumption. They are working with Mercedes for hybrid solutions for their 7-series and with
Daimler and GM to develop a hybrid solution for other models34
. The Turbo-Steamer is being
developed; using heat from the engine during fuel combustion, a prototype has been proven to cut
fuel consumption by up to 15%35
.
BMW also plans to enter the microcar market where rival
Mercedes has dominated with their Smart brand. Their small
Smart fortwo and forfour have been very popular in mega-cities
where parking is limited. BMW believes the trend in congested
cities such as London moving towards a new era. Overcrowding
in large cities is problematic and charges are increasing exponentially, drivers are left with no
choice but to choose electric cars which are exempt or possibly rewarded with a discount.
As BMW may revive their Isseta brand, known as the bubble car in the 1960s under the
codename of Project I36
. This electric zero-emissions car running on rechargeable batteries and
could be available by 2012. The model will help BMW bring its average emissions down to the
proposed 120 g/km target as proposed by the EC in 2012.
VW is not missing out, in the pipeline it is planning to launch a new model named the Up!,
claimed as the new real “Beetle” to rival chic new eco-friendly new
cars such as the Fiat 500. A budget version will be launched at
£5,00037
and production will start in early 2010. VW is aiming for CO2
emissions of less than 100g/km and a combined fuel economy of
33
The new face of hunger, The Economist, Apr 17 2008
34
BMW to map out long-term future, BBC News, Sep 26 2007
35
BMW Sustainable Value Report 2007/8 p. 27
36
BMW drives for the electric car, Sunday Times, March 23 2008
37
http://www.topgear.com/content/news/stories/2209/
Figure
10:
BMW
Isseta
Prototype,
source:
Auto
Express
Figure
11:
Volkswagen
Up!,
source:
Auto
Express
17. BMAN
31000
5832846
-‐17-‐
94mpg38
; targeted not only in the European market, but also the emerging countries such as Brazil,
Russia, China and India (BRIC). It is set to succeed with winning looks, excellent mileage and
innovative use of space which can sit 4 adults comfortably.
6.4.2 Passive modification
Putting technological advances and innovation aside, how the driver behaves is completely
independent on how the car is engineered and designed. The behaviour of the driver is also one of
the factors that cause unnecessary fuel consumption, e.g. unnecessary acceleration and braking
causes the engine wear and tear and increased fuel consumption. It has been shown that through and
optimised driving style, fuel consumption can be reduced by 20%39
. BMW supports their drivers by
pointing out to them the ideal shift point in gear-changing31
. On top of that, a special driving course
will be provided so customers can learn a particularly economic driving style.
Improvement in traffic infrastructure and traffic management should not be overlooked as
the reduction of traffic jams will decrease emissions as a whole. BMW believes in this, shown by
setting up its own plant transportation system. 21,80040
employees in Germany are transported to
work in a day, the advantages are, lower impact on the environment and decreased traffic. In total,
50% of 80,000 employees in Germany come to work using public transport or the plant bus.
In 1995, the Inzell Initiative41
was established by BMW and Munich. Following the
successful execution of a parking space administration system, present concepts are focused on
promoting public transport with Park and Ride programmes. Since 2005, they have been involved
in a project that introduces quality assurance for traffic management system, more efficient use of
existing infrastructure and more efficient traffic patterns. These are designed to improve the
region’s quality of life and economic power. Special importance is also placed on the ability to take
solutions developed in Munich and transfer them to other cities.
38
http://www.autoexpress.co.uk/news/autoexpressnews/220260/vw_up.html
39
Sustainable Value Report 2007/8, BMW, p.32
40
Ibid, p. 56
41
Ibid, p. 68 & 69
18. BMAN
31000
5832846
-‐18-‐
The formation of the Institute for Mobility
Research (ifmo) by BMW in 1998 draws knowledge
and know-how from the BMW group as well as that
of well-known experts from the scientific community
to study physical mobility in the broadest sense of the
term. Imfo studies the society, business, politics,
technology and the environment to ensure acceptable mobility with a viable future. In 2005, a study
issued by imfo in cooperation with Deutsche Lufthansa, Deutsche Bahn and MAN; “The Future of
Mobility – Scenarios for 2025” proposed comprehensive scenarios for the transportation of people
and goods by road, rail, air and water. It involved 80 experts from the scientific community,
business and associations.
Current research by the imfo includes connection between growth of business and the
increase in traffic, future developments in the mobility behaviour of private households and a
transportation infrastructure benchmark for Europe34
.
6.5 Long Term – The Future
In the long term, BMW believes in using a Hydrogen combustion engine, as opposed to the
Fuel Cell alternative many other manufacturers are advocating, including Volkswagen. This is
because the fuel cell vehicle produces electricity from hydrogen, similar to the manner in which
batteries work. But the banging of pistons will not be heard, and will sound exceptionally quiet.
BMW believes in providing a dynamic driving experience and if you cannot feel the car
accelerating, driving will never be the same again. BMW believes in preserving this experience.
BMW has produced the world’s first premium sedan with a hydrogen combustion engine,
the BMW Hydrogen 7 for everyday use. Today, there are 100 of these cars which run on both petrol
or hydrogen are on the road in Europe, Asia and America42
.
42
Ibid p. 30
Figure
12:
Members
of
ifmo,
source:
BMW
SVR
07/08
19. BMAN
31000
5832846
-‐19-‐
In 2006, BMW and the petroleum company TOTAL signed an agreement to open three
hydrogen filling stations in Europe by 2007. They will be located in Berlin, Munich and Brussels.
Hydrogen is an answer to global warming; only water is emitted. However, to ensure that it
is 100% emission free, the hydrogen must come from a renewable source, such as solar, wind or
hydro power. But for the time being, the lack of infrastructure is the major barrier that prevents the
public from accessing this fuel.
Fossil fuels are due to run out in the next few decades and with limited supply prices are
likely to increase, making the use of hydrogen inevitable in the near future, as it has the largest
potential to enable sustainable mobility.
BMW has a strong initiative in setting a foundation for the hydrogen economy. They have
co-founded Transport Energy Strategy (TES) initiative which works towards the structural
requirements of a functioning hydrogen economy.
BMW, VW, several other major car manufacturers and fuel companies are members of the
Clean Energy Partnership – Berlin (CEP) which has run a demonstration project since November
2004 aimed to prove the everyday suitability of hydrogen for transportation purposes and is the
largest and most complex demonstration project for future-oriented H2 technology in the world43
.
Diverse methods of hydrogen production are demonstrated and hydrogen technologies for vehicles
are examined to enable mass production. The absolute aim is to demonstrate future-oriented
technologies and indicate the technical and financial prerequisites for the use of alternative fuels in
road transportation. Ultimately, a hydrogen economy will be the future, but the journey will take 20
to 30 years. Meanwhile, focus should be placed on fuel efficiency, as the price of oil is soaring.
7.0 Financial Analysis
7.1 Profitability
43
http://www.cep-berlin.de/index_eng.html
20. BMAN
31000
5832846
-‐20-‐
Net
Margin(%)
-‐8
-‐6
-‐4
-‐2
0
2
4
6
8
1998 1999 2000 2001 2002 2003 2004 2005 2006 2007
BMW
Daimler
VW
7.1.1 Net Revenue
Net revenue of BMW and VW
has been increasing steadily over the
past 10 years. However, the growth
rate of VW is greater than that of
BMW with BMW growing at an
average of €2.4billion per annum and
VW at €4.03 billion per annum.
Daimler’s revenue is rather unstable, due to operations in the United States, in 2007; there is a
sudden dip in revenue44
due to the selling of Chrysler to a private equity firm, Cerberus. The net
revenue shows the size of the firm comparatively, VW clearly operates at a larger scale than BMW.
VW earns about 2-times more than BMW, but the fact remains that BMW produced only 1.5
million vehicles compared to VW’s 6.2 million in 2007.
7.1.2 Net Margin
The net margin is the net profit divided by net revenues. VW has quite a cyclical net margin,
peaking in 2001 and reaching its lowest point at 2004 and peaking again in 2007. Daimler
experiences the same trend
whilst BMW’s net margin is
very stable, remaining more or
less constant over the last 5
years; with an exception of a
negative spike in 1999, due to
the performance of a loss-
44
Daimler sells Chrysler to private equity, Times Online, May 14 2007
Net
revenue
(Euro
billion)
0
20
40
60
80
100
120
140
160
180
1998 1999 2000 2001 2002 2003 2004 2005 2006 2007
BMW
Daimler
VW
Net
revenue
(Euro
billion)
0
20
40
60
80
100
120
140
160
180
1998 1999 2000 2001 2002 2003 2004 2005 2006 2007
BMW
Daimler
VW
Figure
13:
Net
Revenue;
BMW,
VW,
Daimler**
Figure
14:
Net
Margin;
BMW,
VW,
Daimler**
21. BMAN
31000
5832846
-‐21-‐
Return
on
Equity
(%)
-‐60
-‐50
-‐40
-‐30
-‐20
-‐10
0
10
20
30
1998 1999 2000 2001 2002 2003 2004 2005 2006 2007
BMW
VW
Daimler
making subsidiary, Rover which was later sold for £1043
in 2000 and split up. BMW withheld the
Mini and Triumph brands while selling off Land Rover to Ford for £1.8bn45
. BMW has exhibited an
excellent performance over the last 5 years. Since 2001 till 2006, VW has not been able to reach
their operative effectiveness in generating profits. However, it should be noted in 2007, VW and
Daimler are about a 150 basis points away to reaching BMW’s level. The net margin of VW and
Daimler doubled in 2007 from 2006 figures.
7.1.3 Return on Equity (ROE)
The ROE of BMW is quite
impressive. A peak in the ROE can be
observed in 2000, followed by a general
slump, followed by a recovery in 2006.
This could be due to tougher regulation
in the industry in 2000 on the emissions
and waste produced. This coincides with
the EU ELV directive and the signing of
the ACEA agreement around 1999.
BMW’s stability has been exhibited in the past 5 years. It is not volatile, as at Daimler and
not cyclical like VW. There has been a clear 5% distinction between BMW and these companies.
However, again it is obvious that VW
and Daimler are increasing their efficiency to
be on par with BMW, in 2007 VW is about
1% away from BMW’s ROE.
7.1.4 Price/Earnings (P/E) Ratio
BMW’s P/E ratio has been quite
consistent. This means that investor sentiment
45
BMW splits up Rover, Business, BBC News, March 17 2000
Price/Earnings
ratio
0
2
4
6
8
10
12
14
16
2003 2004 2005 2006 2007
BMW
VW
Figure
15:
Return
on
Equity;
BMW,
VW,
Daimler**
Figure
16:
Price/Earning
ratio;
BMW,
VW**
22. BMAN
31000
5832846
-‐22-‐
in BMW is quite neutral. BMW’s P/E ratio has been higher than VW’s up until 2006, in 2007 VW’s
P/E ratio increased sharply, by 2 times from 8 to 16; explained by the investors’ expectation of VW.
In the past 2 years, VW has been attracting investors due to the streamlining of the business. VW
has been very attractive to venture capital firms46
, but fortunately, Porsche increased its stake in
VW to 30.9% in 2007. Porsche has very close ties to VW, if VW were to be taken over; their
production line will be affected as 30%47
of their parts come from VW. This explains the sudden
surge in VW P/E ratio.
7.1.5 Return on Asset (ROA) (%)
BMW has had a high ROA since 2003,
and the figure has been quite stationary.
Whilst, VW in the past 5 years has made great
improvements and in 2007 is catching up with
BMW at 3.5%, just 0.5% apart from a
difference of 2.0% back in 2003.
7.2 Environmental Indicators
7.2.1 Property, Plant and Equipment
These figures show the net figure in
the balance sheets. VW’s PPE in 2003 was 2
times that of BMW, but in 2007 has fallen to
a level below that of BMW. One inference
that can be made is that, VW has been
cutting costs in its plants whilst BMW has been purchasing new equipment. On a profitability scale,
this is excellent as profits can be increased, but environmentally this shows that VW is not investing
in the latest technology for its plants; outlining the inefficiency in water usage earlier48
.
46
Porsche increase stake in VW, International Herald Tribune, Mar 27 2007
47
Porsche denies VW share plan, Initernational Herald Tribune, Mar 10 2008
48
Refer to p. 13
Property,
Plant,
Equipment
(euro
billion)
0
5
10
15
20
25
30
35
2003 2004 2005 2006 2007
BMW
VW
Return
on
Asset
(%)
0
0.5
1
1.5
2
2.5
3
3.5
4
4.5
2003 2004 2005 2006 2007
BMW
VW
Figure
17:
Return
on
Asset;
BMW,
VW**
Figure
18:
Property,
Plant
Equipment;
BMW,
VW**
23. BMAN
31000
5832846
-‐23-‐
R&D/Sales
(%)
0
1
2
3
4
5
6
2005 2006 2007
BMW
VW
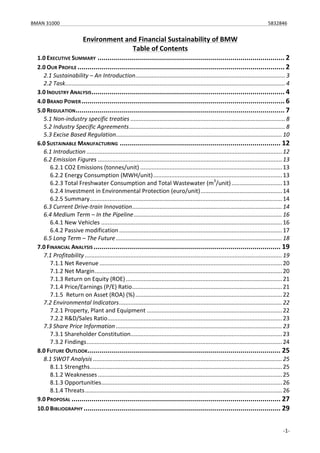
7.2.2 R&D/Sales Ratio
This illustrates how much capital has been invested for the latest innovation in automobile
technology. BMW has invested more than VW in the 3 years consecutively; this shows how
committed BMW is to innovation which
includes the sustainability and environmental
factor too, but given the scale of VW’s
revenues which is about 2 times greater than
BMW, it is not an entirely premium brand;
VW’s investment in R&D is of a credible
standard.
7.3 Share Price Information
7.3.1 Shareholder Constitution
VW
shareholders
31.00%
20%16.90%
32.10%
Porsche
AG
Government
of
Lower
Saxony
Institutional
Shareholders
Private
shareholders
The major shareholder in VW, Porsche has undergone significant endeavour to buy the
shares to protect VW from being taken over by venture capitalists. Porsche has increased its stake
holding from 20% to 31%, this coupled with greater investor confidence and speculation has pushed
VW share price up. VW has undertaken measures to increase its efficiency, as illustrated in PPE
earlier and these improvements can be seen in their profit margins. Before that, the major
shareholder was the State of Lower Saxony which made it politically awkward to lay off workers49
49
Volkswagen looks for higher gear, The Economist, Feb 10 2006
BMW
shareholders
46%
25%
29%
Quandt
Family
Institutional
Shareholders
Private
Shareholders
Figure
19:
R&D
to
Sales;
BMW,
VW**
Figure
20:
VW
shareholders,
source:
Thomson
One
Banker
Figure
21:
BMW
shareholders,
source:
Thomson
One
Banker
24. BMAN
31000
5832846
-‐24-‐
famed for their pampered contracts50
. But now with Porsche having the larger slice of the pie, the
journey to efficiency will be easier.
BMW’s share price has been more
stable and performs in tandem with the
DAX 30 index. This is due to lower
volatility and speculation as their major
shareholder is the Quandt family who sit
on the Board of Directors, ensuring that
the company is run smoothly and steadily,
based on the financial analysis51
.
7.3.2 Findings
It is clear that the current VW share price is overvalued, but it is set to climb even higher as
the power struggle between Porsche and the government of Lower Saxony intensifies. Porsche
intends to increase it’s ownership up to 50% upon getting the green light from anti-trust and
regulatory authorities52
. A ‘hold’ recommendation is suggested for VW with a target of €170 in the
next 12 months. It would be risky to invest in VW for the time being with politics surrounding the
company’s operations; Bernd Osterleh, head of VW works board swore to fight the Porsche
takeover ‘tooth and nail”46
.
BMW is a solid firm that it is almost free from speculation, hence making it an undervalued
stock. About 50% of its shares are held by the Quandt Family and are not traded in the stock
exchange, limiting supply, meaning demand will not increase. The increase in demand causes the
50
Porsche takeover slammed as dangerous superpower fantasy, The Telegraph, Apr 25 2007
51
Refer to p.20
52
Volkswagen, MM Warburg Equity Research Report, p. 5, Mar 25 2008
BMW
VW
Share
price
€35.12
€184.20
Market
Cap
€22.65
bn
€63.65
bn
Beta
0.80
1.04
Figure
22:
VW,
BMW
share
performance
indexed
to
DAX
30;
last
2
years
Table
4:
Current
Share
Price
Data,
source:
Google
Finance
25. BMAN
31000
5832846
-‐25-‐
share price to increase. The proposal for BMW’s stocks is a buy, with an estimated price target of
€49 in the next 12 months53
.
8.0 Future Outlook
8.1 SWOT Analysis54
8.1.1 Strengths
The Inter-brand Cooperation55
rated BMW’s brand no.13 globally and valued at USD
$21.6bn, an appreciation of 10% from 2006. VW was no. 54 and valued at USD $6.5bn and
appreciated by 8% in 2007. The effort BMW has committed into the Efficient Dynamics
programme has become one of its strengths in its R&D capabilities.
8.1.2 Weaknesses
What BMW lacks, VW has and vice versa; in regional sales performance. BMW has a very
weak market share in Germany but sales in US is picking up with their new 4x4 launches, such as
the X3, X5 and X6, but performance at home is not as promising. Also, its smaller scale puts it at a
disadvantage compared to VW; but ensures it remains a premium brand.
53
BMW, MM Warburg Equity Research Report. p.1, Mar 20 2008
54
SWOT Analysis of BMW and VW, Datamonitor, 2007
55
Best Global Brands 2007, Interbrand
BMW
Volkswagen
Strengths
Diversified
operations
Strong
brand
image
Large
network
Research
and
development
capabilities
Leading
regional
player
Strong
brand
portfolio
Global
production
network
Weakness
Lack
of
scale
compared
to
peers
Weak
performance
in
Germany
Weak
Performance
in
the
US
Declining
market
share
in
China
Weaker
margins
Opportunities
Opportunities
in
China
and
India
Increasing
demand
for
hybrid
vehicles
New
models
Increasing
demand
for
hybrid
vehicles
Booming
car
sales
in
China
Threats
Metal
prices
Increasing
competition
from
Japanese
firms
Tightening
emission
standards
Strengthening
Euro,
weakening
Dollar
and
Yen
Raw
material
prices
Economic
slowdown
in
US
and
Europe
ELV
directive
Intense
competition
Table
5:
SWOT
Analysis
of
BMW
&
VW,
source:
Datamonitor
26. BMAN
31000
5832846
-‐26-‐
VW was one of the first car manufacturers to set up plants in China to take advantage of the
fueling economy, but recently are facing more threat from other firms and market share is declining.
VW’s weak margins are becoming stronger thanks to cost cutting measures and more efficient
management created by the For Motion Plus programme which axed 20,000 jobs and introduced
longer working hours56
to increase competitiveness.
8.1.3 Opportunities
It is undeniable that the automotive sector in Western
Europe and the US has reached saturation levels. China and
India’s economy is expected to overtake the West. Ample
potential is available to capitalize on the growth in the Eastern
markets including Brazil and Russia (BRIC) too.
Demand for hybrid vehicles is on the rise with fuel prices recently hitting USD $120 a
barrel57
, drivers are left with no other choice but to go for more fuel efficient cars. BMW and VW
are just starting to roll out hybrid vehicles off their production line after buffing up on fuel economy
by using more advanced diesel engines with cleaner technology.
8.1.4 Threats
Depletion of natural resources and also the
monopolization of the metal industry recently by Mittal
Steel taking over Arcelor and Tata Steel buying over
Corus have led to an increase in prices. This means a
larger portion of the profit margin is eaten away by the
cost of raw materials.
The strength of the Euro has eaten away profits of BMW; BMW has countered this by
increasing production of vehicles outside of Europe. Prospects in Europe and US seem gloomy due
56
VW surges on good numbers, Businessweek, Feb 20 2007
57
Oil prices test record high 120 dollars, AFP, Apr 28 2008
Figure
23:
Future
Car
Ownership
Trend,
source:
Economist
Figure
24:
Steel
Price
Trend,
source:
BMW
AR
2007
27. BMAN
31000
5832846
-‐27-‐
to an expected economic slowdown due to the sub-prime mortgage and credit crunch. Car
registrations in Europe fell by 10% in March, but 8 out of 10 Eastern European countries reported
higher sales. VW reported a drop in sales, but BMW seems to be unaffected reporting higher
quarterly sales of 11%58
.
Increasing fuel prices also increases the costs of polymers which are widely used in the
sector. Transportation is required for distribution of products and is reliant on fuel too. These costs
will not be directly transferable to the customers but this may take place gradually through inflation
which is a lengthy process.
The tightening emission standards will reduce profits as this means a higher proportion of
capital will need to be invested in R&D. The 120 g/km limit has to be reached as a whole by car
manufacturers by 2012 or they will have to be fined by authorities.
The ELV directive also states that vehicles must be 95% recyclable; to meet these
requirements car manufacturers will need to allocate extra resources into research and development.
The EC has also set a ban on certain hazardous chemicals as outlined earlier59
. These prerequisites
set can be seen as a burden to the automotive sector.
9.0 Proposal
After delving deeply into BMW’s and VW’s operations, a proposal has been drafted based
on how sustainability, profitability, the regulatory framework, macroeconomic factors and share
price affect BMW and VW in the future.
58
Car registration drops with fall of confidence, Financial Times, Apr 16 2008
59
Refer to p. 9
Figure
25:
Oil
Price
Trend,
source:
BMW
AR
2007
28. BMAN
31000
5832846
-‐28-‐
BMW has stronger sustainability credentials compared to VW. But VW is trailing quite
closely behind BMW, except for its irresponsible use of water.
Financially, BMW has been a leader in this sector, however VW who has been lagging
behind in the past few years, is making a comeback; as proved by their net margins almost
equivalent to BMW’s in 2007. BMW is aware of this and improvising on their operational
efficiency and profit generation ability was announced in their new strategy, Number One60
. They
aim to sell 1.8 million vehicles in 2012 and increase the return on capital employed to 26% from
22.8% in the 2007 financial year.
The outlook in the Automotive Industry seems quite fragile. Partly due to the substantial
pressure from the EC, both direct and excise based. In the former, manufacturers have to meet
emission targets set and in the latter, consumer behaviour is altered by rulings which incur extra
costs for using fuel inefficiently.
Confidently BMW and VW will overcome this by improving their core competencies in
technology and innovation, through VW’s Bluemotion and the development of BMW’s Efficient
Dynamics strategy.
Renewable hydrogen fuel may be the answer to all our woes, but many teething problems in
production and infrastructure will lengthen the process. A viable economy is predicted in the 20 –
30 years. At the mean time, manufacturers will have to make do with fuel saving technologies and
innovations – such as the hybrid vehicle, more efficient diesel engines and electric micro-cars.
Macroeconomic factors present threats and opportunites for BMW and VW too. The ever
increasing price of petroleum will magnify demand for more fuel efficient vehicles and reward the
car-makers for their effort in innovation. Although prices in raw materials such as steel will take a
significant cut in the profit margins, this can be easily worked round by improving efficiency; or by
hiking sales price by a small percentage (subject to the agreement of other manufacturers to over
come competition).
60
BMW Annual Report 2007
29. BMAN
31000
5832846
-‐29-‐
Changing global economic demographics also show that BMW and VW will have to shift
their production and sale towards the BRIC countries as their voracious appetite for vehicles will
increase further with growing income and better living conditions.
In line with our company profile, sustainability is our primary concern followed by
profitability. BMW is an exceptional candidate for A&O, proven to be sustainable and its focus on
the premium segment ensures profit margins do not diminish. Their competence as a brand lies in
their research and development churning endless innovation and new technology which is essential
for survival in harsher global macroeconomic conditions. Their undervalued share price61
due to
minimal speculation in the market makes it the excellent candidate for our investment as this allows
us to provide future growth and value for our annuity payments in the future.
VW has the potential to excel too, but should be cast away for the time being; due to
excessive speculation leading to an inflated share price. That aside, the internal and external politics
surrounding the company explains that VW is out of bounds for the time being. Its share price is not
expected to increase any time soon57
. As a result, investing in VW will be risky; reconsideration
would be wise after the take over by Porsche and the position the Lower State of Saxony is finalized.
10.0 Bibliography
Books
Kiley, D., Driven: inside BMW, the most admired car company in the world, Wiley, 2004
Ryan, L., Turton, H., Sustainable Automobile Transport, Edward Elgar, 2007
Brandon, R., Auto Mobile, London, 2002
Palepu, K., Healy, P., Bernard, V., Business Analysis & Valuation, South-Western, 2000
Froud J., Financialisation and Strategy, Routledge, London, 2006
Thoms D., Holden L., Claydon T., The Motor Car and Popular Culture in the 20th
Century, Ashgate, 1998
Websites
BBC News - http://news.bbc.co.uk
Auto Blog Green - http://www.autobloggreen.com
SMMT UK - http://www.smmt.co.uk
European Automobile Manufacturers’ Association - http://www.acea.be
Reuters - http://www.reuters.com
Oragnisation of Motor Vehicle Manfacturers - http://www.oica.net
Kyoto Protocol - http://www.kyotoprotocol.com
61
refer to p. 24
30. BMAN
31000
5832846
-‐30-‐
European Commission, Environment - http://ec.europa.eu/environment
Waste Online - http://www.wasteonline.org.uk
Global Insight - http://www.globalinsight.com
EU Information - http://www.euractiv.com
RAC Foundation - http://www.racfoundation.org
The New York Times - http://www.nytimes.com
Transport for London - http://www.tfl.gov.uk
UK Motoring Research - http://www.carpages.co.uk
Top Gear - http://www.topgear.com
Auto Express - http://www.autoexpress.co.uk/
Clean Energy Partnership - http://www.cep-berlin.de/
Interbrand Corporation - http://www.interbrand.com
German Association of the Automotive Industry – http://www.vda.de/index_en.html
*all websites in the references were last accessed on Apr 28 2008.
Journals
The Economist – http://www.economist.com
Capital
Businessweek – http://www.businessweek.com
Financial Times – http://www.ft.com/home/uk
Forbes – http://www.forbes.com/global
Reports
BMW Annual Report (BMW AR), 1998 – 2007
Volkswagen Annual Report (VW AR), 1998 – 2007
Daimler Annual Report, 1998 - 2007
BMW Sustainable Value Report (BMW SVR) 2007/8
Volkswagen Sustainability Report (VW SR) 2007/8
Human Development Report, United Nations, 2005
Report of the World Commission on Environment and Development, United Nations, 1987
Stern Review on the Economics of Climate Change, 2006
VDA Annual Report, 2007
BMW Group, Global Insight Report, April 2008
Impacts of Motoring – Fourth Annual Report, Transport of London, June 2006
Impacts of Motoring – Fifth Annual Report, Transport of London, June 2007
MM Warburg Equity Research Report
Newspapers
The Telegraph
The Times
International Herald Tribune
Databases
Thomson Datastream
Thomson One Banker
Investext Plus
Factiva
Datamonitor
Legend
Figures with ** indicate data which have been adapted and calculated from the Annual Report
of BMW, VW and Daimler respectively.