The document contains summaries of two simulations:
1) A 1-D bar deformation simulation of a tapered bar with fixed and tensile boundary conditions, where ANSYS was used to plot strain distribution and MATLAB plotted strain vs position.
2) A 2-D heat conduction simulation of a rectangular geometry with essential and natural boundary conditions, where ANSYS plotted temperature distribution and MATLAB again plotted temperature distribution with heat generation over the geometry.
1. 1-D Bar Deformation
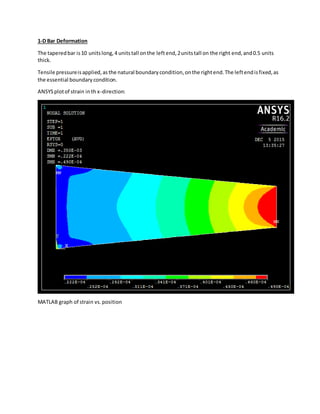
The taperedbar is10 unitslong,4 unitstall onthe leftend,2unitstall on the right end,and0.5 units
thick.
Tensile pressureisapplied,asthe natural boundarycondition,onthe rightend.The leftendisfixed,as
the essential boundarycondition.
ANSYSplotof strain inth x-direction:
MATLAB graph of strain vs.position
2. 2-D Heat Conduction
The rectangulargeometryis1 unitlongin the end2 unitstall.
Essential BoundaryConditionsonthe leftandtopboundaries.Bothare se at a constanttemperature of
300K. The Bottom and rightboundarieshave natural boundaryconditionswithheatfluxesequalto 0
3. and 100 (leavingthe boundary),respectively.There isheatgenerationoverthe entiregeometrysetto
250.
ANSYSVonMisesplotof temperature distribution:
MATLAB plotof temperature distribution: