1. University of Texas at Dallas
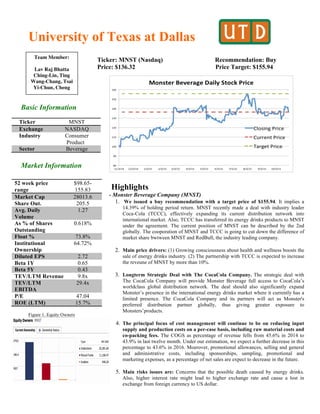
Ticker: MNST (Nasdaq) Recommendation: Buy
Price: $136.32 Price Target: $155.94
Basic Information
Market Information
Figure 1. Equity Owners
Highlights
- Monster Beverage Company (MNST)
1. We issued a buy recommendation with a target price of $155.94. It implies a
14.39% of holding period return. MNST recently made a deal with industry leader
Coca-Cola (TCCC), effectively expanding its current distribution network into
international market. Also, TCCC has transferred its energy drinks products to MNST
under the agreement. The current position of MNST can be described by the 2nd
globally. The cooporation of MNST and TCCC is going to cut down the difference of
market share bwtween MNST and RedBull, the industry leading company.
2. Main price drivers: (1) Growing consciousness about health and wellness boosts the
sale of energy drinks industry. (2) The partnership with TCCC is expected to increase
the reveune of MNST by more than 10%.
3. Longterm Strategic Deal with The CocaCola Company. The strategic deal with
The CocaCola Company will provide Monster Beverage full access to CocaCola’s
worldclass global distribution network. The deal should also significantly expand
Monster’s presence in the international energy drinks market where it currently has a
limited presence. The CocaCola Company and its partners will act as Monster's
preferred distribution partner globally, thus giving greater exposure to
Monsters’products.
4. The principal focus of cost management will continue to be on reducing input
supply and production costs on a per-case basis, including raw material costs and
co-packing fees. The COGS as percentage of revenue fells from 45.6% in 2014 to
43.9% in last twelve month. Under our estimation, we expect a further decrease in this
percentage to 43.6% in 2016. Moerover, promotional allowances, selling and general
and administrative costs, including sponsorships, sampling, promotional and
marketing expenses, as a percentage of net sales are expect to decrease in the future.
5. Main risks issues are: Concerns that the possible death caused by energy drinks.
Also, higher interest rate might lead to higher exchange rate and cause a lost in
exchange from foreign currency to US dollar.
Ticker MNST
Exchange NASDAQ
Industry Consumer
Product
Sector Beverage
52 week price
range
$98.65-
155.83
Market Cap 28013.6
Share Out. 205.5
Avg. Daily
Volume
1.27
As % of Shares
Outstanding
0.618%
Float % 73.8%
Institutional
Ownership
64.72%
Diluted EPS 2.72
Beta 1Y 0.65
Beta 5Y 0.43
TEV/LTM Revenue 9.8x
TEV/LTM
EBITDA
29.4x
P/E 47.04
ROE (LTM) 15.7%
Team Member:
Lav Raj Bhatta
Ching-Lin, Ting
Wang-Chang, Tsai
Yi-Chun, Cheng
2. CFA Institute Research Challenge 2015.10.30
2
Figure 2. Market Share
!
!
Figure 3. Segment sales
!
!
!
!
!
!
!
Business Description
• Company Overview :
Headquartered in Corona, California.Monster Beverage Corporation, through its
subsidiaries, develops, markets, sells, and distributes alternative beverage category
beverages in the United States and internationally. Incorporated in 1990 in Delaware,
Monster Beverage Corporation was previously known as Hansen Natural
Corporation. In 1992, the company acquired Hansen Beverage business.
The company’s Finished Products segment offers finished energy drinks to full
service beverage distributors, retail grocery and specialty chains, wholesalers, club
stores, drug chains, mass merchandisers, convenience chains, health food distributors,
food service customers, and the military. Its Concentrate segment provides
concentrates and/or beverage bases to authorized bottling and canning operations.
The company offers its products primarily under the Monster Energy, Monster
Rehab, Monster Energy Extra Strength Nitrous Technology, Java Monster, Muscle
Monster, Punch Monster, Juice Monster, M3, Übermonster, BU, Gladiator, Nalu,
NOS, Full Throttle, Burn, Mother, Play, Power Play, Relentless, Samurai, BPM, and
Ultra brands.
The company has two operating and reportable segments, namely Direct Store
Delivery (“DSD”), the principal products of which comprise energy drinks, and
Warehouse (“Warehouse”), the principal products of which comprise juice-based and
soda beverages. The DSD segment develops, markets and sells products primarily
through an exclusive distributor network, whereas the Warehouse segment develops,
markets and sells products primarily directly to retailers. Corporate and unallocated
amounts that do not relate to the DSD or Warehouse segments specifically, have
been allocated to “Corporate and Unallocated.” The DSD segment represented
96.1%, 95.6% and 95.4% of our consolidated net sales for the years ended
December 31, 2014, 2013 and 2012, respectively. The Warehouse segment
represented 3.9%, 4.4% and 4.6% of the consolidated net sales for the years ended
December 31, 2014, 2013 and 2012, respectively. (See Figure 3)
• Business Strategy :
1. Manufacture and Distribution
Monster beverages does not directly manufacture their products but instead out
sources the manufacturing process to a third party manufacturer. The company is
generally responsible for arranging for the purchase and delivery to our third party
bottlers and co-packers of the container in which beverage products are packed
2. Raw material and supplier
The principal raw materials used in the manufacturing of the products are aluminum
cans, PET plastic bottles as well as flavors, juice concentrates, sugar, sucralose, milk,
cream, protein, dietary ingredients and other packaging materials, the costs of which
are subject to fluctuations. The purchases beverage flavors, concentrates, juices,
dietary ingredients, cane sugar, sucrose, sucralose and other sweeteners as well as
other ingredients from independent suppliers located in the United States and abroad.
43%$
39%$
10%$
3%$ 3%$
1%$
1%$
Market'Share'
Red$Bull$
Monster$
Rockstar$
Amp$
NOS$
Full$
Thro@le$
Xyience$
Xenergy$
96%$
4%$
Net'Sales'
DSD$ Warehouse$
3. CFA Institute Research Challenge 2015.10.30
3
Figure 4. Sales distributions 3. Marketing
The company uses various sales and marketing strategies like push and pull, product
sampling and enhancing programs, displays space exposure in sales outlet and many
other similar strategies.
Product differentiations are the main focuses of the company under sales and
marketing. The company reviews and changes it’s packing when needed and brings
in new products from time to time. The company decreased expenditures for their
sales and marketing programs by approximately 6.3% in 2014 compared to 2013. As
of December 31, 2014, they employed 1,538 employees in sales and marketing
activities, of which 842 were employed on a full-time basis.
4. Consumer
Monster beverage’s customers are primarily full service beverage distributors, retail
grocery and specialty chains, wholesalers, club stores, drug chains, mass
merchandisers, convenience chains, health food distributors, food service customers
and the military. (See Figure 4)
• SWOT Analysis :
STRENGTHS
! Innovative can design which attract people to buy
! Huge online audience with own Social network (Monster Army1
)
! Loyal customer
! Strong brand identity
! Strong financial position
! Reasonable pricing
WEAKNESSES
! Harmed reputation because of death occasions
! Less mass media advertising
! Not the top-of-mind choice of customers
! Aggressive can design might be intimidating to female consumers
! Monsters marketing audience now is limited by extreme sport fans and
aggressive music
OPPORTUNITIES
! Huge opportunities for entering new markets
! Entering developing markets
! Finding and promoting (not direct and official) appropriate alcohol combination
as Red Bull Vodka
! Finding and promoting (not direct and official) appropriate alcohol combination
as Red Bull Vodka
! McDonald's (NYSE: MCD) is testing to sell Monster Beverage in some stores
THREATS
! Increasing public awareness about harm of energy drinks
! Change of students values to the healthy habits
! Low barriers to entry in the non-alcholic beverage industry (Increasing
competition)
! Possible price wars launching by private labels (ex. Carrefour energy drink)
! Enhancing government’s regulation of energy drink market
! Rival company Red bull already provides regular campus activities
! Red bull sponsorships of major TA partie
62%$
9%$
23%$
4%$ 2%$
2014'Net'Sales'
Full$service$distributors$
Club$stores,$drug$chains$&$mass$
merchandisers$
Outside$the$U.S.$
Retail$grocery,$specialty$chains$and$
wholesalers$
4. CFA Institute Research Challenge 2015.10.30
4
Figure 4. Porter Five Forces
Table 1. Competitors of Energy Drink
Industry Overview and Competitive Positioning
The Energy drinks industry has seen substantial amount of growth for the last decade.
In 2014 sales were $49.9 billion 5% more than 2013 sales. The health conscious soda
drinkers are switching to energy drinks driving energy drinks sales up every year.
Majority of the energy drinks market is held by three countries; United States, Brazil
and China but there is a lot of growth potential for new markets around the world.
Energy drinks is also becoming famous between teenagers, and they are becoming
one of the major consumers. The major Energy drinks businesses are Red bull,
Monster and Rock star. These three companies hold majority of the market share of
energy drinks market. (Figure 1)
Energy drink industry mostly competes on tastes of the product, labeling and
packaging of the product, shelf space and distribution rights of the company. The
companies compete not only for consumer preference, but also for maximum
marketing and sales efforts by multi-brand licensed bottlers, brokers and distributors,
many of which have a principal affiliation with competing companies and brands.
• Porter Five Forces Analysis :
Bargaining Power of Suppliers--Low
! Large number of suppliers: ingredient makers, manufactures of cans, packaging
suppliers…Because they are numerous on this market, suppliers don’t have
power on the energy drinks industry
! High levels of competition among suppliers acts to reduce prices to producers.
Bargaining Power of Buyers--High
! Customers have a high power on the energy drinks market because they can
choose to switch from a product to another one easily, particularly for economical
reasons.
Threat of New Entrants
! Customers are royal to existing brands
! Strong distribution networking (if not, goods are more expensive to move around
and some goods don’t get to the end customer.)
Substitutes--High
! Sports drinks : the sports drinks which offer similar benefits to the consumers at a
lower price.
! Soft drinks
Rivalry--High
! A large numbers of brands on the market. Three brands share the majority of the
market and operate globally (CocaCola Company, PepsiCo, Red Bull). The other
brands operate regionally
Company 2014 Sales
($Million)
Red Bull 2,883
Monster 2,476
Rockstar 647
NOS 294
Amp 212
Full
Throttle
114
Xyuence
Xenergy
40
Arizona
Energy
28
Rip it 22
Venom 19
Bargaining'
Power'of'
Suppliers'
LOW
Bargaining'
Power'of'
Buyers'
HIGH
Threat'of'New'
Entrants'
LOW
Subs?tutes'
HIGH
Rivalry'
HIGH
5. CFA Institute Research Challenge 2015.10.30
5
Table 2. Valuation Weight
Table 3. Comparable Company
Figure 6. 2016E Income Statement
Investment Summary
• Good Entry Point
We issue a BUY recommendation for Monster Beverage Corporation (MNST) with a target
price $155.94 and 14.39% upside from current price level. MMST is expanding not only its
domestic market but also international market. In particular, MNST is expanding its energy
drinks, including through the addition of TCCC’s existing energy product lines in
connection with the TCCC Transaction to provide more alternatives to consumers. The
partnership with TCCC is expected to increase the reveune of MNST by more than 10% ,
and the profit margin will increase 1% next year. Futhermore, Mcdonald is testing to sell
Monster Beverage in some stores recently. If the testing is successful and decide to sell
them in all Mcdonald in U.S., the revenue will be expected to increase about 1.5 billion one
year.
MNST has had strong financial position and high overall cash generation ability for many
years. The positive operating cash from past few years always sufficient its operations.
Based on everything mentioned above, we highly recommend you to buy MNST now!
• Valuation Method
We derived our target price by combining DCF valuation, comparable companies multiple
pricing and forward P/E pricing with different weights. In our opinion, DCF and forward
P/E method is much more suitable to Monster Beverage. For the Comparable Company
Method, the peer group we choose was in the same sector which is Beverage-Soft Drink.
However, in this sector, the other comparable companies mainly focus on carbonated drinks
which is a little bit different from that of Monster because Monster focuses on energy
drinks. Therefore, it may derive a lower multiples than what Moster should be for our
valuation. Base on these reasons, we decided to put more weight on DCF method and
Forward P/E ratio to eliminate some devitiations of our outcome. (See Table 2.)
• Good Market Prospect
The Energy drinks industry has seen substantial amount of growth for the last decade. In
2014 sales were $49.9 billion 5% more than 2013 sales. The health conscious soda drinkers
are switching to energy drinks driving energy drinks sales up every year.
Figure 7. Sales and Margins
Method Weight Stock Price
DCF 0.4 $176.76
Comparable
Company
0.2 $76.36
Forward
P/E
0.4 $174.88
1 $155.94
Company Ticker
Dr Pepper DPS
Pepsico PEP
Coca-cola
Company
KO
Coca-cola
Enterprise
CCE
6. CFA Institute Research Challenge 2015.10.30
6
Table 4. Component of WACC
Figure 8. Captial Structure
Valuation
• Valuation overview
We used three different valuation techniques to evaluate the target stock price of Monster
Beverage Corporation. The techniques include Discounted Cash Flow Model, Comparable
Company multiple pricing method, and Forward P/E valuation model. When valuing the
enterprise value of MNST, we did not use Gordon Growth Method to estimate the Terminal
Value because of the uncertain growth rate in the future. Futhermore, the target price is for
year 2016.Therefore, we avoided adding more assumptions, which might increase volatility
to enterprise value in our model and used only the EBITDA Multiple Method to calculate
Terminal Value.
• Discounted Cash Flow Model
For the Discounted Free Cash Flow model we used a three-year forecast and estimated the
terminal value based on EBITDA Multiple Method. We based our analysis on 0.65 levered
equity beta, 7.14% weighted average cost of capital(WACC), and 29.29x EBITDA Multiple.
The Discounted Cash Flow Model implied the results of $176.76 per share, a 29.52%
higher price than the stock price on November 1th 2015. However, we made many
assumptions when applying DCF model, possibly making the stock price less precise. So,
we assigned 40% weighted to the final target price.
• Weighted Average Cost of Capital (see table 4.)
We estimated weighted average cost of capital to be 7.14% for the following reasons:
1. Cost of equity
The risk premium is 6.63%, which is the trailing 12 month cash yield. We used yield of 30
year US Treasury Bond as our risk free rate, which is 2.86%. Therefore, the CAPM model
gives us the cost of equity of 7.14%
2. Cost of Debt:
Monster does not have any publicly traded bond.
3. Cost of preferred Stock
Monster does not have any preferred stock.
4. Capital Structure (See Figure 8 and Figure 9)
Monster does not have any short term or long debt. The capital is only consist of equity.
The low debt capital structure gives Monster lower debt ratio and debt to equity ratio,
compared to its competitors.
Figure 9. Captial Structure 2
• Comparable Company multiple pricing Model (See Table 5)
In order to evaluate Monster’s performance relative to other companies within the beverage
industry, we conducted a Comparable Company multiple pricing Model. We chose Coca
Cola Enterprise, Coca Cola Bottling, Pepsi Co, and Dr. Pepper Snapple Group as Monster’s
major competitors.
Risk-free Rate 2.86%
Beta 0.65
Market Risk
Premium
6.63%
Cost of Debt 0%
Cost of Equity 7.14%
Equity$
100%$
Debt$
0%$
Capital'Structure'
7. CFA Institute Research Challenge 2015.10.30
7
Table 5. Comparable Company Multiple 2016E
DPS PEP KO CCE
EBITDA
Multiple
12.2x 16.5x 16.5x 10.7x
EBIT
Multiple
14.2x 16.5x 19.4x 14.6x
P/E 20.6x 21.1x 20.4x 18.9x
We averaged out the estimated Price to Earnings ratios, EV/Revenue, EV/EBIT,
EV/EBITDA ratios of these companies, which are calculated by using the stock price as of
November 1th, 2015 divided by the earnings of each company and the enterprise value
divided by revenue, EBIT and EBITDA. Multiplying this industry average by the
forecasted Earnings per Share of 2016, we produced $76.36 respectively. The intrinsic
value we produced by using the Comparable Company multiple pricing Model is lower
than MNST’s current stock price, $136.32. We thought this method is less accurate because
these companies sell not only energy drinks but also non-energy drinks. Therefore, we only
assigned 20% weighted to this method.
• Forward P/E valuation method
We calculated P/E ratios of MNST in 2013, 2014, 2015 and estimated forward P/E ratio
of 2016. Multiplying this estimated number by the forcasted earnings per share of 2016, we
got the forward price of MNST in 2016. The forward price is $174.88 and we assigned 40%
weighted to this method.
• Sensitivity Analysis (see Figure 10)
Under MNST sensitive analysis, which include factors of changing in EBITDA multiple
and WACC, the most sensitive driver is EBITDA multiple. Because the terminal value
accounts for most percentage of the discounted cash flow, the price will be more sensitive
to the change in termunal value
Figure 10. Valuation Sensitivity Analysis
Figure 11. News on Stock Price
8. CFA Institute Research Challenge 2015.10.30
8
Table 6. Du Pont Ratios
Figure 12. ROE
Figure 13. Cash Generating Abilities
Figure 14. EPS Growth
Financial Analysis
1. DuPont Analysis (see table 6 and Figure 12)
In the analysis of historical data, MNST showed a decreased ROE in LTM primarily
because of increase in new stocks (2014 ROE 38.5 and 2015 LTM 15.7). The profit
margin and equity multiplier did not change much during last twelve month. However,
the assets turnover fell by 50%, making the ROE lower than previous year. We estimate
that ROE will increase to 16.31% in 2016 mainly due to higher profit margin. Under the
agreement between MNST and TCCC, MNST can effectively reduce the cost of good
sold by cutting the expense of bottleing and distributing and increase the profit margin.
In summary, profit margin, the key driver of ROE both grow steady in the future.
Therefore, we assert that the net income of MNST will go up especially after the
agreement with TCCC.
2. Constant cash generating abilities (See table 7 and Figure 13)
MNST presented positive CFO in past few years. The possitive operating cash flow
indicates that MNST can always generate sufficient cash flow to maintain its operations.
In addition, both cash conversion circle in 2015 YTM and 2016 are lower than that in
2014. The trend illustrates that MNST takes shorter time to convert its raw material into
cash flows. Compared to cash flow conversion circle in 2015 YTM, the cash flow
conversion circle in 2016 is a little higher mainly because of lower days payable
outstanding. However, both days sales of inventory and days sales outstanding in 2016
are expected to be lower than previous year. Lower days of inventory and days sales
outstanding implies that the management team of MNST is managing its inventory
more efficiently and collecting its receiables faster. In our point, we consider these as
possitive signal though the cash conversion circle is slightly higher in 2016.
Table 7. cash generating abilities
2014 2015 YTM 2016E
Days sales of inventory 64.2 63.1 60.4
Days sales outstanding 42.7 55 39.39
Days payable outstanding 41.8 58.3 37.67
Cash conversion circle 65.1 59.8 62.12
3. Sustainable earnings (See Figure 14)
Monster Beverage’s performance is supported by the growing demand for energy drinks.
According to Beverage Marketing Corporation, US energy drinks volumes grew 6.4%
in 2014 while carbonated soft drink (or CSD) volumes declined by 1%. On the other
hand, MNST is expanding its current productline in recent years. Cusumers have more
options when buying MNST’s energy drinks. The earning per share grew more than
80% during last 5 years (1.54 per share in 2011and 2.87 per share in 2015). In our
estimation, the EPS is going to be higher than $3 per share in 2016.
4. Structure of financing : High potential for debt financing
MNST was financing its resources entirely with equity (insignificant revolving loans
were incurred). In our opinion, the incurrence of debt would favourably influence the
overall MNST’s cost of capital and profitability ratios, especially taking into account
sound financial position as well as cash generation ability. Since MNST did not take
any debt and high profitability, the cost of debt is expected to be low.
2014 2015
YTM
2016E
ROE 38.5% 15.72% 16.31
%
Profit
Margin
19.6% 18.75% 20.56
%
Assets
Turnover
1.5 0.7 0.7
Equity
Multiplier
1.31 1.2 1.13
9. CFA Institute Research Challenge 2015.10.30
9
Figure 15. 5 Years US Dollor Index
Investment Risk
Operating risk: Controversy Concerning Energy Drinks
Monster Beverage energy drinks contain 160 milligrams of caffeine in a 16ounce can.
There has been a lot of speculation on whether its energy drinks are safe for consumption
especially by children and adolescents. Any undesirable changes in regulations will impact
the company’s operations. The company is also incurring higher professional services costs
related to regulatory and litigation issues, which is hurting its earnings. The company
continues to claim that its leading energy drinks contain half the amount of caffeine
compared to coffee and hence Monster drinks are safe for consumption.
Operating risk: Fluctuation of exchange rates
MNST is exposed to foreign currency exchange rate risk with respect to its sales, expenses,
profits, assets and liabilities denominated in currencies other than the U.S. dollar. It has
entered some forward currency exchange contracts with financial institutions to create an
economic hedge to specifically manage a portion of the foreign exchange risk exposure
associated with certain consolidated subsidiaries’ non-functional currency denominated
assets and liabilities. (See Figure 15)
Operating risk:Concentration of Risk
Certain of the Company’s products utilize components (raw materials and/or copacking
services) from a limited number of sources. A disruption in the supply of such components
could significantly affect the Company’s revenues from those products, as alternative
sources of such components may not be available at commercially reasonable rates or
within a reasonably short time period. The Company continues to take steps on an ongoing
basis to secure the availability of alternative sources for such components and minimize the
risk of any disruption in production.
Economic risk: change in consumer preferance
The beverage industry is subject to changing consumer preferences and shifts in consumer
preferences may adversely affect us. There is increasing awareness of and concern for the
health consequences of obesity. This may reduce demand for our non-diet beverages, which
could reduce our revenues and adversely affect our results of operations. Recently,
concerns have emerged regarding diet sodas and in particular, aspartame, which accounts
only a small part of product line in MNST beverages.
Operating risk: Termination of distribution contract
Over 60% of MNST’s sales have dependend on third-party entities’—like Anheuser-Busch,
Inc. (BUD) and The Coca-Cola Company(KO)—affiliated bottlers to distribute its products.
Any adverse changes in the relationship with key distributors could have a major impact on
the company’s business.
Policy risk: FDA restriction
A consumer advocacy group asked the U.S. Food and Drug Administration to add a safety
warning on energy drinks because the caffeine-charged beverages have been linked to 17
deaths since 2012. Currently, the FDA hasn’t imposed any restrictions on the caffeine limit
in energy drinks. The regulatory authority is under pressure from health experts and
organizations—like the CSPI (Center for Science in the Public Interest)—due to energy
drinks’ increased scrutiny. Health experts want to keep children from consuming energy
drinks. Stricter regulations could have a negative impact on the company’s sales. For
instance, in November 2014, Lithuania banned the sale of energy drinks to individuals
under 18. It’s the first country to put age restrictions on energy drinks. Monster Beverage
adjusted the caffeine levels in its products sold in Canada. In 2013, there was a regulation
that limits the amount of caffeine in any beverage in a single-serving can or bottle to less
than 180 milligrams.
10. CFA Institute Research Challenge 2015.10.30
10
Management and Governance
• Senior Management
If company are not able to retain the full-time services of senior management there may be an adverse effect on their
operations and/or their operating performance until they find suitable replacements.
Monster’s business is dependent, to a large extent, upon the services of our senior management. Monster does not maintain
key person life insurance on any members of their senior management. The loss of services of either Mr. Sacks, Chairman and
Chief Executive Officer, Mr. Schlosberg, President and Chief Financial Officer, or any other key members of their senior
management could adversely affect their business until suitable replacements can be found. There may be a limited number of
personnel with the requisite skills to serve in these positions and they may be unable to locate or employ such qualified
personnel on acceptable terms.
• Policy and Compensation Discussion
1. Non-Employee Director Stock Ownership Policy:
The Board has adopted stock ownership guidelines regarding stock ownership by non-employee Board members. As amended,
these guidelines provide that each non-employee director of the Company be required to hold at all times a minimum of 3,000
shares of Common Stock. During 2014, all non-employee directors held at least the minimum shares of Common Stock at all
times.
2. Director Resignation Policy :
The Board has a director resignation policy. This policy provides that, in an uncontested election, any incumbent director
nominee who receives a greater number of votes “WITHHELD” from his or her election than votes “FOR” his or her election
must promptly tender his or her resignation to the Board following certification of the election results. The Nominating
Committee will review the circumstances surrounding the election and recommend to the Board whether to accept or reject the
resignation. The Board must act on the tendered resignation. If such resignation is rejected, the Board must publicly disclose its
decision, together with the rationale supporting its decision, within 90 days after certification of the election results
3. Compensation Program Component:
! Base Salary
! Annual Cash Bonus Opportunity
! Long-Term Incentive Program
! Other Compemsation
! Employee Benefit Plans
• Governance
Composition of the company’s board of directors: Sufficiently independent!
! Chairman: Technically the leader of the corporation, the board chairman is responsible for running the board smoothly and
effectively. His or her duties typically include maintaining strong communication with the chief executive officer and high-
level executives, formulating the company's business strategy, representing management and the board to the general public
and shareholders, and maintaining corporate integrity. A chairman is elected from the board of directors.
! Inside directors: These directors are responsible for approving high-level budgets prepared by upper management,
implementing and monitoring business strategy, and approving core corporate initiatives and projects. Inside directors are
either shareholders or high-level managers from within the company. Inside directors help provide internal perspectives
for other board members. These individuals are also referred to as executive directors if they are part of company's
management team. (There are 4 inside directors in Monster’s board)
$
! Outside directors: They have the same responsibilities as the inside directors in determining strategic direction and
corporate policy, outside directors are different in that they are not directly part of the management team. The purpose of
having outside directors is to provide unbiased and impartial perspectives on issues brought to the board. (There are 7
outside directors in Monster’s board)
! The number of insiders are less than outsiders. So it is much more possible to provide unbiased and impartial perspectives
on issues.
11. CFA Institute Research Challenge 2015.10.30
11
Team disclosure:
We assign a BUY rating when a security is expected to deliver returns of 10% or greater over the next twelve months. A SELL
rating is given when the security is expected to deliver negative returns over the next twelve months, while a HOLD rating implies
flat returns over the next twelve months.
Appendix
Revenue
Net Sales 2,060,702.0 2,246,428.0 2,464,867.0 2,751,284.5 3,195,341.9 3,541,397.4
% Growth 9.0% 9.7% 11.62% 16.14% 10.83%
Cost of goods sold
Cost of goods sold 995,046.0 1,073,497.0 1,125,057.0 1,228,275.8 1,394,566.1 1,510,183.6
COGS as a % of revenue 48.3% 47.8% 45.6% 44.6% 43.6% 42.6%
Gross profit 1,065,656.0 1,172,931.0 1,339,810.0 1,523,008.8 1,800,775.8 2,031,213.8
Gross profit margin (%) 51.7% 52.2% 54.4% 55.4% 56.4% 57.4%
Operating expenses
Selling, general and administrative 494,471.0 577,253.0 566,654.0 884,722.9 774,135.3 857,974.2
SG&A as a % of revenue 24.0% 25.7% 23.0% 32.2% 24.2% 24.2%
EBITDA 571,185.0 595,678.0 773,156.0 638,285.9 1,026,640.5 1,173,239.6
EBITDA margin (%) 27.7% 26.5% 31.4% 23.2% 32.1% 33.1%
Depreciation and amortization 20,562.0 22,762.0 25,651.0 17,800.4 19,383.1 19,008.7
EBIT 550,623.0 572,916.0 747,505.0 620,485.5 1,007,257.4 1,154,230.9
EBIT margin (%) 26.7% 25.5% 30.3% 22.6% 31.5% 32.6%
Interest
Interest and other (expense) income,
net
(2,256) (11,737) (1,676) (1,790.0) (4,365) (4,892)
(Loss) gain on investments and put
option, net (Note 2)
787 2,715 (41) 0.0 1,153.7 956.9
Net interest expense (1,469.0) (9,022.0) (1,717.0) (1,790.0) (3,211.1) (3,935.0)
EBT 549,154.0 563,894.0 745,788.0 622,275.5 1,010,468.5 1,158,165.9
EBT margin (%) 26.6% 25.1% 30.3% 22.6% 31.6% 32.7%
Income tax expense 209,134.0 225,233.0 262,603.0 217,796.4 353,664.0 405,358.1
Tax rate (%) 38.1% 39.9% 35.2% 35.0% 35.0% 35.0%
Net Income (Adjusted) 340,020.0 338,661.0 483,185.0 404,479.1 656,804.5 752,807.8
Non-recurring events
Discontinued operations 0.0 0.0 0.0 161,470.0 0.0 0.0
Other 0.0 0.0 0.0 0.0 0.0 0.0
Total non-recurring events 0.0 0.0 0.0 161,470.0 0.0 0.0
Net Income (After non-recurring events) 340,020.0 338,661.0 483,185.0 565,949.1 656,804.5 752,807.8
Distributions
Income attributable to non-
controlling interests
0.0 0.0 0.0 0.0 0.0 0.0
Non-controlling interests % of
Net Income
0.0% 0.0% 0.0% 0.0% 0.0% 0.0%
Net Income (as Reported) 340,020.0 338,661.0 483,185.0 565,949.1 656,804.5 752,807.8
Earnings per share (EPS)
Basic 1.96 2.03 2.89 3.26 3.79 4.34
Diluted 1.86 1.95 2.77 3.18 3.69 4.23
Average common shares outstanding
Basic 173,712 166,679 167,257 173,447 173,447 173,447
Diluted 183,083 173,387 174,285 177,998 177,998 177,998
12. CFA Institute Research Challenge 2015.10.30
12
Consolidated
Balance Sheets
Fiscal Year Ended Estimates
(in US$ thousands) Actuals
2016E 2017E
On December 31 2013A 2014A 2015E
Assets
Current
assets:
Cash and cash
equivalents
211,349.0 370,323.0 1,736,396.8 1,567,601.5 1,440,270.9
Short-term
investments
402,247.0 781,134.0 770,684.0 761,495.0 751,924.0
Accounts
receivable, net
291,638.0 280,203.0 319,144.5 370,654.4 410,796.2
TCCC
Transaction
receivable
0.0 0.0 0.0 0.0 0.0
Distributor
receivables
4,542.0 552.0 2,843.0 3,301.8 3,659.4
Inventories 221,449.0 174,573.0 216,177.6 245,444.8 265,793.6
Prepaid
expenses and
other current
assets
21,376.0 19,673.0 32,045.1 28,039.6 31,076.3
Intagibles
held-for-sale
0.0 18,079.0 18,079.0 18,079.0 18,079.0
Prepaid
income taxes
9,518.0 8,617.0 7,888.7 12,809.9 14,682.3
Deferred
income taxes
20,924.0 40,275.0 42,938.8 48,033.6 50,672.7
Total current
assets
1,183,043.
0
1,693,429.
0
3,146,197.5 3,055,459.6 2,986,954.4
Investments 9,792.0 42,940.0 830,181.0 1,332,889.0 1,902,974.3
Property and
equipment,
net
88,143.0 90,156.0 102,366.8 115,184.4 134,061.0
Deferred
income taxes
63,611.0 54,106.0 54,106.0 54,106.0 54,106.0
Goodwill 0.0 0.0 0.0 0.0 0.0
Intangibles,
net
65,774.0 50,748.0 56,897.0 63,808.7 69,299.2
Other assets 10,146.0 7,496.0 8,582.0 9,987.3 10,407.8
Total assets 1,420,509.
0
1,938,875.
0
4,198,330.3 4,631,435.0 5,157,802.7
Liabilities
Current
liabilities:
Accounts
payable
119,376.0 127,641.0 134,839.8 153,095.1 165,787.6
Accrued
liabilities
59,113.0 40,271.0 77,584.6 67,886.8 75,239.0
Accrued
promotional
allowances
99,470.0 114,047.0 124,561.9 144,666.2 160,333.6
Accrued
distributor
0.0 0.0 64,621.0 0.0 0.0
13. CFA Institute Research Challenge 2015.10.30
13
terminations
Deferred
revenue
13,832.0 49,926.0 119,352.1 141,534.2 158,820.7
Accrued
compensation
14,864.0 17,983.0 19,138.6 22,227.5 24,634.8
Income taxes
payable
9,359.0 5,848.0 (796.6) 6,276.6 8,967.8
Total current
liabilities
316,014.0 355,716.0 539,301.5 535,686.5 593,783.4
Deferred
revenue
112,216.0 68,009.0 68,009.0 68,009.0 68,009.0
Deferred
Income Taxes
0.0 0.0 0.0 0.0 0.0
Total
liabilities
428,230.0 423,725.0 607,310.5 603,695.5 661,792.4
Shareholders'
equity
Common
stock par
value
1,030.0 1,035.0 1,035.0 1,035.0 1,035.0
Common
stock in
treasury
(1,222,912.
0)
(1,231,087.
0)
(1,651,420.0) (1,816,789.0) (2,014,748.0)
Additional
paid-in
capital
368,069.0 426,145.0 2,153,255.7 2,198,352.2 2,243,400.2
Retained
earnings
1,847,325.
0
2,330,510.
0
2,896,459.1 3,553,263.6 4,306,071.5
Accumulated
other
comprehensiv
e income
(loss)
(1,233.0) (11,453.0) 191,690.0 91,877.7 (39,748.3)
Total
shareholders
' equity
992,279.0 1,515,150.
0
3,591,019.8 4,027,739.5 4,496,010.3
Noncontrolli
ng interest
0.0 0.0 0.0 0.0 0
Total
liabilities &
equity
1,420,509.
0
1,938,875.
0
4,198,330.3 4,631,435.0 5,157,802.7
14. CFA Institute Research Challenge 2015.10.30
14
Consolidated
Statements of
Cash Flows
Fiscal Year Ended
(in US$
thousands)
Actuals LTM Estimates
Period Ending
December 31
2012A 2013A 2014A 2015A 2015E 2016E 2017E
Cash flows
from
operating
activities
Net income 340,020 338,661 483,185 480,348 565,949.1 656,804.5 752,807.8
Depreciation and
amortization
20,562 22,762 25,651 25,905 17,800.4 19,383.1 19,008.7
Loss (gain) on
disposal of property
and equipment
25.0 506.0 (408.0) (331.0) (331) 0.0 0.0
Gain on sale of
Monster Non-
Energy
0.0 0.0 0.0 (161,470) (161,470) 0.0 0.0
Stock-based
compensation
28,413 28,764 28,552 28,300 28,538.7 28,618.2 28,569.6
Loss on put option 1,111 838.0 842.0 745.0 745.0 808.3 798.4
Gain on
investments, net
(1,897) (3,553.0) (801.0) (717) (717) 0.0 0.0
Deferred income
taxes
(2,460) (7,074) (9,846) 146,696.0 (2,663.8) (5,094.8) (2,639.1)
Tax benefit from
exercise of stock
options
(19,656) (30,348) (11,924) (308,952) (308,952) (117,074.7) (145,983.6)
Changes in
operating working
capital
Changes in
accounts
receivable
(17,782) (42,901) (14,290) (9,814.0) (38,941.5) (51,509.9) (40,141.9)
Changes in
distributor
receivables
3.0 (7,382) 4,580.0 3,529.0 (2,291.0) (458.9) (357.6)
Changes in
inventory
(47,568) (21,552) 42,763.0 308.0 (41,604.6) (29,267.2) (20,348.8)
Changes in
prepaid
expenses and
other current
assets
(4,523) (4,501) 888.0 1,755.0 (12,372.1) 4,005.5 (3,036.7)
Changes in
prepaid
income taxes
(33,210) 24,008 157.0 (86,493) 728.3 (4,921.2) (1,872.4)
Changes in
accounts
payable
3,659 (8,204) 11,282.0 47,293 7,198.8 18,255.3 12,692.5
Changes in
accrued
liabilities
6,458.0 2,265.0 3,019.0 (2,028) 37,313.6 (9,697.8) 7,352.1
Changes in
accrued
promotional
allowances
2,723.0 8,932.0 20,530.0 6,792.0 10,514.9 20,104.3 15,667.4
Changes in
accrued
794.0 1,552.0 (2,338.0
)
62,264.0 64,621.0 (64,621.0) 0.0
15. CFA Institute Research Challenge 2015.10.30
15
distributor
terminations
Changes in
accrued
compensation
2,498.0 1,970.0 3,394.0 4,519.0 1,155.6 3,089.0 2,407.2
Changes in
income taxes
payable
14,165.0 34,308.
0
8,438.0 (5,875.0) (6,644.6) 7,073.2 2,691.2
Changes in
deferred
revenue
(5,659.0) 2,982.0 (8,107.0
)
(45,719.0
)
69,426.1 22,182.0 17,286.5
Net changes
in operating
working
capital
(78,442.
0)
(8,523.0
)
70,316.0 (23,469.0
)
89,104.7 (85,766.7) (7,660.4)
Total cash flows
from operating
activities
287,676.
0
342,033
.0
585,567.
0
187,055.0 228,004.0 497,678.0 644,901.6
Cash flows
from investing
activities
Maturities of held-
to-maturity
investments
841,576.
0
256,843
.0
710,294.
0
865,756.0 865,756.0 610,964.3 729,004.8
Sales of available-
for-sale investments
68,451.0 5,793.0 0.0 100.0 100.0 1,964.3 688.1
Sales of trading
investments
17,050.0 2,250.0 13,075.0 10,350.0 10,350.0 8,558.3 10,661.1
Proceeds from
transfer of
distribution rights
to TCCC
0.0 0.0 0.0 179,658.0 179,658.0 0.0 0.0
Purchase of held-to-
maturity
investments
(597,155
.0)
(557,41
9.0)
(1,130,6
01.0)
(1,652,99
7.0)
(1,652,997.0
)
(1,113,672.3
)
(1,299,090.
1)
Purchase of
available-for-sale
investments
(9,502.0) 0.0 (4,001.0
)
(4,001.0) 0.0 (1,333.7) (1,778.2)
Purchases of
property and
equipment(CAPEX)
(42,935.
0)
(40,762.
0)
(27,952.
0)
(28,705.0
)
(30,825.2) (35,800.4) (39,677.5)
Capex as a
% of
Revenue
2.1% 1.8% 1.1% 1.1% 0.0 0.0 0.0
Proceeds from the
sale of Monster
Non-Energy
0.0 0.0 0.0 198,008.0 198,008.0 0.0 0.0
Proceeds from sale
of property and
equipment
288.0 9,022.0 963.0 814.0 814.0 3,599.7 1,792.2
Additions to
intangibles
(6,301.0) (11,175.
0)
(3,411.0
)
(6,149.0) (6,149.0) (6,911.7) (5,490.6)
(Increase) decrease
in other assets
377.0 (4,360.0
)
1,230.0 (1,086.0) (1,086.0) (1,405.3) (420.4)
Total cash from
investing activities
271,849.
0
-
339,808
.0
-
440,403.
0
-
438,252.0
-436,371.2 -534,036.7 -604,310.6
Cash flows
from
financing
activities
Principal payments (2,076.0) (1,887.0 (1,619.0 (1,176.0) (1,176.0) 0.0 0.0
16. CFA Institute Research Challenge 2015.10.30
16
on debt ) )
Excess tax benefit
from stock-based
compensation
19,656.0 30,348.
0
11,924.0 308,952.0 308,952.0 20,642.7 20,642.7
Issuance of
common stock
11,015.0 21,252.
0
17,168.0 1,698,572
.0
1,698,572.0 16,478.3 16,478.3
Purchases of
common stock held
in treasury
(727,670
.0)
(67,599.
0)
(8,175.0
)
(420,333.
0)
(420,333.0) (165,369.0) (197,959.0)
Total cash from
financing activities
(699,075
.0)
(17,886.
0)
19,298.0 1,586,015
.0
1,586,015.0 (128,248.0) (160,838.0)
Effect of
Exchange
Rate on Cash
2,733.0 4,496.0 (5,488.0
)
(11,574.0
)
(11,574.0) (4,188.7) (7,083.6)
Total change
in cash and
cash
equivalents
(136,817
.0)
(11,165.
0)
158,974.
0
1,323,244
.0
1,366,073.8 (168,795.3) (127,330.6)
CASH AND CASH
EQUIVALENTS,
beginning of year
359,331.
0
222,514
.0
211,349.
0
373,051.0 370,323.0 1,736,396.8 1,567,601.5
CASH AND CASH
EQUIVALENTS, end of
year
222,514.
0
211,349
.0
370,323.
0
1,696,295
.0
1,736,396.8 1,567,601.5 1,440,270.9
17. CFA Institute Research Challenge 2015.10.30
17
Operating Working Capital
Schedule (OWC)
(in US$ thousands) Actuals Estimates
On January 31 2013A 2014A 2015E 2016E 2017E
Current assets
Receivables, net 291,638.0 280,203.0 319,144.5 370,654.4 410,796.2
Days
receivable
41.8 41.8 41.8 41.8
Distributor
Receivables
4542.0 552.0 2,843.0 3,301.8 3,659.4
Days
receivable
0.4 0.4 0.4 0.4
Inventories 221,449.0 174,573.0 216,177.6 245,444.8 265,793.6
Inventory
turnover days
63.4 63.4 63.4 63.4
Prepaid expenses
and other
21,376.0 19,673.0 32,045.1 28,039.6 31,076.3
Days prepaid 13.0 13.0 13.0 13.0
Prepaid income
taxes
9518.0 8617.0 7888.7 12809.9 14682.3
Days prepaid 14.5 14.5 14.5 14.5
Total current
assets
534,463.0 474,449.0 567,367.2 644,138.8 707,666.1
Current liabilities
Accounts payable 119,376.0 127,641.0 134,839.8 153,095.1 165,787.6
Days payable 39.5 39.5 39.5 39.5
Accrued liabilities 59,113.0 40,271.0 77,584.6 67,886.8 75,239.0
Days payable 31.6 31.6 31.6 31.6
Accrued
promotional
allowances
99470.0 114047.0 124561.9 144666.2 160333.6
as % of
revenue
0.044 0.046 0.045 0.045 0.045
Accrued distributor
termination
0.0 0.0 64621.0 0.0 0.0
as % of
revenue
0.0 0.03 0.0 0.0
Accrued
compensation
14864.0 17983.0 19138.6 22227.5 24634.8
as % of
revenue
0.007 0.007 0.007 0.007 0.007
Accrued taxes
payble
9,359.0 17,983.0 11,338.4 18,411.6 21,102.8
Days Payable 18.7 18.7 18.7 18.7
Deferred revenue 112216.0 68009.0 137435.1 159617.2 176903.7
as % of
revenue
0.05 0.05 0.05 0.05 0.05
Total current
liabilities
187,848.0 185,895.0 223,762.9 239,393.5 262,129.3
Total operating
working capital
346,615.0 288,554.0 343,604.3 404,745.2 445,536.8
18. CFA Institute Research Challenge 2015.10.30
18
Discounted Cash Flow Analysis
(in US$ thousands) Actuals Estimates
Period Ending January 31 2012A
2013
A 2014A 2015E 2016E 2017E
Unlevered Free Cash Flow
EBIT 620,486 1,007,257 1,154,231
Depreciation & Amortization (331) (108) (331)
Deferred Taxes (2,664) (5,095) (2,639)
Other 28,236 29,427 29,368
Changes in Working Capital 89,105 (85,767) (7,660)
Capital Expenditures (30,825) (35,800) (39,678)
Taxes (217,170) (666,250) (530,591)
Total Unlevered Free Cash Flow 486,835.9 243,663.9 602,700.0
Net Present Value Calulation
Period 0.00 0.2 1.2
Discounted Cash Flow 7.14% 486,835.9 240,326.8 554,839.2
Total Net Present Value 795,166.0 795,166.0
Terminal Value
EBITDA Method
Exit Year EBITDA 1,153,899.9
Multiple 29.3x
Terminal Value 33,798,881.4
Net Present Value 33,798,881.4
Cost of Capital
Risk Free Rate 2.86% Debt YE 2012 0
Market Risk Premium 6.63% Stock Price 136.32
Beta 0.65 Shares Outstanding 205,498
Cost of Equity 7.14% Equity Value 28,013,551.2
Cost of Debt 0.0%
WACC 7.14%
Discounted Cash Flow Total Valuation EBITDA Method
Total of Present Value of Cash Flows 795,166.0
Present Value of Terminal Value 33,798,881.4
Total Enterprise Value 34,594,047.4
Net Debt, Non-controlling interests, preferred securities (1,736,396.8)
Equity Value 36,330,444.2
Share Count (millions) 205,498.5
Estimated Equity Value per Share $176.79