Real Estate Indicators Jan 2017
•
1 like•129 views

A visual look at key indicators in real estate

Recommended
More Related Content
Viewers also liked
Viewers also liked (11)
More from Callan
More from Callan (18)
Recently uploaded
Recently uploaded (20)
Real Estate Indicators Jan 2017
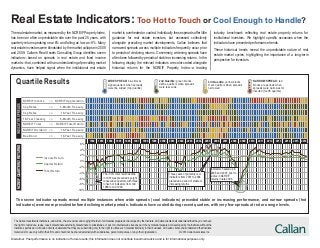
- 1. Quartile Results WIDE SPREAD: blue blocks signal quarters when spreads were the widest (top quartile) NARROW SPREAD: red blocks are periods when spreads were narrowest or inverted (fourth quartile) 2nd Quartile: green blocks define quarters when spreads were less wide 3rd Quartile: yellow blocks mark quarters when spreads narrowed NCREIF Income vs. NCREIF Appreciation Cap Rates vs. 3-Month Treasury Cap Rates vs. 10-Year Treasury 10-Year Treasury vs. 6-Month Treasury NAREIT Total vs. NCREIF Total Return NAREIT Dividend vs. 10-Year Treasury The seven indicator spreads reveal multiple instances when wide spreads (cool indicators) preceded stable or increasing performance, and narrow spreads (hot indicators) were more prevalent before declining market periods. Indicators have cooled during recent quarters, with very few spreads at red or orange levels. INDICATORSPREADS -10% -8% -6% -4% -2% 0% 2% 4% 6% 2013 2014 2015 20161992 1993 1994 1995 1996 1997 1998 1999 2000 2001 2002 2003 2004 2005 2006 2007 2008 2009 2010 2011 2012 Baa Bond vs. 10-Year Treasury NCREIFQUARTERLYRETURNS The -5.3% total return decline in 1991 was preceded by eight consecutive quarters with three to five hot indicators from mid 1988 to mid 1990. Three years of primarily cool indicators from 2001 to 2004 preceded a period of stable or increasing returns. Indicators heated up in 2006 and 2007, prior to a dive in NCREIF returns in late 2008. Income Return Capital Return Total Return The real estate market, as measured by the NCREIF Property Index, has been an often unpredictable ride over the past 25 years, with quarterly returns peaking near 6% and falling as low as -8%. Many real estate investors were blindsided by the market collapse in 2008 and 2009. Callan’s Real Assets Consulting Group identifies seven indicators—based on spreads in real estate and fixed income markets—that, combined with an understanding of prevailing market dynamics, have helped signal when the institutional real estate Real Estate Indicators: Too Hot to Touch or Cool Enough to Handle? market is overheated or cooled. Individually these spreads offer little guidance for real estate investors, but assessed collectively alongside prevailing market developments, Callan believes that narrowed spreads across multiple indicators frequently occur prior to periods of declining returns. Conversely, widening spreads have often been followed by periods of stable or increasing returns. In the following display, the relevant indicators are color coded alongside historical returns for the NCREIF Property Index—a leading industry benchmark reflecting real estate property returns for institutional investors. We highlight specific occasions when the indicators have preceded performance trends. These historical trends reveal the unpredictable nature of real estate market cycles, highlighting the importance of a long-term perspective for investors. Disclaimer: Past performance is no indication of future results; this information does not constitute investment advice and is for informational purposes only. The Callan Investments Institute is, and will be, the sole owner and copyright holder of all material prepared or developed by the Institute. All Callan clients shall understand that they do not have the right to reproduce, revise, resell, disseminate externally, disseminate to subsidiaries, or post on internal web sites any part of any material prepared or developed by the Institute, without the Institute’s permission. All Callan clients understand that they are subscribing only to the right to utilize such material internally in their business. All Callan clients shall understand that Institute material is for use only within their firm, and should not be shared externally with subsidiaries, parent companies, or any other organization. © 2014 Callan Associates Inc.
- 2. NCREIF Income vs. Appreciation: Core real estate investors expect a majority of total return to be earned from real estate income. When this spread narrows, investors earn a larger share of returns from the more speculative appreciation component. Wide spreads historically range from 2% to 10%, and narrow spreads from -2% to 0.5%. Cap Rates vs. 3-Month Treasury: A cap rate is the ratio of annualized net operating income to the value of the property. High cap rates can result from falling property prices or bearish investor expectations about future real estate returns. Real estate investors should expect a yield premium in the form of a positive spread for this indicator. Narrow spreads and low cap rates suggest investors may be assuming risk they may not be compen- sated for. Higher spreads indicate that investors demand higher risk premiums for private real estate investments relative to ultra-safe, short-term Treasuries. Wide spreads historically range from 4% to 7%, and narrow spreads from -8% to -0.5%. Cap Rates vs. 10-Year Treasury: This spread is similar to the comparison of cap rates versus 3-month Treasuries, only it offers insight into the size of the risk premium demanded for private real estate relative to longer-term, Callan Real Estate Leading Indicators: On a quarterly basis, Callan calculates each indicator spread and then assigns it to one of four color-coded quartiles ranging from widest (1st quartile) to narrowest (4th). The quartile rankings are based on data from 1978 to the test quarter to ensure the results are not skewed by future trends. History of Institutional Real Estate Investment 1985 1990 1995 2000 2005 2010 1985: Era of strong returns ends for real estate market. 1995: Real estate markets recover. Era of strong, but low relative returns. 2005: Global REIT strategies gain traction. 2003: Cap rate compression begins. Institutional investment increases. 2007: Residential subprime market meltdown creates credit crunch in commercial markets. 2008/2009: Credit crunch hits real estate. Valuation declines, liquidity constraints and leverage issues ensue. 2001: Flight to quality: (1) investors look for core real estate with good credit tenants and low lease roll over, and (2) yield investors are drawn to REIT market. 1995: Occupancy rates, rental rates and valuations are all on the rise. Public real estate market gains traction. 1995: Real estate investors look to higher risk/return strategies. 1995: Institutional “opportunistic funds” surface. 1993: Modern REIT era begins. 1989: Real estate market begins to hit hard times due to severe overbuilding, recession and scarcity of equity and debt capital. Many plan sponsors divorce themselves from the asset class. 1970: Institutional investors begin to invest in real estate. Together with stocks and bonds, real estate promises to be a stable partner. 1970: Era of strong returns begins for real estate market. The institutional real estate market has developed considerably over the past four decades. This timeline marks historical milestones for institutional investors since 1970. ultra-safe, liquid investments. When this spread narrows, investors may be assuming risk for real estate investments they may not be compensated for. Wide spreads historically range from 2% to 5%, and narrow spreads from -8% to -1%. 10-Year Treasury vs. 6-Month Treasury: This spread represents part of the “yield curve” and many economists suggest that low or inverted spreads can predict the onset of recessionary conditions. Wider spreads reflect accommodative monetary policies but suggest higher interest rates and inflation in the long term. Wide spreads historically range from 2% to 4%, and narrow spreads from -2% to 0.5%. NAREIT Total vs. NCREIF Total: NAREIT Total reflects dividend income plus capital appreciation leveraged returns for publicly-traded real estate investment trusts (REITs), while NCREIF Total represents unlevered dividend income plus capital appreciation returns on commercial real estate investment properties. The volatility of the NAREIT Index is higher than that of the NCREIF Index. This suggests the presence of a residual equity component to the NAREIT that could be related to small cap stocks, be simply unique to REITs, or both. Others believe that the NAREIT Index is a leading indicator of what the trend will be for the privately-held NCREIF Index. Wide spreads historically range from 7% to 37%, and narrow spreads from -30% to -3%. NAREIT Dividend vs. 10-Year Treasury: The NAREIT Dividend reflects REIT dividends only (no capital appreciation) on levered investments. Narrowing spreads indicate investors’ willingness to accept a lower risk premium for an asset in a higher risk category than Treasuries. Publicly traded REITs are susceptible to public stock market forces and return lower dividend yields when prices are bid up. Wide spreads historically range from 1% to 7%, and narrow spreads from -1% to -7%. Baa Bond vs. 10-Year Treasury: This spread compares yields on riskier Baa-rated corporate bonds with like-duration Treasuries. Wider spreads indicate bond investors demand higher risk premiums, signaling weak credit market health with scarcer credit and increased default risk. Spreads narrow when risk premiums fall and conditions in the credit markets are more favorable. Wide spreads historically range from 3% to 6%, and narrow spreads from 1% to 2%. For more information about this report or Callan’s Real Estate Consulting Services, please contact Avery Robinson at 415.974.5060 or contact your Callan consultant. 2010-2014: Capital targeting core real estate returns to the market, putting upward pressure on valuations. Increased credit availability coupled with low interest rates assist investment. 2015: Cap rates reach historic lows; years of investor demand and strong fundamentals propel valuations. 2016: Capital flows to real estate and returns moderating as investors exceed target allocations and pricing concerns mount. The income portion regains prominence in the return stream. 20201970 2015