1. 1
Michigan
Tech
University
Student
Research
This
report
is
published
for
educational
purposes
only
by
students
competing
in
the
CFA
Institute
Research
Neogen
Date:
January
19,
2015
Ticker:
NEOG
Recommendation:
Sell
Exchange:
Nasdaq
Current
Price:
$48.16
Industry:
Animal
and
Food
Safety
Target
Price:
$21.20
(Premium:
-‐56%)
Sector:
Healthcare
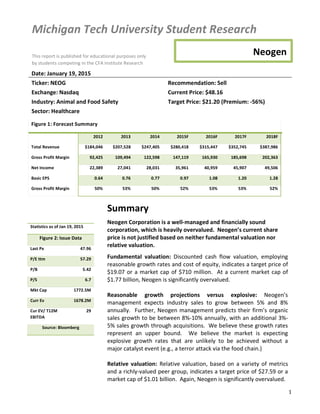
Figure
1:
Forecast
Summary
2012
2013
2014
2015F
2016F
2017F
2018F
Total
Revenue
$184,046
$207,528
$247,405
$280,418
$315,447
$352,745
$387,986
Gross
Profit
Margin
92,425
109,494
122,598
147,119
165,930
185,698
202,363
Net
Income
22,389
27,041
28,031
35,961
40,959
45,907
49,506
Basic
EPS
0.64
0.76
0.77
0.97
1.08
1.20
1.28
Gross
Profit
Margin
50%
53%
50%
52%
53%
53%
52%
Statistics
as
of
Jan
19,
2015
Figure
2:
Issue
Data
Last
Px
47.96
P/E
ttm
57.29
P/B
5.42
P/S
6.7
Mkt
Cap
1772.5M
Curr
Ev
1678.2M
Cur
EV/
T12M
EBITDA
29
Source:
Bloomberg
1
Summary
Neogen
Corporation
is
a
well-‐managed
and
financially
sound
corporation,
which
is
heavily
overvalued.
Neogen’s
current
share
price
is
not
justified
based
on
neither
fundamental
valuation
nor
relative
valuation.
Fundamental
valuation:
Discounted
cash
flow
valuation,
employing
reasonable
growth
rates
and
cost
of
equity,
indicates
a
target
price
of
$19.07
or
a
market
cap
of
$710
million.
At
a
current
market
cap
of
$1.77
billion,
Neogen
is
significantly
overvalued.
Reasonable
growth
projections
versus
explosive:
Neogen’s
management
expects
industry
sales
to
grow
between
5%
and
8%
annually.
Further,
Neogen
management
predicts
their
firm’s
organic
sales
growth
to
be
between
8%-‐10%
annually,
with
an
additional
3%-‐
5%
sales
growth
through
acquisitions.
We
believe
these
growth
rates
represent
an
upper
bound.
We
believe
the
market
is
expecting
explosive
growth
rates
that
are
unlikely
to
be
achieved
without
a
major
catalyst
event
(e.g.,
a
terror
attack
via
the
food
chain.)
Relative
valuation:
Relative
valuation,
based
on
a
variety
of
metrics
and
a
richly-‐valued
peer
group,
indicates
a
target
price
of
$27.59
or
a
market
cap
of
$1.01
billion.
Again,
Neogen
is
significantly
overvalued.
2. 2
2
Strong
financial
health
and
quality
corporate
management:
With
no
long-‐term
debt,
positive
cash
flow
to
support
acquisitions,
and
strong
liquidity,
Neogen
is
a
financially
healthy
company.
Additionally,
Neogen
has
a
business
model
that
provides
consistent
revenue
with
established
customer
relationships.
The
management
has
been
very
tactful
in
their
ability
to
integrate
acquired
businesses
into
their
corporate
framework.
Business
Description
Neogen
Corporation
develops,
manufactures
and
markets
a
variety
of
products
and
services
targeted
for
the
food
and
animal
safety
markets
worldwide.
Products
extend
into
acumedia,
genomics,
life
sciences
and
toxicology.
The
company
was
founded
in
1982
and
has
three
main
points
of
operation
in
Michigan,
Kentucky,
and
Nebraska.
Reportable
Segments
Food
Safety
This
segment
represents
54%
of
the
company’s
revenues.
Products
within
this
space
include
diagnostic
test
kits
and
a
variety
of
complementing
products
to
identify
potentially
dangerous
or
undesired
substances
in
both
human
and
animal
feed.
Examples
include
pathogens,
spoilage
organisms,
drug
and
pesticide
residues,
and
general
sanitation
concerns.
Animal
Safety
This
segment
represents
46%
of
the
company’s
revenues.
Products
include
pharmaceuticals,
rodenticides,
disinfectants,
vaccines,
veterinary
instruments,
diagnostics
products,
and
genetic
testing.
Company
Strategy
Neogen
focuses
on
building
trust
with
its
distributors
and
customers,
while
continuously
offering
a
wider
range
of
products
and
improving
its
existing
lines.
While
the
company
is
committed
to
internal
research
and
development,
Neogen
also
expands
its
product
offerings
through
serial
acquisitions.
Neogen’s
28
acquisitions
since
2000
incorporate
proven
technologies
into
their
global
distribution
network.
Rather
than
acquiring
major
competitors,
Neogen
has
had
a
track
record
of
acquiring
smaller
companies,
which
provide
growth
opportunities
via
new
product
lines.
These
acquisitions
create
a
level
of
synergy,
yet
can
be
assimilated
into
their
corporate
structure.
Typically,
Neogen
pays
1.1x
to
1.3x
sales
for
its
acquisitions.
CFA
Research
Institute
Research
Challenge
January
19,
2015
Figure
3:
Growth
Potential
Dil
EPS
from
Cont
Op
1.7%
Cap
–
1
yr
Gr
18.6%
BVS
–
1
yr
Gr
16.5%
R&D
to
Sales
3.4%
Retention
Ratio
100.0%
Rev
–
1
yr
Gr
19.2%
Empl
1yr
Gr
18.6%
Assets
–
1
yr
Gr
18.8%
Source:
Bloomberg
Figure
4:
Profitability
EBITDA
52.6M
EBIT
43.4M
OPM
17.5%
Pretax
Margin
17.4%
ROA
9.0%
ROE
10.1%
ROC
N.A.
Asset
Turnover
0.8
Source:
Bloomberg
3. 3
-‐30
-‐20
-‐10
0
10
20
-‐10
0
10
Residuals
SPX
Index
-‐
Percent
Figure
6:
SPX
Index-‐
Percent
Residual
Plot
Source:
Bloomberg,
Team
Calculations
Alpha
1.304
Beta
1.001
R^2
0.205
Source:
Bloomberg,
Team
Calculations
-‐20
-‐10
0
10
20
-‐20
0
20
%
Change
in
s&P
500
%
Change
in
NEOG
Figure
5:
Beta
Calculation
3
It
is
important
to
note
that
while
Neogen
has
been
paying
cash
for
these
acquisitions,
management
is
not
opposed
to
larger
acquisitions
requiring
debt
financing.
The
major
consideration
would
be
Neogen’s
ability
to
successfully
incorporate
the
acquired
company
into
its
existing
business
framework
and
corporate
culture.
Industry
Overview
and
Competitive
Positioning
Industry
Growth
The
primary
markets
demanding
food
and
animal
safety
products
are
developed
nations
and
supply
chains
serving
middle
and
high
income
classes
within
developing
nations.
As
reported
in
the
2013
annual
report
by
Neogen,
the
global
middle
class
is
expected
to
grow
from
1.8
billion
to
4.9
billion
by
2030.
This
growth
in
income
will
mean
a
continued
expansion
in
the
demand
for
animal
and
food
safety
products
as
this
segment
will
demand
higher
quality
food.
With
the
highest
potential
for
industry
growth
outside
the
United
States,
Neogen
has
been
building
its
corporate
footprint
internationally.
Indeed,
management
believes
that
67%
of
future
growth
opportunities
lie
beyond
the
United
States.
However,
the
company
has
experienced
its
challenges
gaining
a
foothold
in
international
markets.
Neogen
is
committed
to
being
a
forefront
player,
as
the
potential
for
new
regulations
and
consumer
demand
in
these
regions
provide
a
significant
demand
for
food
and
animal
safety
products.
Through
strategic
acquisitions,
Neogen
has
been
able
to
tap
into
new
distribution
networks
bringing
its
range
of
products
to
China,
Brazil,
Latin
America,
Europe,
and
shortly
India.
Neogen
currently
sells
products
in
110
countries
serving
123
distributors.
As
of
2014,
international
sales
accounted
for
38%
of
revenues
for
Neogen.
Apart
from
an
increased
growth
in
the
demand
for
quality
food,
the
corporations
in
the
supply
chain
have
been
shifting
to
a
reduced
number
of
suppliers.
In
response,
Neogen
has
been
offering
a
broader
selection
of
product
lines,
thus
providing
a
“one
stop
shop”
for
all
food
and
animal
safety
needs.
Indeed,
Neogen
has
the
largest
selection
of
products
within
the
industries
it
serves.
Product
Segments
Food
Safety:
The
food
safety
testing
industry
consists
of
both
the
process
of
testing
and
the
subsequent
required
treatment
to
ensure
the
safety
of
food
throughout
the
supply
chain
from
production,
processing,
to
end
consumer.
This
market
segment
is
expected
to
CFA
Research
Institute
Research
Challenge
January
19,
2015
4. 4
CFA
Research
Institute
Research
Challenge
January
19,
2015
4
grow
to
$15
billion
by
2019.
The
largest
market
will
remain
to
be
North
America
followed
by
Europe.
Asia-‐Pacific
is
expected
to
be
the
largest
driver
of
growth
in
the
industry.
Animal
Safety:
Although
there
are
many
products
sold
by
Neogen
within
the
animal
safety
industry,
the
intervention
products
market
provides
Neogen
with
niche
access
to
a
$1+
billion
addressable
market
of
which
they
have
a
12%
share.
This
market
is
expected
to
grow
at
5-‐
7%
moving
forward.
Competitors
Charm
Sciences
is
a
privately
held
firm
that
is
a
world
leader
in
food
safety,
water
quality,
and
environmental
diagnostic
tests.
The
company
segments
its
products
based
on
target
use.
Charm
Sciences
uses
the
following
categories
for
its
products:
dairy,
food
and
grain,
food
and
beverage,
water,
healthcare
solutions,
products
and
instruments.
Charm
Sciences
prides
itself
on
its
quality
of
products,
continuous
innovation,
excellent
customer
support,
and
scientific
merit.
Furthermore,
Charm
Sciences
has
a
current
customer
base
in
more
than
100
countries
all
over
the
world.
Charm
Sciences
achieves
its
superiority
through
extensive
and
thorough
research
and
development.
Idexx
Laboratories
is
a
publicly
traded
firm
and
poses
the
biggest
competitive
threat
to
Neogen
due
to
its
substantial
relative
size.
Idexx
Laboratories
employs
more
than
six
times
as
many
employees
as
Neogen,
and
has
a
market
cap
four
and
half
times
larger.
Idexx
Laboratories’
products
are
sold
to
customers
in
more
than
175
countries
around
the
world.
Idexx
Laboratories
focuses
its
line
of
products
around
animal,
milk,
and
water
safety.
Idexx
Laboratories
also
markets
products
in
communications,
practice
efficiency,
diagnostics,
information
technology,
and
veterinary
medicine.
Idexx
Laboratories
also
engages
and
expends
many
of
their
usable
resources
on
research
and
development.
Each
of
the
aforementioned
companies,
Charm
Sciences
and
Idexx
Laboratories,
pose
significant
competitive
threats
to
Neogen,
although
in
varying
ways.
Charms
Sciences
is
much
more
closely
related
to
Neogen
in
terms
of
offered
products
and
the
target
customer
base
of
these
products.
It
poses
the
bigger
threat
in
the
product
competition
and
having
the
most
innovative,
valued
products.
Idexx
Laboratories,
however,
is
the
bigger
threat
in
terms
of
sheer
size.
Theoretically,
if
desired
and
advantageous,
Idexx
Laboratories
could
further
challenge
-‐20
-‐15
-‐10
-‐5
0
5
10
15
20
25
-‐10
-‐5
0
5
10
NEOG
US
Equity
-‐
Percent
SPX
Index
-‐
Percent
NEOG
US
Equity
-‐
Percent
Predicted
NEOG
US
Equity
-‐
Percent
Figure
7:
SPX
Index
-‐
Percent
Line
Fit
Plot
Source:
Bloomberg,
Team
Calculations
Figure
8:
Structure
Curr
Ratio
7.6
Quick
Ratio
5.1
Debt/Assets
0.0%
Debt/Com
Eq
0.0%
A/R
Turnover
5.4
Inv
Turnover
2.7
GM
0.496
EBIT/Int
Exp
N.A.
Source:
Bloomberg
5. 5
Figure
10:
Correlation
of
NEOG
to
S&P
500
Correlation:
2000-‐2015
S&P
NEOG
S&P
1
0.350
NEOG
0.350
1
Correlation:
2010-‐2015
S&P
NEOG
S&P
1
0.453
NEOG
0.453
1
Source:
Bloomberg,
Team
Calculations
CFA
Research
Institute
Research
Challenge
January
19,
2015
5
the
specific
product
lines
of
Neogen
even
more
so.
All
three
companies
spend
a
lot
of
their
valuable
resources
on
research
and
development.
Corporate
Governance
and
Social
Responsibility
Neogen
prides
itself
on
being
able
to
save
thousands
of
people
from
becoming
sick
or
potentially
worse
each
day
through
the
distribution
of
their
products.
As
stated
by
Neogen’s
founder,
“we
don’t
make
the
food
you
eat,
but
we
make
it
safer.”
The
company
focuses
on
building
a
devoted
workforce
that
is
passionate
about
influencing
positive
change
in
the
food
and
animal
safety
industry.
The
company
stresses
values
like
honesty,
integrity,
ethical
responsibility,
and
respect.
The
social
policies
of
Neogen
are
governed
by
the
Corporate
Governance
Committee
which
provides
oversight
for
management
succession,
human
resources
practices,
risk
management,
and
environment
and
health
safety
issues.
Investment
Risks
Government
Standards
Neogen’s
product
lines
help
businesses
ensure
they
are
meeting
government
standards
for
food
and
animal
safety.
With
this
said,
Neogen
benefits
as
governments
increase
standards
within
the
industries
served.
Europe,
Canada
and
the
United
States
have
some
of
the
strictest
standards
for
food
and
animal
safety
in
the
world
which
has
allowed
Neogen
to
prosper
within
their
markets.
A
concern
within
these
markets
includes
changes
in
requirements
for
approval
to
sell
certain
products,
or
existing
regulations
which
would
affect
current
product
lines.
As
emerging
markets
increase
safety
standards
Neogen
will
be
in
a
prime
position
to
capitalize.
However,
if
emerging
markets
don’t
enact
increased
standards
Neogen
could
face
significant
challenges
as
they
push
to
expand
their
global
footprint.
Quality
and
Litigation
The
manufacturing
and
distribution
of
Neogen’s
products
are
subject
to
inherent
risk
of
product
liability
claims.
Although
the
company
carries
liability
insurance,
there
is
the
potential
that
its
insurance
policies
wouldn’t
adequately
cover
potential
claims
against
Neogen.
Pricing
and
Competition
The
food
and
animal
safety/diagnostics
markets
are
extremely
competitive.
While
there
are
a
number
of
major
competitors
in
the
space,
this
market
has
a
multitude
of
small
“mom
and
pop”
$0.00
$0.50
$1.00
$1.50
$2.00
$2.50
$3.00
$3.50
$4.00
NEOG
SPX
Index
Figure
9:
Growth
of
$1
since
January
2010
Source:
Bloomberg,
Team
Calculations
6. 6
6
competitors
that
are
able
to
build
market
share
for
niche
product
lines.
This
creates
a
unique
operating
environment
that
requires
upper
management
to
be
tactful
in
their
strategic
approach.
Integration
of
Acquisitions
Based
on
Neogen’s
growth
strategy,
management
must
excel
at
evaluating
and
integrating
acquisitions
into
the
existing
sales
and
distributions
models.
This
process
requires
existing
management
to
work
closely
with
the
acquired
business
units
often
pulling
them
from
other
duties.
It
is
a
significant
challenge
to
retain
and
motivate
quality
management,
who
can
successfully
integrate
acquisitions
with
Neogen.
Financial
Analysis
Earnings
Historically,
Neogen
has
been
posting
significant
year
over
year
gains
across
multiple
revenue
segments,
partially
driven
by
acquisitions.
Both
their
food
safety
and
animal
safety
segments
have
had
continuous
growth
since
2012.
For
example,
their
acquisitions
with
SyrVet
Inc.
in
July
2013
and
Prima
Tech
Inc.
in
November
2013,
which
are
both
veterinary
instrument
companies.
These
acquisitions
have
helped
increase
revenue
within
their
animal
safety
segment
by
29%,
especially
the
veterinary
instruments
and
disposables
segment
by
70%.
Cash
&
Cash
Flows
Based
on
forecasts,
Neogen
is
expected
to
see
increases
in
net
changes
in
cash
due
to
increases
in
cash
from
operating
activities
exceeding
cash
used
in
investing
activities.
This
expansion
of
cash
flow
of
Neogen
will
have
spillover
effects
into
the
Balance
Sheet
strength.
0.00%
2.00%
4.00%
6.00%
8.00%
10.00%
12.00%
FY
2010
FY
2011
FY
2012
FY
2013
FY
2014
FYE
2015
FYE
2016
FYE
2017
FYE
2018
Figure
13:
Return
on
Assets
0.00%
2.00%
4.00%
6.00%
8.00%
10.00%
12.00%
14.00%
FY
2010
FY
2011
FY
2012
FY
2013
FY
2014
FYE
2015
FYE
2016
FYE
2017
FYE
2018
Figure
12:
Return
on
Equity
CFA
Research
Institute
Research
Challenge
January
19,
2015
Figure
11:
FY
2012
Revenue
by
Segment
Natural
Toxins,
Allergens
and
Drug
Residues
Bacterial
and
General
Sanitajon
Dehydrated
Culture
Media
and
Other
Life
Sciences
Veterinary
Instruments
and
Disposables
Animal
Care
and
Other
Rodenjcides,
Insecjcides
and
Disinfectants
Source:
Bloomberg,
Team
Eshmates
Source:
Bloomberg,
Team
Estimates
Source:
Bloomberg,
Team
Estimates
7. 7
CFA
Research
Institute
Research
Challenge
January
19,
2015
7
Balance
Sheet
Strength
One
of
Neogen’s
practices
is
to
fund
operations
and
acquisitions
without
the
use
of
debt.
As
a
result
of
their
positive
cash
flows
from
operations,
cash
balances
will
be
strong
into
the
future,
which
provides
Neogen
with
the
opportunity
to
pay
dividends,
repurchase
stock
or
expand
their
acquisition
program.
Valuation
Free
Cash
Valuation
Overview
We
employed
a
three-‐stage
free
cash
flow
to
equity
valuation
model.
Revenues
were
modeled
by
individual
sectors
and
then
grouped
into
Neogen’s
reporting
segments
(either
product
revenues
or
service
revenues).
Individual
sector
revenues
were
modeled
based
on
the
sector
outlooks,
while
keeping
historical
revenue
growth
rates
in
mind.
Given
Neogen
is
a
serial
acquirer,
the
model
incorporated
additional
revenues
via
acquisitions.
The
acquisition
costs
were
treated
as
capital
expenditures
in
the
calculation
of
free
cash
flow
and
the
effect
of
acquisitions
were
included
in
the
perpetual
growth
rate.
Free
cash
flows
were
calculated
explicitly
for
the
upcoming
four
periods.
A
transitional
period
was
included,
where
growth
was
linearly
adjusted
downward
to
the
terminal
growth
rate.
Cost
of
equity
was
estimated
using
an
adjusted
beta
and
the
CAPM
model.
Shares
outstanding
were
grown
based
on
the
employee
stock
options
currently
held,
assuming
a
100%
rate
of
exercise.
The
balance
sheet
and
statement
of
cash
flows
reflect
the
exercise
of
these
options.
Relative
Valuation
Using
a
peer
group
of
companies
in
the
Diagnostics
Testing
industry,
a
relative
valuation
was
conducted
on
the
basis
of
the
P/E,
P/CF,
P/B,
and
P/S
ratios.
As
seen
in
Figure
14,
Neogen’s
value
for
each
of
these
metrics
exceeds
the
peer
group
median.
Next,
the
median
ratio
from
the
peer
group
for
each
metric
was
used
to
imply
a
valuation
for
Neogen.
As
seen
in
Figure
14,
Neogen
had
an
implied
price
of
$27.98,
$25.09,
$27.13,
and
$30.16,
based
on
the
P/E,
P/CF,
P/B,
and
P/S
ratios,
respectively.
These
implied
prices
are
consistent
in
value.
An
average
of
the
four
implied
valuations
produced
a
target
price
of
$27.59
for
Neogen.
This
share
price
equates
to
a
market
cap
of
$1.01
billion
compared
to
their
current
market
cap
of
$1.77
billion.
$-‐
$20
$40
P/S
P/B
P/CF
P/E
Figure
14:
NEOG
Stock
Implied
Price
0
20
40
60
P/S
P/B
P/CF
P/E
Figure
15:
Relahve
Valuahon
Peer
Group
Median
NEOG
US
Equity
Source:
Bloomberg,
Team
Estimates
Source:
Bloomberg,
Team
Estimates
8. 8
CFA
Research
Institute
Research
Challenge
January
19,
2015
8
Inherently,
what
can
be
derived
from
the
relative
valuation
method
is
that
Neogen
is
richly
valued
relative
to
its
peers.
Furthermore,
these
peers
appear
to
be
overvalued,
based
on
the
same
overconfidence
in
future
growth
rates
and
industry
performance.
INVESTMENT
SUMMARY
Our
final
target
price
was
computed
using
a
weighted
average
of
both
our
discounted
cash
flow
fundamental
valuation
as
well
as
our
relative
valuation
analysis.
Given
the
peer
group
used
to
conduct
the
relative
valuation
was
richly
valued,
a
weight
of
only
25%
was
applied
to
the
relative
valuation
method
and
the
remaining
75%
was
applied
to
the
discounted
cash
flow
valuation.
(25%
x
$27.59)
+
(75%
x
$19.07)
=
$21.20
In
summary,
Neogen
is
a
financially
stable
firm
with
experience
and
proven
management.
However,
the
current
market
price
exceeds
a
justifiable
a
level.
Only
a
major
catalyst
event,
such
as
a
terror
attack
via
the
food
chain,
could
support
the
current
market
price.
0
1
2
3
4
5
Threat
of
New
Entrants
Bargaining
Power
of
Suppliers
Bargaining
Power
of
Customers
Compejjve
Rivalry
Threat
of
Subsjtute
Figure
16:
NEOG's
Compehhve
Posihon
Source:
Team
Estimates
9. 9
CFA
Research
Institute
Research
Challenge
January
19,
2015
Disclosures:
Ownership
and
material
conflicts
of
interest:
The
author(s),
or
a
member
of
their
household,
of
this
report
does
not
hold
a
financial
interest
in
the
securities
of
this
company.
The
author(s),
or
a
member
of
their
household,
of
this
report
does
not
know
of
the
existence
of
any
conflicts
of
interest
that
might
bias
the
content
or
publication
of
this
report.
Receipt
of
compensation:
Compensation
of
the
author(s)
of
this
report
is
not
based
on
investment
banking
revenue.
Position
as
a
officer
or
director:
The
author(s),
or
a
member
of
their
household,
does
not
serves
as
an
officer,
director
or
advisory
board
member
of
the
subject
company.
Market
making:
The
author(s)
does
not
act
as
a
market
maker
in
the
subject
company’s
securities.
Ratings
guide:
Banks
rate
companies
as
either
a
BUY,
HOLD
or
SELL.
A
BUY
rating
is
given
when
the
security
is
expected
to
deliver
absolute
returns
of
15%
or
greater
over
the
next
twelve
month
period,
and
recommends
that
investors
take
a
position
above
the
security’s
weight
in
the
S&P
500,
or
any
other
relevant
index.
A
SELL
rating
is
given
when
the
security
is
expected
to
deliver
negative
returns
over
the
next
twelve
months,
while
a
HOLD
rating
implies
flat
returns
over
the
next
twelve
months.
Disclaimer:
The
information
set
forth
herein
has
been
obtained
or
derived
from
sources
generally
available
to
the
public
and
believed
by
the
author(s)
to
be
reliable,
but
the
author(s)
does
not
make
any
representation
or
warranty,
express
or
implied,
as
to
its
accuracy
or
completeness.
The
information
is
not
intended
to
be
used
as
the
basis
of
any
investment
decisions
by
any
person
or
entity.
This
information
does
not
constitute
investment
advice,
nor
is
it
an
offer
or
a
solicitation
of
an
offer
to
buy
or
sell
any
security.
This
report
should
not
be
considered
to
be
a
recommendation
by
any
individual
affiliated
with
Michigan
Technological
University.
CFA
Institute
or
the
CFA
Institute
Research
Challenge
with
regard
to
this
company’s
stock.