Santander’s 2012 attributable net profit was EUR 2.205 billion (-59%), after making charges of EUR 18.800 billion and reducing property exposure in Spain
•
1 like•840 views

Santander’s 2012 attributable net profit was EUR 2.205 billion (-59%), after making charges of EUR 18.800 billion and reducing property exposure in Spain

Recommended
Recommended
More Related Content
What's hot
What's hot (16)
Viewers also liked
Viewers also liked (20)
Similar to Santander’s 2012 attributable net profit was EUR 2.205 billion (-59%), after making charges of EUR 18.800 billion and reducing property exposure in Spain
Similar to Santander’s 2012 attributable net profit was EUR 2.205 billion (-59%), after making charges of EUR 18.800 billion and reducing property exposure in Spain (20)
More from BANCO SANTANDER
More from BANCO SANTANDER (20)
Santander’s 2012 attributable net profit was EUR 2.205 billion (-59%), after making charges of EUR 18.800 billion and reducing property exposure in Spain
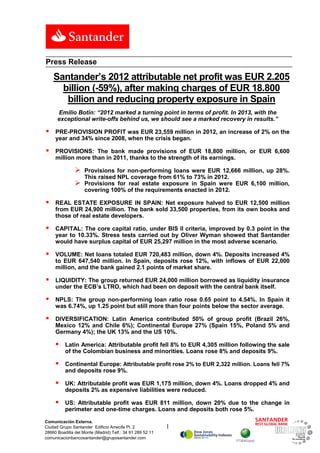
- 1. Press Release Santander’s 2012 attributable net profit was EUR 2.205 billion (-59%), after making charges of EUR 18.800 billion and reducing property exposure in Spain Emilio Botín: “2012 marked a turning point in terms of profit. In 2013, with the exceptional write-offs behind us, we should see a marked recovery in results.” PRE-PROVISION PROFIT was EUR 23,559 million in 2012, an increase of 2% on the year and 34% since 2008, when the crisis began. PROVISIONS: The bank made provisions of EUR 18,800 million, or EUR 6,600 million more than in 2011, thanks to the strength of its earnings. Provisions for non-performing loans were EUR 12,666 million, up 28%. This raised NPL coverage from 61% to 73% in 2012. Provisions for real estate exposure in Spain were EUR 6,100 million, covering 100% of the requirements enacted in 2012. REAL ESTATE EXPOSURE IN SPAIN: Net exposure halved to EUR 12,500 million from EUR 24,900 million. The bank sold 33,500 properties, from its own books and those of real estate developers. CAPITAL: The core capital ratio, under BIS II criteria, improved by 0.3 point in the year to 10.33%. Stress tests carried out by Oliver Wyman showed that Santander would have surplus capital of EUR 25,297 million in the most adverse scenario. VOLUME: Net loans totaled EUR 720,483 million, down 4%. Deposits increased 4% to EUR 647,540 million. In Spain, deposits rose 12%, with inflows of EUR 22,000 million, and the bank gained 2.1 points of market share. LIQUIDITY: The group returned EUR 24,000 million borrowed as liquidity insurance under the ECB’s LTRO, which had been on deposit with the central bank itself. NPLS: The group non-performing loan ratio rose 0.65 point to 4.54%. In Spain it was 6.74%, up 1.25 point but still more than four points below the sector average. DIVERSIFICATION: Latin America contributed 50% of group profit (Brazil 26%, Mexico 12% and Chile 6%); Continental Europe 27% (Spain 15%, Poland 5% and Germany 4%); the UK 13% and the US 10%. Latin America: Attributable profit fell 8% to EUR 4,305 million following the sale of the Colombian business and minorities. Loans rose 8% and deposits 9%. Continental Europe: Attributable profit rose 2% to EUR 2,322 million. Loans fell 7% and deposits rose 9%. UK: Attributable profit was EUR 1,175 million, down 4%. Loans dropped 4% and deposits 2% as expensive liabilities were reduced. US: Attributable profit was EUR 811 million, down 20% due to the change in perimeter and one-time charges. Loans and deposits both rose 5%. Comunicación Externa. Ciudad Grupo Santander Edificio Arrecife Pl. 2 1 28660 Boadilla del Monte (Madrid) Telf.: 34 91 289 52 11 comunicacionbancosantander@gruposantander.com
- 2. Madrid, Jan. 31, 2013 - Grupo Santander registered net attributable profit of EUR 2,205 million in 2012, 59% less than in 2011. Ordinary profit was EUR 5,251 million, while capital gains came to EUR 1,065 million, mainly from the sale of the Colombian unit and the reinsurance of the Spanish and Portuguese life insurance portfolios. Profit for the year would have been EUR 6,315 million, but after setting aside a net EUR 4,110 million to cover real estate exposure in Spain, fell to EUR 2,205 million. Banco Santander’s Chairman Emilio Botín said: “Profits reached a turning point in 2012. In 2013, with the exceptional write-offs behind us, we should see a marked increase in earnings, based on the group’s recurrent revenues and cost control.” 2012 Highlights 2012 Data Evolution 1 Sustained results Group pre-provision profit: Year increase: +2% generation EUR 23,559 mill. Increase since 2008: +32% 2 Group provisions: EUR 19 bn. Provisions > 100% of Royal Decrees Effort in Group NPL ratio: 4.54% Better than financial system average provisions Coverage ratio: 73% Coverage: Increased 11 p.p. in the year 3 Generating capital Core capital ratio (BIS II): Capital improvement Reducing RWAs 10.33% The ratio increased for the sixth year 4 Repaid EUR 24 bn. of LTROs (maximum) Loan-to-deposit (LTD) ratio: Improved Sharp improvement of LTD since 2008: Group 113% liquidity position Group 150% Spain 96% Spain 178% 2012 ordinary attributable profit: EUR 5,251 million Attributable profit after provisions: EUR 2,205 million Results The 2012 results demonstrate the group’s strength. Although the economic backdrop has been difficult for several years, revenues and pre-provision profit have continued to grow by around 2%. Group revenues were EUR 43,675 million and costs were EUR 20,116 million. The difference between the two gave Santander a pre-provision profit of EUR 23,559 million and an efficiency ratio of 46.1%. Both those numbers are among the strongest in international banking. The pre-provision profit shows Santander’s capacity to generate earnings and set aside provisions when the economic situation requires. The bank set aside EUR 12,666 million in provisions for non-performing loans, an increase of 28%, and assigned a further EUR 6,140 million gross (or EUR 4,110 million net) to cover real estate exposure in Spain. These provisions allowed the bank to increase its NPL coverage for a fourth consecutive quarter, to 73% across the group and 71% in Spain, improvements of 11 and 25 percentage points, respectively. Santander’s diversification is the main reason that group results have held up so well against such a difficult backdrop in Europe, where it carries out a large part of its business. Latin America contributed 50% of profits (Brazil 26%, Mexico 12% and Chile 6%), Continental Europe brought in 27% (Spain 15%, Poland 5% and Germany 4%), the UK 13% and the US 10%. Comunicación Externa. Ciudad Grupo Santander Edificio Arrecife Pl. 2 2 28660 Boadilla del Monte (Madrid) Telf.: 34 91 289 52 11 comunicacionbancosantander@gruposantander.com
- 3. Sustained results generation Ordinary attributable profit by geographic segment in 2012(1) In 2012 Santander maintained an excellent track record in pre-provision profit underpinned by solid revenues … Portugal, 1% Poland, 5% Revenues and costs1 Pre-provision profit1 Spain, 15% EUR Billion EUR Billion Germany, 4% Brazil, 26% Other Europe, 2% United Kingdom, 2008 2009 2010 2011 2012 13% Gross income Costs Net operating income Mexico, 12% ... placing us in the small group of international banks with net operating income above EUR 23 billion USA, 10% (1) In order to make a homogeneous comparison the P&L accounts of previous years have been restated, including the contribution from Santander Consumer USA and the insurance business in Latin America (included in the transaction with Other Latam, Chile, 6% Zurich Seguros) in the "income from the equity accounted method" line. 6% (1) Over operating areas ordinary attributable profit Balance sheet Santander focused on reinforcing its balance sheet, as shown by the hefty provisions and the improvements in capital ratios and liquidity. Group outstanding loans were EUR 720,483 million, or 113% of total deposits of EUR 647,540 million. In December, 2008, before the crisis, this ratio was 150%. Loans fell 4 % and deposits rose 4%, not including securities repurchase agreements. The trend in Spain is particularly noteworthy: deposits exceeded loans for the first time in decades. For every EUR 100 in deposits the bank had EUR 96 of loans, while, four years earlier, there were EUR 178 in loans for every EUR 100 of deposits. There are two reasons for this: the marked deleveraging of the Spanish economy and the fact that Santander’s deposits have grown despite an overall decrease in the market. At the end of 2012, Santander in Spain had EUR 194,170 million of loans, a decline of 6% in gross lending, and EUR 201,850 million of deposits, an increase of 12%. The bank captured EUR 22,000 million in deposits, increasing its market share by 2.1 points. The fastest growth came from individual deposits, up 19%, followed by companies, with an increase of 6.0%. The fall in loans is closely linked to the 32% decrease in real estate lending. Deposits performed well in all other markets, growing by 9% in Latin America, with Mexico expanding 19% and Brazil and Chile both by 6%. Deposits rose 5% in the US, 2% in Portugal and were stable in the UK. Santander also issued medium- and long-term debt totaling EUR 31,100 million during 2012 and placed asset-backed securities worth EUR 11,900 million. In January this year Santander sold EUR 2,000 million of five-year covered bonds and EUR 1,000 million of seven-year senior debt. This improvement in liquidity allowed the bank to return EUR 24,000 million to the ECB, the full amount borrowed by Santander and Banesto under the December, 2011, LTRO. Santander still has a further EUR 11,000 million it took at the second ECB liquidity window. It treats these ECB loans as “liquidity insurance” and leaves them on deposit at the ECB. Lending varied greatly from one market to another. Outstanding loans in Latin America increased 8%, thanks to growth of 9% in Chile, 7% in Mexico and 6% in Brazil, and Comunicación Externa. Ciudad Grupo Santander Edificio Arrecife Pl. 2 3 28660 Boadilla del Monte (Madrid) Telf.: 34 91 289 52 11 comunicacionbancosantander@gruposantander.com
- 4. expanded by 5% in both Poland and the US. In the remaining European countries, outstanding loans fell: Portugal declined 9%, Spain 6% and the UK 4%. Customer loans Customer funds under management Customer loans. December 2012 Customer funds under management. December 2012 % o/ operating areas % o/ operating areas US: 5% US: 6% Other Latin América: 3% Other Latin América: 2% Chile: 4% Chile: 4% Mexico: 3% Mexico: 4% Spain: 28% Spain: 28% Brazil: 11% Brazil: 14% Portugal: 3% Portugal: 4% Germany: 4% Germany: 4% Poland: 1% United Kingdom: Poland: 2% United Kingdom: Other Europe: 2% 34% 32% Other Europe: 2% The group non-performing loan rate was 4.54%, or 0.65 point more than in 2011. In Spain, NPLs were 6.74%, up 1.25 point from the year before, partly because of the fall in outstanding loans. In the UK, the NPL rate rose 0.21 point to 2.05% and in Latin America it climbed 1.1 point to 5.42%. In contrast, the rate fell 0.56 point in the US, eased 0.17 point in Poland and 0.07 point to 3.90% in Santander Consumer Finance. NPL rates are below average in practically all the bank’s markets and particularly in Spain, where the average ratio for the industry as a whole is four points above Santander’s. Real estate exposure in Spain Banco Santander reduced its exposure to real estate in Spain by 26% in 2012, from EUR 31,994 million to EUR 23,705 million. This was done by reducing the loan portfolio (doubtful, substandard and up-to-date loans) as well as properties adjudicated or acquired in lieu of debt repayments. Effort in Group's provisions Net real estate exposure in Spain declined 69% since the onset of the crisis due to effort in provisions and sharp volumes reduction Total exposure coverage Total real estate exposure in Spain (including outstanding risk) EUR Billion -EUR 28.5 bn.; -69% 47% Gross exposure 22% Coverage 3% Net exposure Dec'08 Dec'11 Dec'12 Of which: Net loans: 8.8 • Coverage excl. outstanding risk1: 50% Net foreclosed: 3.7 • Outstanding risk coverage2 : 39% (1) Non-performing + Substandard + Foreclosed assets from real estate in Spain (2) Outstanding risk = performing loans Comunicación Externa. Ciudad Grupo Santander Edificio Arrecife Pl. 2 4 28660 Boadilla del Monte (Madrid) Telf.: 34 91 289 52 11 comunicacionbancosantander@gruposantander.com
- 5. Outstanding loans fell in 2012 by EUR 7,575 million to EUR 15,867 million, while properties on the balance sheet fell by EUR 714 million to EUR 7,838 million. This decline was the result of the bank’s aggressive sales of its own properties and those of real estate developers, which came to a record 33,500 units. The bank will continue to make the selling of these assets a priority. Moreover, the bank substantially increased provisions, bringing reserves allocated to the sector to EUR 11,196 million, providing coverage of 47% of real estate exposure. With these reserves, net exposure to real estate in Spain is EUR 12,509 million, about half the EUR 24,892 million at the end of 2011. Capital and the share Grupo Santander had a core capital ratio of 10.33% at the end of 2012 under Basel II criteria, or 0.31 point more than a year earlier. In the third quarter, the international consultancy Oliver Wyman, backed by the large international audit firms and property assessors, carried out an in-depth analysis of Spanish banks’ loan portfolios. It concluded that Santander would have surplus capital of EUR 25,297 million in 2014 even in a worst-case scenario. At the end of September Santander successfully floated 24.9% of its Mexican subsidiary, with demand of almost five times the number of shares on offer. The placement was valued at EUR 3,200 million. Capital improvement In 2012 the core capital ratio increased for the sixth straight year Core capital ratio 2012 evolution +31 b.p. +1.34 10.33 10.02 -1.03 Dec’11 Ordinary profit Net provisions Dec’12 generation + + FX rate Mexico IPO Note: Dec’06 and Dec’07 according to BIS I On December 17, the bank announced a proposal to merge Banesto and Banif with Banco Santander, which will be submitted to shareholders for their approval in March. Under the proposed terms, Banesto’s minority shareholders can exchange their holdings for Santander shares with a premium of 25%. The merger of these units should produce synergies of EUR 520 million by the third year. It will significantly increase the number of Santander branches and will especially strengthen the corporate and private banking businesses. The transaction has no impact on capital. Comunicación Externa. Ciudad Grupo Santander Edificio Arrecife Pl. 2 5 28660 Boadilla del Monte (Madrid) Telf.: 34 91 289 52 11 comunicacionbancosantander@gruposantander.com
- 6. At the end of 2012, Santander’s market capitalisation was EUR 62,959 million euros, which makes it the biggest bank in the euro zone by this measure. The share ended the year at EUR 6.10, up 3.9% compared with December, 2011. The per share remuneration charged to 2012 results will be EUR 0.60 for the third year running and will be distributed under the Dividendo Elección (scrip dividend) programme, which allows shareholders to choose between receiving a dividend in cash or shares on each of the four usual dividend payment dates. The Board of Directors approved on January 28 the fourth dividend under the programme, for a rounded EUR 0.146 a share. Santander had 3,296,270 shareholders at the end of 2012. The group employed 186,763 people, serving 102 million customers in 14,392 branches, making Santander the largest international financial group in terms of shareholders and branch network. For further information, see www.santander.com Comunicación Externa. Ciudad Grupo Santander Edificio Arrecife Pl. 2 6 28660 Boadilla del Monte (Madrid) Telf.: 34 91 289 52 11 comunicacionbancosantander@gruposantander.com
- 7. Variation 2012 2011 Amount % 2010 Balance sheet (EUR million) Total assets 1,269,628 1,251,525 18,103 1.4 1,217,501 Net customer loans 720,483 750,100 (29,618) (3.9) 724,154 Customer deposits 626,639 632,533 (5,895) (0.9) 616,376 Customer funds under management 968,987 984,353 (15,366) (1.6) 985,269 Shareholders' equity (1) 80,821 80,400 421 0.5 75,273 Total managed funds 1,387,769 1,382,980 4,789 0.3 1,362,289 Income statement (EUR million) Net interest income 30,147 29,110 1,037 3.6 27,728 Gross income 43,675 42,754 921 2.2 40,586 Pre-provision profit (net operating income) 23,559 23,195 364 1.6 22,682 Profit from continuing operations 6,148 7,812 (1,663) (21.3) 9,077 Attributable profit to the Group 2,205 5,351 (3,146) (58.8) 8,181 EPS, profitability and efficiency (%) EPS (euro) 0.23 0.60 (0.38) (62.5) 0.94 Diluted EPS (euro) 0.22 0.60 (0.37) (62.5) 0.94 ROE 2.80 7.14 11.80 ROTE 4.11 10.81 18.11 ROA 0.24 0.50 0.76 RoRWA 0.55 1.06 1.54 Efficiency ratio (with amortisations) 46.1 45.7 44.1 BIS II ratios and NPL ratios (%) Core capital 10.33 10.02 8.80 Tier I 11.17 11.01 10.02 BIS II ratio 13.09 13.56 13.11 NPL ratio 4.54 3.89 3.55 NPL coverage 72.6 61.4 72.7 Market capitalisation and shares Shares (2) (millions at period-end) 10,321 8,909 1,412 15.9 8,329 Share price (euros) 6.100 5.870 0.230 3.9 7.928 Market capitalisation (EUR million) 62,959 50,290 12,669 25.2 66,033 Book value (1) (euro) 7.87 8.59 8.58 Price / Book value (X) 0.78 0.68 0.92 P/E ratio (X) 27.02 9.75 8.42 Other data Number of shareholders 3,296,270 3,293,537 2,733 0.1 3,202,324 Number of employees 186,763 189,766 (3,003) (1.6) 175,042 Continental Europe 58,074 58,864 (790) (1.3) 49,705 o/w: Spain 31,438 31,889 (451) (1.4) 32,189 United Kingdom 26,186 27,505 (1,319) (4.8) 24,427 Latin America 90,576 91,913 (1,337) (1.5) 89,551 USA 9,525 9,187 338 3.7 8,866 Corporate Activities 2,402 2,297 105 4.6 2,493 Number of branches 14,392 14,756 (364) (2.5) 14,082 Continental Europe 6,437 6,608 (171) (2.6) 6,063 o/w: Spain 4,683 4,781 (98) (2.0) 4,848 United Kingdom 1,189 1,379 (190) (13.8) 1,416 Latin America 6,044 6,046 (2) (0.0) 5,882 USA 722 723 (1) (0.1) 721 Information on ordinary profit Attributable profit to the Group 5,251 7,021 (1,769) (25.2) 8,181 EPS (euro) 0.54 0.79 (0.25) (31.9) 0.94 Diluted EPS (euro) 0.53 0.78 (0.25) (31.9) 0.94 ROE 6.66 9.37 11.80 ROTE 9.80 14.18 18.11 ROA 0.48 0.63 0.76 RoRWA 1.08 1.35 1.54 P/E ratio (X) 11.34 7.43 8.42 Note: The financial information in this report has not been audited, but it was approved by the Board of Directors at its meeting on January, 28 2013, following a favourable report from the Audit and Compliance Committee on January, 21 2013. The Committee verified that the information for the quarter was based on the same principles and practices as those used to draw up the annual financial statements. (1) In 2012, estimated data of May 2013 scrip dividend (2) In 2011, includes shares issued to cover the exchange of preferred shares of December 2011 Comunicación Externa. Ciudad Grupo Santander Edificio Arrecife Pl. 2 7 28660 Boadilla del Monte (Madrid) Telf.: 34 91 289 52 11 comunicacionbancosantander@gruposantander.com
- 8. Key data by principal segments Net operating income Attributable profit to the Group Efficiency ratio (%) ROE (%) 2012 2011 Var (%) 2012 2011 Var (%) 2012 2011 2012 2011 Income statement (EUR million) Continental Europe 7,555 7,018 7.6 2,305 2,287 0.8 45.5 47.1 7.36 7.66 o/w: Santander Branch Network 2,582 2,353 9.7 709 660 7.4 44.2 46.5 10.99 9.63 Banesto 1,267 1,112 14.0 94 130 (28.1) 44.1 47.4 1.96 2.78 Portugal 533 443 20.4 124 174 (28.7) 48.6 54.4 4.92 7.00 Santander Consumer Finance 1,763 1,887 (6.6) 727 666 9.0 43.9 41.3 6.70 7.02 Retail Poland (BZ WBK) 543 366 48.4 330 232 42.0 43.9 47.0 18.97 17.93 United Kingdom* 2,434 3,270 (25.5) 1,094 1,223 (10.5) 53.0 44.3 8.23 9.60 Latin America 14,872 13,397 11.0 4,305 4,664 (7.7) 37.9 39.8 19.44 21.78 o/w: Brazil 10,685 9,861 8.4 2,212 2,610 (15.2) 35.3 37.6 17.85 23.26 Mexico 1,695 1,369 23.8 1,015 936 8.5 39.7 41.9 25.07 21.16 Chile 1,385 1,252 10.6 498 611 (18.5) 40.0 39.2 22.09 25.43 USA 1,430 1,741 (17.8) 811 1,010 (19.7) 45.1 36.4 15.53 24.76 Operating areas* 26,291 25,425 3.4 8,515 9,184 (7.3) 42.3 42.4 11.83 13.49 Corporate Activities* (2,733) (2,230) 22.5 (3,263) (2,163) 50.9 Total Group* 23,559 23,195 1.6 5,251 7,021 (25.2) 46.1 45.7 6.66 9.37 Net capital gains and provisions (3,047) (1,670) 82.4 Total Group 2,205 5,351 (58.8) 46.1 45.7 2.80 7.14 (*).- Excluding net capital gains and provisions Net customer loans Customer deposits NPL ratio (%) * NPL coverage (%) * 31.12.12 31.12.11 Var (%) 31.12.12 31.12.11 Var (%) 31.12.12 31.12.11 31.12.12 31.12.11 Activity (EUR million) Continental Europe 285,147 305,391 (6.6) 258,691 247,582 4.5 6.25 5.18 72.5 55.8 o/w: Santander Branch Network * 95,134 102,643 (7.3) 95,986 78,864 21.7 9.65 8.47 67.5 39.9 Banesto 61,665 68,850 (10.4) 48,257 50,755 (4.9) 6.28 5.01 71.3 53.1 Portugal 25,960 28,403 (8.6) 23,971 23,465 2.2 6.56 4.06 53.1 54.9 Santander Consumer Finance 56,683 56,731 (0.1) 31,892 33,198 (3.9) 3.90 3.97 109.5 109.3 Retail Poland (BZ WBK) 9,732 8,479 14.8 11,217 10,359 8.3 4.72 4.89 68.3 65.2 United Kingdom 250,527 255,699 (2.0) 194,452 194,318 0.1 2.05 1.84 45.4 40.2 Latin America 140,090 139,867 0.2 134,765 134,078 0.5 5.42 4.32 87.5 97.0 o/w: Brazil 74,511 78,408 (5.0) 69,849 72,405 (3.5) 6.86 5.38 90.2 95.2 Mexico 20,384 18,185 12.1 24,743 21,459 15.3 1.94 1.82 157.3 175.7 Chile 29,677 25,709 15.4 22,411 20,175 11.1 5.17 3.85 57.7 73.4 USA 41,331 40,194 2.8 38,116 36,884 3.3 2.29 2.85 105.9 96.2 Operating areas 717,095 741,152 (3.2) 626,024 612,861 2.1 4.51 3.83 73.1 64.1 Total Group 720,483 750,100 (3.9) 626,639 632,533 (0.9) 4.54 3.89 72.6 61.4 * Santander Branch Network is the retail banking unit of Banco Santander S.A. The NPL ratio of Banco Santander S.A. at the end of December 2012 stood at 7.29% (5.99% in December 2011) and NPL coverage was 69,7% (39,2% in December 2011). Employees Branches 31.12.12 31.12.11 31.12.12 31.12.11 Operating means Continental Europe 58,074 58,864 6,437 6,608 o/w: Santander Branch Network 17,880 17,967 2,894 2,915 Banesto 9,136 9,450 1,647 1,714 Portugal 5,709 5,854 667 716 Santander Consumer Finance 12,279 11,896 629 647 Retail Poland (BZ WBK) 8,849 9,383 519 526 United Kingdom 26,186 27,505 1,189 1,379 Latin America 90,576 91,913 6,044 6,046 o/w: Brazil 53,707 54,368 3,788 3,775 Mexico 13,954 13,062 1,170 1,125 Chile 12,355 12,193 504 499 USA 9,525 9,187 722 723 Operating areas 184,361 187,469 14,392 14,756 Corporate Activities 2,402 2,297 Total Group 186,763 189,766 14,392 14,756 Comunicación Externa. Ciudad Grupo Santander Edificio Arrecife Pl. 2 8 28660 Boadilla del Monte (Madrid) Telf.: 34 91 289 52 11 comunicacionbancosantander@gruposantander.com