Daily Technical Report:20 February 2019
•
0 likes•18 views

Axis Direct presents daily derivatives report presenting recommendations based on technical analysis. For trading in derivatives visit https://simplehai.axisdirect.in/offerings/products/derivatives

Recommended
Recommended
More Related Content
What's hot
What's hot (20)
Similar to Daily Technical Report:20 February 2019
Similar to Daily Technical Report:20 February 2019 (20)
More from Axis Direct
More from Axis Direct (20)
Recently uploaded
Recently uploaded (20)
Daily Technical Report:20 February 2019
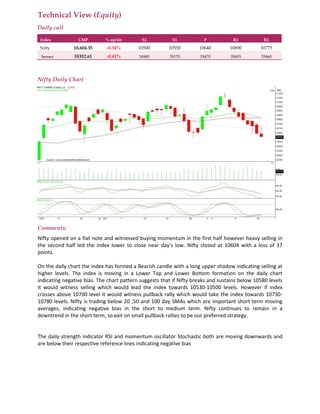
- 1. Technical View (Equity) Daily call Index CMP % up/dn S2 S1 P R1 R2 Nifty 10,604.35 -0.34% 10500 10550 10640 10690 10775 Sensex 35352.61 -0.41% 34985 35170 35470 35655 35960 Nifty Daily Chart Comments: Nifty opened on a flat note and witnessed buying momentum in the first half however heavy selling in the second half led the index lower to close near day's low. Nifty closed at 10604 with a loss of 37 points. On the daily chart the index has formed a Bearish candle with a long upper shadow indicating selling at higher levels. The index is moving in a Lower Top and Lower Bottom formation on the daily chart indicating negative bias. The chart pattern suggests that if Nifty breaks and sustains below 10580 levels it would witness selling which would lead the index towards 10530-10500 levels. However if index crosses above 10700 level it would witness pullback rally which would take the index towards 10730- 10780 levels. Nifty is trading below 20 ,50 and 100 day SMAs which are important short term moving averages, indicating negative bias in the short to medium term. Nifty continues to remain in a downtrend in the short term, so exit on small pullback rallies to be our preferred strategy. The daily strength indicator RSI and momentum oscillator Stochastic both are moving downwards and are below their respective reference lines indicating negative bias
- 2. The trend deciding level for the day is 10640. If NIFTY trades above this level then we may witness a further rally up to 10690-10775-10825 levels. However, if NIFTY trades below 10640 levels then we may see some profit booking initiating in the market, which may correct up to 10550-10500-10415 levels Stocks to focus for intraday Long Bpcl, Grasim, Lt, M&M, Vedl, Zeel Stocks to focus for intraday Short Adaniports, Bajaj-auto, Hdfc, Tcs, Indusindbk