
Recommended
Recommended
More Related Content
What's hot
What's hot (20)
Similar to Kemess Site Visit Highlights Canadian Development Opportunity
Similar to Kemess Site Visit Highlights Canadian Development Opportunity (20)
Recently uploaded
Recently uploaded (20)
Kemess Site Visit Highlights Canadian Development Opportunity
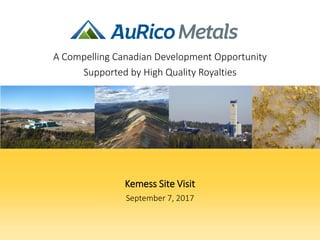
- 1. Kemess Site Visit September 7, 2017 A Compelling Canadian Development Opportunity Supported by High Quality Royalties
- 2. Forward-Looking Statements Cautionary Statement This presentation contains certain information that constitutes “forward-looking information” and “forward-looking statements” as defined under Canadian and U.S. securities laws. All statements in this presentation, other than statements of historical fact, are forward-looking statements. The words “expect”, “believe”, “anticipate”, “contemplate”, “may”, “could”, “will”, “intend”, “estimate”, “forecast”, “target”, “budget”, “schedule” and similar expressions identify forward-looking statements. Forward-looking statements in this presentation include, without limitation, information as to our strategy, projected gold production from the Young-Davidson, Hemlo – Williams, Eagle River, and Fosterville mines, which are not owned by the Company, project timelines, resource and reserve estimates, projected production and costs of the Kemess Underground Project and Kemess East Project, other statements that express our expectations or estimates of future performance, value growth, value creation and shareholder returns, the success of exploration activities, mineral inventory including the Company’s ability to delineate additional resources and reserves as a result of such programs, mineral reserves and mineral resources and anticipated grades, exploration expenditures, costs and timing of any future development, costs and timing of future exploration , the presence of and continuity of metals at Kemess East at modeled grades, as well as expectations relating the assets acquired through the acquisition of Kiska Metals. Forward-looking statements are necessarily based upon a number of factors and assumptions that, while considered reasonable by management at the time of making such statements, are inherently subject to significant business, economic and competitive uncertainties and contingencies. Known and unknown factors could cause actual results to differ materially from those projected in the forward-looking statements. Such factors and assumptions underlying the forward-looking statements in this presentation include, but are not limited to: changes to current estimates of mineral reserves and resources; fluctuations in the price of gold and copper; changes in foreign exchange rates (particularly the Canadian dollar and U.S. dollar); performance of the Young-Davidson, Hemlo – Williams, Eagle River, and Fosterville mines, which may impact the future cash flows associated with the Company’s royalty holdings; the impact of inflation; employee relations; litigation; uncertainty with the Company’s ability to secure capital to execute its business plans; the speculative nature of mineral exploration and development, including the risks of obtaining necessary licenses, permits, authorizations and/or approvals from the appropriate regulatory authorities for the Kemess Underground project; contests over title to properties; changes in national and local government legislation in Canada and other jurisdictions in which the Company does or may carry on business in the future; risk of loss due to sabotage and civil disturbances; the impact of global liquidity and credit availability and the values of assets and liabilities based on projected future cash flows; as well as business opportunities that may be pursued by the Company. Actual results and developments are likely to differ, and may differ materially, from those expressed or implied by the forward-looking statements contained in this presentation. Such statements are based on a number of assumptions, including those noted elsewhere in this document, which may prove to be incorrect. Readers are cautioned that forward-looking statements are not guarantees of future performance. All of the forward-looking statements made in this presentation are qualified by these cautionary statements. There can be no assurance that forward-looking statements or information will prove to be accurate, accordingly, investors should not place undue reliance on the forward-looking statements or information contained herein. The Company disclaims any intention or obligation to update or revise any forward-looking statements whether as a result of new information, future events or otherwise, except as required by applicable law. Cautionary Note to U.S. Investors Concerning Measured, Indicated and Inferred Resources This presentation uses the terms "measured", "indicated" and "inferred” resources. We advise investors that while those terms are recognized and required by Canadian regulations, the United States Securities and Exchange Commission does not recognize them. “Inferred resources” have a great amount of uncertainty as to their existence and as to their economic and legal feasibility. It cannot be assumed that all or any part of an inferred resource will ever be upgraded to a higher category. Under Canadian rules, estimates of inferred mineral resources may not form the basis of feasibility or other economic studies. United States investors are cautioned not to assume that all or any part of measured or indicated mineral resources will ever be converted into mineral reserves. United States investors are also cautioned not to assume that all or any part of an inferred mineral resource exists, or is economically or legally mineable. Qualified Person as Defined by National Instrument 43-101 John Fitzgerald, Chief Operating Officer for AuRico Metals Inc. has reviewed and approved the scientific and technical information contained within this presentation. Mr. Fitzgerald is a “Qualified Person” as defined by National Instrument 43-101. Note: All amounts are in US dollars unless otherwise indicated. 2
- 3. 1. AuRico Overview 2. Kemess Overview 3. Kemess Underground (KUG) – Feasibility Study Highlights 4. Kemess East (KE) – PEA Highlights & Exploration 5. Kemess Valuation & Benchmarking 6. Q&A Table of Contents 3
- 4. 1. AuRico Overview Compelling Opportunity ✓ Strong balance sheet (C$28M cash2) with no debt ✓ Unique risk – reward dynamic through combination of stand-out development project with royalties ✓ Attractive valuation ✓ Strong management and technical team Kemess (100% Owned) ✓ Advanced-stage, Brownfields Au/Cu project in British Columbia ✓ Kemess Underground (KUG) – FS (’16), EA and IBA Approved (‘17) ✓ Kemess East (KE) – PEA (‘17); KE drilling ongoing, Kemess integrated study to be completed in 2018 ✓ Positive Economics – Supported by ~C$1B of infrastructure in place ✓ +12Moz Gold Equivalent Ounces (all resource categories)1 Royalty Portfolio ✓ Portfolio of high quality NSR royalties in Canada and Australia ✓ 2017E Royalty revenue of C$14.0 – C$14.7M (US$10.5 - $11.0M) ✓ 21 royalties + 6 wholly-owned properties with royalty creation potential ✓ NSR Royalties incl. Young-Davidson (1.5%), Fosterville (2%), Hemlo (0.25%), Eagle River (0.5%), East Timmins (0.5%), Boulevard (1%), GJ (1%) 4
- 5. 0.20 0.40 0.60 0.80 1.00 1.20 1.40 1.60 Jul - 15 Oct - 15Jan - 16Apr - 16 Jul - 16 Oct - 16Jan - 17Apr - 17 Jul - 17 AMI Share Price Since Inception in July 2015 AMI (C$/shr) Gold Price US$/oz (indexed to AMI) GDXJ - Jr. Gold Miner ETF (indexed to AMI) Track-Record of Adding Value Kemess: ✓ Receipt of Environmental Assessment Certificate for Kemess Underground (KUG) ✓ Signed Impact Benefits Agreement for KUG ✓ Announced positive PEA results on Kemess East ✓ 188% increase in Indicated resource for Kemess East ✓ Submitted permit applications for KUG Royalties: ✓ 2017E royalty revenue guidance since beginning of year has increased by 31% to C$14.0 – C$14.7M ✓ Increase in Production Guidance: Fosterville + 79%; YD + 18-24%; Eagle River + 12%-22% ✓ Increase in P&P Reserves: Fosterville +110%; Hemlo +73%; Eagle River +15% ✓ Acquisition of Kiska Metals completed Key Developments – 2017 Year to Date AuRico Relative Performance 5 +136% +47% +12%
- 6. Capital Structure (TSX – AMI) Share Price (as of September 1, 2017) C$1.37 Shares Outstanding 162M Market Capitalization C$222M Cash (as of June 30, 2017) C$28M Total Debt (as of June 30, 2017) Zero Available credit facility US$15M Management Team Chris Richter President & CEO John Fitzgerald Chief Operating Officer David Flahr VP Finance John Miniotis VP Corporate Development Grant Ewing VP Exploration Sean Masse Mining Manager Mike Padula Construction Manager Harold Bent Director, Environment Wade Barnes Exploration Manager Board of Directors Richard Colterjohn (Chair) - Former CEO of Centenario Copper John McCluskey - CEO of Alamos Gold Scott Perry - CEO of Centerra Gold Janice Stairs - Independent Director Joseph Spiteri - Independent Mining Consultant Anne Day - SVP IR, Richmont Mines Anthony Garson - Extensive career in Finance Chris Richter - CEO of AuRico Metals Major Shareholders1 Alamos Gold 9% Donald Smith & Company 8% Van Eck Associates 6% Tocqueville Asset Management 5% AMI Management & Directors 4% Market Overview Analyst Coverage Target Prices Implied Return Laurentian Bank (Ryan Hanley) C$2.00 46% Macquarie (Michael Siperco) C$2.00 46% National Bank (Shane Nagle) C$1.80 31% Paradigm Capital (Don MacLean) C$1.70 24% Red Cloud (Derek Macpherson) NA NA 6
- 7. 0 2 4 6 8 10 12 2015A* 2016A 2017E $USM Fosterville Young Davidson Other $65 $81 $99 3 8 21 0 5 10 15 20 $0 $20 $40 $60 $80 $100 $120 Jul-15 16-Dec Current #ofroyalties US$M NAV ($US M) (Left Scale) Number of royalties High Quality Royalty Portfolio – Summary Producing Royalties NSR Rate Operator Young-Davidson 1.50% Fosterville 2.00% Hemlo 0.25% Eagle River 0.50% Producing Royalties - High Quality & Long Life Increase in Annual Royalty Revenues (US$ M) Increase in Analyst Net Asset Valuation ▪ Value of royalty portfolio has increased significantly: Reserves and Production increasing at existing royalties and have completed several accretive royalty acquisitions * Royalty revenue from Young-Davidson commenced on July 2, 2015 +156% +52% 7 (C$132) 0 5 10 15 20 25 Eagle River Hemlo Fosterville Young- Davidson Producing Royalty Mineral Inventory (years)1 P&P M&I Inferred
- 8. The Kemess Underground Project is 100% owned by AuRico Metals 2. Kemess Overview Processing plant (capacity of 52ktpd) Admin-Workshop- Warehouse Complex Camp (accommodations for +300) KUG tailings storage facility KUG 8
- 9. Kemess Underground Project – Key Technical Team John Fitzgerald Chief Operating Officer • Over 27 years experience • Director of Mining at AuRico Gold and Northgate Minerals – part of Young Davidson development team • Significant block/panel caving experience gained in various roles at Rio Tinto and De Beers • Former management roles at Barrick Gold, Scotia Capital and successful independent consultant Sean Masse Mining Project Manager • Over 16 years experience • Senior member of team that successfully brought New Gold's New Afton panel cave mine into production • Former superintendent and mine manager at New Afton • Most recently working to build Cementation Canada's business in Western Canada Mike Padula Surface Construction Project Manager • Over 29 years experience • Project Manager for Victoria Gold’s Eagle Gold Project in central Yukon • Manager of mining wastes and water for MMG Limited's Izok Corridor Project in Nunavut • Part of senior management group for both AMEC Americas and De Beers Canada which advanced Snap Lake Diamond Project to construction Harold Bent Director Environment • Over 25 years experience • Working at Kemess since 1999 with progressive responsibilities • Responsible for all environmental, regulatory compliance and reclamation activities Wade Barnes Project Geologist • Over 13 years experience • Working at Kemess since 2010 • Recipient of H.H. “Spud” Huestis Award in 2016 Claudette Gouger First Nations Liaison • Over 22 years experience • Community Manager at New Gold’s Blackwater Project • Extensive experience building and maintaining collaborative partnerships with local, national, international and indigenous stakeholders Experienced Project Management Team 9
- 10. • Located in north-central British Columbia • Approximately 250 km north of Smithers, and ~430 km northwest of Prince George • Kemess South (KS) mine, Kemess Underground (KUG) & Kemess East (KE) • KUG ~6.5 km north of existing KS processing plant, and KE deposit ~1 km east of KUG Location & General Overview 10
- 11. Kemess Overview Kemess Underground (Feasibility – 2016) ▪ Reserves of 3.5Moz AuE1 (1.9Moz Au and 0.6Blbs Cu) ▪ NPV (5%, after tax) of C$421M and IRR of 15.4%2 ▪ LOM of 12 years at 207Koz AuE/yr at AISC of $718/oz ▪ Environmental Approvals received ▪ Permitting and review of financing alternatives ongoing Unique development opportunity Kemess South (Past Producer: 1998 – 2011) ▪ ~C$1B of infrastructure in place (including processing facility, grid power, road, maintenance shop, etc.) ▪ Past production of 3Moz Au and 750Mlbs Cu Brownfields opportunity significantly reduces risk Kemess East (PEA – May 2017) ▪ M&I rscs. of 4.1Moz AuE1 (1.7Moz Au and 1Blbs Cu) ▪ NPV (5%, after tax) of C$375M and IRR of 16.7%2 ▪ LOM of 12 years at 222Koz AuE/yr at AISC of $744/oz ▪ Additional ~12,000m of drilling planned for 2017 Exciting upside potential 11
- 12. Kemess Existing Infrastructure Approximately C$1 Billion of Infrastructure is Already in Place • Kemess South open pit mine operated from 1998 to 2011 • Tailings storage facility & waste rock dumps • Currently on care & maintenance (forecast of $4M for 2017) • Existing infrastructure includes: • Process plant of 52ktpd with grinding capacity currently limited to 25ktpd • Camp (7 x 40-person bunk house units, kitchen, potable water facility, sewage facility) • Powerline (380 km, 230 kV-power line step-down transformers, backup diesel generators) • Concentrate rail load-out facility in Mackenzie (currently being leased to Mt. Milligan) • Other (admin building, workshop, warehouse, 1,500m all weather air strip, 400 km access road) 12
- 13. Kemess History KS Mine - Successful Operating Track Record • Produced between 1998 - 2011 • Comprised a large open pit and 52ktpd plant • Produced ~3.0Moz Au, and 750M lbs Cu • Production ceased due to depletion of open pit mineral reserves 1996: Kemess property acquired by Royal Oak Mines 1998: Kemess South open pit mine commences operations 1999: Kemess acquired by Northgate Minerals 2011: Kemess South open pit mine operation end 2011: Northgate acquired by AuRico Gold 2013: KUG feasibility study released 2015: Kemess spun-out to AuRico Metals (as part of AuRico Gold - Alamos merger) 2016: KUG updated feasibility study released 2017: KE resource update 2017: KUG EA Approval (Federal & Provincial) 2017: KUG IBA Finalized 2017: KE PEA 13
- 14. Kemess – Key Study Outputs Kemess South (Actual) Kemess UG1 (Feasibility Study) Kemess East2 (PEA – PR ) Tonnes, Au Grade, Cu Grade3 219Mt / 0.63gpt / 0.21% (1.08 gpt AuE; 0.47% CuE) 107Mt / 0.54gpt / 0.27% (1.12 gpt AuE; 0.54% CuE) 103Mt / 0.42gpt / 0.34% (1.16 gpt AuE; 0.56% CuE) Throughput 50,000 25,000 30,000 LOM Free Cash Flow (C$ M)4 $750 $987 $797 NPV (5%, After-tax) NA C$421M C$375M After-Tax IRR NA 15.4% 16.7% Initial Capex ~C$470M C$600M (US$450M) C$327 (US$245M) Mine Life (years) 13 12 12 Avg. Annual Gold Production (Koz) 241 106 80 Avg. Annual Copper Production (Mlbs) 64 47 57 Avg. Annual AuE Production (Koz) 431 207 222 Avg. Annual CuE Production (Mlbs) 151 104 92 Cash Costs Gold (by-product) ($/oz) $169/oz $94/oz ($415)/oz AISC – Co-product basis (Au; Cu) NA $718/oz; $1.44/lb $744/oz; $1.79/lb AISC – By-product basis (Au) NA $244/oz ($69)/oz KUG & KE have not been integrated – Optimization opportunity to be evaluated through integrated study 14 1 Kemess UG production equivalency and cost figures based on $1,250/oz Au and $2.50/lb Cu. NPV and IRR figures based on $1,250/oz Au and $3.00/lb Cu. 2 All Kemess East figures based on $1,250/oz Au and $3.00/lb Cu. 3 Gold Equivalent calculated on basis of $1,250/oz Au and $3.00/lb Cu. KE figures reflect M&I Resources, and Kemess South and KUG reflect P&P Reserves 4 Average realized prices for Kemess South during 1998-2011 were $549/oz Au and $1.79/lb Cu
- 15. KUG - Reserves & Resources Classification Quantity Grade Contained Metal Gold (g/t) Copper (%) Silver (g/t) Gold (koz) Copper (klbs) Silver (koz) Proven and Probable Proven - - - - - - - Probable 107,381 0.54 0.27 1.99 1,868 629,595 6,878 Total P&P 107,381 0.54 0.27 1.99 1,868 629,595 6,878 Measured - - - - - - - Indicated 246,400 0.42 0.22 1.75 3,328 1,195,300 13,866 Total M&I 246,400 0.42 0.22 1.75 3,328 1,195,300 13,866 Inferred Total Inferred 21,600 0.40 0.22 1.70 277 104,700 1,179 Kemess Underground M&I Resources are inclusive of reserves 15
- 16. Kemess Timeline – And Cu Outlook 10,000 15,000 20,000 25,000 30,000 2014 2015 2016 2017 2018 2019 2020 2021 2022 2023 2024 2025 ThousandTonnes Production from Existing and Fully Committed Mines Supply (Mine Production + SXEW + Scrap) Demand Source: Teck, Wood Mackenzie, CRU, ICSG DEFICIT Expected First Production at Kemess Schedule as per Feasibility Study (March 2016) Federal and Provincial EA Approvals KUG Impact Benefit Agreement Signed Normal Course Permitting Detailed Engineering Project Financing Access Corridor Development Decline Development Develop Panel Cave First Production 20222016 2017 2018 2019 2020 2021 16
- 17. 3: KUG - Feasibility Study Highlights March 2016 - Positive Feasibility Study Update Announced for Kemess UG Footprint: 570 m E-W 90-300 m N-S 200 m draw height 200-500 m below surface 17
- 18. Kemess Underground Project 18 Existing Process Plant Admin-Workshop-Warehouse Complex Camp
- 19. Proposed Mining Process Panel caving underground mining minimizes waste rock 1. Ore crushed underground 2. Placed on conveyor to surface 3. Process plant ~25,000 tpd 4. Tailings deposited into Kemess South mined out pit 5. Au-Cu concentrate trucked to Mackenzie 6. Concentrate transferred to rail and sent to port/smelters Underground panel caving 19
- 20. Waste Rock, Tailings Storage & Water Management • Existing Kemess South Pit will be the Kemess Underground Tailings Storage Facility (KUG TSF) • Waste rock (~3Mt) & tailings (~107Mt) produced through 12-yr mine life will be stored underwater in the facility • East rim will be raised 25m to accommodate volume in Year 6 to 8 • Mine water will be pumped to the KUG TSF during operations • Process water will be sourced from the KUG TSF 20
- 21. Kemess Underground Cross Section showing Decline, Underground Workings & Panel Cave • KUG reserve situated approximately 200 to 550 m below surface • Mine will be accessed and supported by a triple decline system comprising access, ore conveying and ventilation declines • Total LOM development requirements are estimated to be 47,750m lateral and 2,200m vertical development (all lateral development assumed to be by owner crews) • Total 2,250t of ore per metre of lateral development results from this mine design, representing a very high development efficiency compared to other UG mining methods • KUG panel cave requires < 5% of ore tonnes to be blasted (vs. 100% for a typical UG mine) “While all mining projects have residual technical uncertainties, the KUG Project is considered to be relatively low risk for a caving project in terms of key mining-related risks including production ramp-up, drawpoint stability, subsidence and mudrush.” - SRK Consulting 21
- 22. KUG Extraction Level Layout 22
- 23. KUG Surface Expression • Ore fed from undercut level to extraction level via 582 total drawpoints • Average production rate of 25ktpd (9Mtpa) • Caving initiated in highest value ore at east end of KUG • Ore delivered to one of four primary jaw crushers located on extraction level • Following crushing, ore placed on 3.2km underground conveyor and then on a 4.9km surface conveyor to process plant 23
- 24. Simplified Process Flowsheet • Processing of 9Mtpa using one of the two grinding circuits used to process KS ore • Tailings pumped and stored in the KS open pit with minimum capacity of 107.4Mt ore treated • Testwork resulted in estimated recoveries of 91% Cu, 72% Au and 65% Ag • Produces clean concentrate with no penalty elements and an estimated 22% copper content & high gold/silver by-product credits (30–50 g/t Au, and 75-100 g/t Ag in concentrate) • Ore NSR values peak at almost C$48/t in Year 3 of production and average C$35/t over LOM 24
- 25. KUG: Production and Costs Low Cost Mining ▪ Avg LOM production of 106koz Au, 47M lbs Cu, 207koz AuE1 ▪ Total LOM cash costs of US$639 and AISC of US$718 per AuE ▪ AISC of US$682/oz over first 5 years ▪ Caving initiated in the highest value ore ▪ Low ‘break-even’ in early years allows for accelerated debt repayment ▪ Payback of 3.3 years (consensus pricing case2) 0 50,000 100,000 150,000 200,000 250,000 300,000 350,000 0 100 200 300 400 500 600 700 800 900 -1 1 2 3 4 5 6 7 8 9 10 11 12 13 Annual Gold Equivalent Production vs. USD AISC Gold Equivalent Production AISC(USD) $/oz Ounces 25
- 26. Operating Cost Benchmarking (C$/Tonne) New Afton Costs (Actuals per 2015 43-101)(1) New Afton Scale- Adjusted Costs (2) Kemess UG Costs (per 2016 43- 101) Mining 6.59 5.34 5.39 Processing 9.46 6.54 5.95 Site G&A 2.97 1.70 2.93 Total 19.02 13.58 14.27 • Kemess UG mining cost estimate compares well to existing block cave in British Columbia after adjusting for scale of the operation • Kemess UG processing costs are based on actual costs of operating the Kemess Mill, which ceased operations in 2011, updated for current labour, consumables and electricity rates • Kemess UG G&A costs are higher by $1 per tonne due to location, and the need to incur additional flight and camp costs 1) New Afton’s actual costs for 2014 are provided in table 21-2 of the New Afton NI 43-101 Technical Report dated March 23, 2015 2) Scale-Adjusted cost calculated by applying assumption that 40% of mining costs, 65% of processing costs, and 90% of G&A costs would remain constant if capacity was increased from 2014 actual throughput of 13,130 TPD to Kemess design capacity of 25,000 TPD 26 Mining 38% Processing 40% G&A 20% Water Treatment 2% Kemess Opex Breakdown
- 27. Select Caving Comparables 2016E Cash Cost (Co-Product) Positioning KUG in top quartile(2) Northparkes Cadia EastNew Afton Operation Tonnes (Mt) Au (g/t) Cu (%) Kemess UG 107 0.54 0.27 Kemess East* 113 0.46 0.38 New Afton 60 0.60 0.78 Northparkes 102 0.26 0.60 Cadia East 1,500 0.48 0.28 Proven & Probable Reserve Comparison1 27 *Note: M&I resources shown for Kemess East Source: Cost curve from Wood Mackenzie
- 28. Capital Expenditures • “Low risk” capex given infrastructure in place; Proven logistics • 87% of capital expenditures are C$ denominated • Capex is heavily weighted to final 2 years prior to commercial production • Opportunity to reduce capex through equipment leasing (representing 19% of total capital) Item To First Production Additional to Commercial Production Total Mine $154 $46 $200 Mill $23 $6 $29 Access Corridor $27 $0 $27 Conveyor $30 $0 $30 UG Electrical & Ventilation $22 $0 $22 Owner’s Cost, G&A, Other $25 $1 $26 Capitalized Operating Costs $108 $71 $179 Pre-Comm Revenue $0 ($64) ($64) TOTAL $393 $59 $452 28
- 29. 0 40 80 120 160 200 Year -4 Year -3 Year -2 Year -1 Year 1 KUG Capital Costs (C$M) 0 100 200 300 400 Offtake-linked project financing Equipment Financing Sale of Royalty Portfolio Potential Kemess Royalty or Stream Sale of JV Interest and associated reduction in capex Illustrative Financing Alternatives (C$ M) KUG Capex Profile and Funding ▪ Ongoing “stage gating” efforts to identify opportunities to defer non-critical path capital ▪ Pre-commercial capex1 per FS at commencement of construction totals C$587M (US$440M) Financing Advantages: ▪ 100% interest ▪ Unencumbered (no royalty on Kemess) ▪ Clean concentrate ▪ Valuable royalty portfolio 1 Includes capitalized operating costs of C$222M and pre-commercial revenue of C$83M Total: $640M+ 29 ?
- 30. Offtake Linked Debt Financing • KUG & KE to produce clean copper concentrate with no penalty elements & high gold/silver by-product credits • Engaged Cutfield Freeman to assess off-take linked financing alternatives • Project supports significant debt capacity (up to 50%-60% of total required capital) • Targeting Agency-backed project debt in exchange for offtake commitment - some recent examples include: • Copper Mountain (JBIC), Gibraltar (JBIC), Caserones (JBIC, NEXI, JOGMEC) and Sierra Gorda (JBIC) • Objective is to have terms in place by mid-2018 30 Project Commodity Agency Partner(s) Capital Cost1 Debt Arranged (Agency / Total) Direct Investment (Interest / Acquisition Cost) Caserones Copper JBIC, NEXI, JOGMEC Pan Pacific Copper, Mitsui US$2,000m Undisclosed / US$1,400m N/A (Wholly-owned) Sierra Gorda Copper JBIC KGHM, Sumitomo Corp., Sumitomo Metal Mining US$2,877m US$700m / US$1,000m 45% / US$724m Copper Mountain Copper JBIC Copper Mountain Mining, Mitsubishi Materials C$437m US$160m / US$320m 25% / C$28.75m Gibraltar Copper - Taseko Mines, Sojitz N/A N/A 12.5% / C$187m Source: Cutfield Freeman & Co Ltd 1. Capital cost at announcement of project financing Select Offtake-Linked Transactions
- 31. • Undergoing a coordinated permitting review process, meaning that all required permit applications are submitted and reviewed at same time • Submitted all permit applications to Major Mines Permitting Office (MMPO) on August 31st • Commenced 45-day screening process to ensure that applications are complete • Once permit applications have been screened, and if accepted, there is expected to be up to three rounds of comments during which all comments will be received and addressed under specified timelines • Permitting process anticipated to be completed in Q2 2018 31 Permitting Status and Timelines February 2014 Project Description submitted to the BC Environmental office (BCEAO) and Canadian Environmental Assessment Agency (CEAA) April 2014 Determination from BCEAO and CEAA that an Environmental Assessment is required May 2014 – January 2016 Finalization of Applicant Information Requirements (Terms of Reference) and preparation of Environmental Assessment Application May 2016 Submission of Environmental Application January 2017 EAO released draft Assessment Report which concluded that the project would not result in significant adverse effects March 2017 KUG granted EA Certificate from BCEAO and CEAA issued a positive Decision Statement August 31, 2017 Submitted permit applications to Major Mines Permitting Office (MMPO) Q2/2018 Expected receipt of normal course permits needed to commence construction Environmental Permitting Timeline
- 32. Strong Relationships With First Nations Which First Nations will be affected by the Project? • Two Aboriginal traditional territories overlap the Kemess Project location: Tsay Keh Dene and Takla Lake • One Aboriginal traditional territory is adjacent & downstream from the project location: Kwadacha • These three nations identify themselves as the Tse Keh Nay (‘TKN’) • On May 18th the Company entered into an Impact Benefits Agreement ("IBA") with TKN • The IBA provides a framework that formalizes the long-term co-operative relationship between AMI and TKN over the life of the project • Captures mutual commitment to consult and maintain an open, respectful and cooperative relationship throughout the development and operation • Provides for meaningful TKN participation through training, employment, business opportunities, environmental protection and other means 32
- 33. 4. Kemess East – PEA Highlights & Exploration 33
- 34. Kemess East Resource Update • Successful 2016 drilling program with highlight holes including: • #13: 628m of 0.53 g/t Au, 0.41% Cu • #12: 549m of 0.55 g/t Au, 0.41% Cu • #9: 504m of 0.52 g/t Au, 0.36% Cu • High grade core associated with strong potassic alteration zone which remains open both to north and south, as does the overall deposit • Overall Indicated category tonnage increased by 74Mt (188%) compared to March 2016 estimate • Higher grade Indicated core includes: 67Mt at 0.43% Cu and 0.60 g/t Au ~82Mt in high grade (potassic strong) core with Cu grade 60% higher and Au grade 8% higher than KUG Reserves Kemess UG + Kemess East Reserves and Resources (all categories) of +12Moz AuE Indicated tonnes in high grade core increased by 250% Classification Quantity Grade Contained Metal Gold (g/t) Copper (%) Silver (g/t) Gold (koz) Copper (klbs) Silver (koz) Indicated potassic strong 67,200 0.60 0.43 2.06 1,292 640,000 4,457 potassic moderate 40,000 0.27 0.32 1.81 352 286,000 2,336 potassic weak 5,100 0.19 0.22 1.45 31 24,000 238 phyllic + propylitic 800 0.20 0.21 1.40 5 4,000 36 Indicated - Total 113,100 0.46 0.38 1.94 1,680 954,000 7,066 Inferred potassic strong 15,200 0.51 0.41 2.05 249 137,000 1,003 potassic moderate 41,900 0.26 0.34 1.91 353 311,000 2,579 potassic weak 6,000 0.17 0.20 1.42 32 27,000 274 phyllic + propylitic 700 0.24 0.21 1.42 6 3,000 33 Total Inferred 63,800 0.31 0.34 1.90 640 478,000 3,889 Kemess East Resource1 M&I Resources are inclusive of reserves 34
- 35. Kemess East (KE) – PEA Summary ▪ PEA for KE project completed by Golders in May 2017 and NI 43-101 report released in July ▪ Presents stand-alone scenario that does not factor in or modify economics of the Feasibility stage KUG Project ▪ UG panel cave offset by 0.9km from KUG and 770m deeper ▪ Total life-of-mine production of 963koz gold, 687Mlbs copper and 3.8Moz silver ▪ After-tax NPV5% of C$375M, and IRR of 16.7% ▪ Key upsides include: ▪ Sequencing – consider overlapping production between KUG and KE (using current plant capacity of 50 ktpd) ▪ Integration – potential economies of scale with KUG project on ore processing, G&A and site services ▪ Mineral Resources – Improving quality and quantity of KE mineral resource ▪ Next steps include: ▪ KUG-KE scoping level optimization (H2 2017) ▪ 2017 Kemess drilling (Q3) to lead to an updated KE mineral resource estimate (early 2018) ▪ Complete a feasibility-level study on integrated development scenario for KUG and KE (H2 2018) 35
- 36. Significant Production Scale 36 - 50,000 100,000 150,000 200,000 250,000 300,000 350,000 Y4 Y5 Y6 Y7 Y8 Y9 Y10 Y11 Y12 Y13 Y14 Y15 Y16 Y17 Kemess East - Project Schedule Year Kemess East AuE Production (oz) 0 50,000 100,000 150,000 200,000 250,000 300,000 350,000 -2 -1 1 2 3 4 5 6 7 8 9 10 11 12 13 Kemess UG - Project Schedule Year Kemess UG AuE Production (oz) ▪ Kemess UG (2016 – Feasibility) : LOM of 12 years at 207Koz AuE/yr at AISC of $718/oz ▪ Kemess East (2017 – PEA): LOM of 12 years at 222Koz AuE/yr at AISC of $744/oz
- 37. Kemess East 2017 Drilling Update Pad I KOZ zone Pad E Pad D 5 Pad A Pad I KOZ zone • Program goal: • infill drilling targeting the potassic strong zone, • growth holes on the outer edges of the known deposit, and • looking for higher grade within the Kemess Offset Zone • Kemess Offset Zone (“KOZ”) is located between the KUG and KE deposits, which are 1 km apart 37 • 2017 drill program of ~12,000 metres at KE (~C$4M - $5M) commenced on July 8th
- 38. Kemess East – Opportunities & Next Steps Upcoming Near-Term Activities Q3 2017 •Additional in-fill and expansion drilling Q4 2017 •Release of 2017 Kemess East drill program results •KUG-KE scoping level optimization Q4 2017 - Q1 2018 •Incorporate 2017 drilling data into update KE mineral resource estimateQ1 2018 •Complete feasibility-level study on integrated development scenario for KUG and KE 2018 •Complete additional metallurgical test work on KE ore 2018 •Continue baseline environmental data collection for KE Project Enhancement Opportunities Sequencing: Alternative scenario to evaluate overlap in production between KUG and KE Integration with KUG project: Economies of scale for integrated scenario may exist in: ore processing, G&A and site services Mineral Resources: KE mineral resource remains open to the north, south, and west Development advance rate: Increase development efficiencies of forecasted UG development rate of 4.5 m/day per heading Metallurgy: Further improvement in recoveries and concentrate grade based on additional metallurgical test work Tailings alternatives: Additional tailings storage alternatives for KE could be studied, including the further use of conventional slurry tails Mining mobile equipment leasing: PEA assumes purchasing all mobile equipment for C$90M Operating cost: Potential to decrease mining operating costs with automated production load-haul-dump (LHD) equipment 38
- 39. 5. Kemess – Valuation & Benchmarking EA and IBA in place BC, Canada Kemess represents biggest value opportunity Overall revenue mix ~50%/50% Au/Cu KUG: 12 yrs KE: 12 yrs Lowest Cost Quartile Annual prod’n of KUG: 207koz AuE KE: 222koz AuE Large porphyry system that is not fully explored 39
- 40. Kemess – Sensitivities Copper Price (US$/lb) $2.50 $2.75 $3.00 3.25 3.50 Gold Price (US$/oz) $1,350 $347 $418 $490 $561 $632 $1,300 $312 $384 $456 $527 $598 $1,250 $278 $349 $421 $493 $564 $1,200 $243 $315 $387 $458 $530 $1,150 $208 $280 $352 $424 $495 KUG Sensitivities NPV5% - Feasibility Study Update (March 2016) based on C$/US$ FX rate of 0.75 40 KE Sensitivities NPV5% - PEA release (May 2017) based on C$/US$ FX rate of 0.75 Copper Price (US$/lb) $2.50 $2.75 $3.00 3.25 3.50 Gold Price (US$/oz) $1,350 $258 $340 $422 $504 $586 $1,300 $235 $317 $399 $480 $562 $1,250 $211 $293 $375 $457 $539 $1,200 $188 $270 $352 $433 $515 $1,150 $164 $246 $328 $410 $492 IRR ($3.00/lb) 16.5% 16.0% 15.4% 14.7% 14.0% IRR ($3.00/lb) 17.9% 17.3% 16.7% 16.1% 15.5%
- 41. Kemess Project Positioning Gold Developers ▪ 1) Based on respective company’s price deck. ▪ 2) AMI enterprise value adjusted for fair value of royalties assumed based on analyst consensus estimates. ▪ 3) Based on 2016 Fraser Institute “Survey of Mining Companies”; “Best Practices” based on world class regulatory environment, highly competitive taxation, no political risk or uncertainty and a fully stable mining regime. ▪ Kemess compares favourably to other projects on a number of factors including: stage, jurisdiction, scale and valuation Company Project NPV(1) EV / Project NPV EA Approval Jurisdiction(3) 73 73 69 75 61 82 61 76 58 75 n/a 65 59 30 81 44 75 73 AMI Gold Developers Gold DevelopersKemess PEA PFS FS 0.0 0.1 0.2 0.3 0.4 $0 $200 $400 $600 $800 $1,000 AvgAnnualAuEq Production(Moz) NPV(US$mm) Avg AuEq Production - x 1.00x 2.00x 3.00x EV/Project NPV(2) KUG KE Buritica Stibnite Frutaldel Norte Horne5 VoltaGrande EagleGold Montagne d’Or BackRiver Amulsar Ixtaca Curraghinalt Romero ReliefCanyon CerroQuema SugarZone RedMountain Source: Macquarie Capital 41
- 42. 86 66 58 55 41 38 31 20 19 7 5 25 80 10 20 30 40 50 60 70 80 90 100 0.8 0.8 0.7 0.7 0.6 0.6 0.6 0.5 0.5 0.4 0.4 0.4 0.6 0.3 0.00 0.10 0.20 0.30 0.40 0.50 0.60 0.70 0.80 0.90 Compelling Valuation Total Enterprise Value / Total Gold Resources P/NAV (Consensus) Source: CIBC Global Comps (August 28, 2017) – NAV is per ‘analyst consensus’ and resources include all categories (gold only) *Royalty value removed from numerator and denominator; ** Value of royalties treated as cash for EV calculation 42
- 43. 6. Questions & Answers 43
- 44. Endnotes Slide 4 – Overview: 1) Gold equivalent calculated on basis of $1,250/oz Au and $3.00/lb Cu 2) June 30, 2017 cash balance of US$21.2M, converted using our annual FX rate assumption of 0.75 Slide 6 – Major Shareholders: 1) Per Bloomberg, Sedi, and company filings. AMI Management & Director ownership includes RSUs received in lieu of cash bonuses Slide 7 – Producing Royalties: Reserve and resource figures and production guidance estimates based on most recent updates from asset owners 1) Reserves and resources per most recent resource updates from asset owners; Assumes annual production levels for YD, Fosterville, Hemlo, Eagle River of: 200Koz, 212Koz, 205Koz and 45Koz respectively and recoveries of 90%, 93%, 95% and 95% respectively Slide 11 - 1) Gold equivalent calculated on basis of $1,250/oz Au and $2.75/lb Cu 2) Assumes $1,250/oz Au, $3.00/lb Cu, and C$/US$ of 0.75 Slide 14 - Kemess Key Study Outputs: Gold equivalent ounces calculated on the basis of $1,250/oz Au and $2.75/lb Cu 1) Kemess South data compiled from historical year-end MD&A reports from Northgate Minerals Corporation 2) Assumes $1,250/oz Au, $3.00/lb Cu, and C$/US$ of 0.75 Slide 25 –1) Gold equivalent calculated on basis of $1,250/oz Au and $2.75/lb Cu 2) ) Consensus pricing deck assumes $1,250/oz Au, $3.00/lb Cu, and C$/US$ of 0.75 Slide 27 - Select Caving Comparables 1) Proven and Probable Reserves for New Afton and Cadia East shown as of Dec 31, 2016; Kemess and Northparkes shown as of Dec. 31, 2015 2) KUG average total cash cost in commercial production Slide 34 – Kemess East Resource Estimate as of January 13, 2017 ▪ NSR cut-off value of C$17.3/t was used to define indicated and inferred resources within a reasonable prospects for economic extraction solid ▪ NSR calculation assumed US$3.20/lb copper, US$1,275/oz gold and US$21.0/oz silver prices; and C$/US$ exchange rate of 0.76. ▪ NSR calculation assumed metallurgical recoveries of 91% copper, 72% gold and 65% silver; as well as a 22% copper grade for concentrate. Molybdenum was excluded from the NSR calculation. ▪ Details of the Sample Preparation and Quality Assurance and Quality Control are presented in AuRico Metals’ November 8, 2016 press release reporting on the results of the Company’s 2016 drill program. ▪ Resources were generated from 81 holes drilled at Kemess East in 2006, 2007, 2013, 2014, 2015 and 2016. ▪ Exploration activities at the Kemess East deposit have been conducted under the supervision of Wade Barnes, PGeo, Kemess Project Geologist, for AuRico Metals. Mr. Barnes is a “Qualified Person” as defined by NI 43-101. ▪ Mineral Resources were prepared under the supervision of Marek Nowak, SRK Consulting (Canada) Inc. Mr. Nowak is a “Qualified Person” as defined by NI 43-101. Slide 36 –1) Gold equivalent calculated on basis of $1,250/oz Au and $2.75/lb Cu