A temperie ribadenseno 2021
Antonio Gregorio Montes
The weather in Ribadeo in 2021
2.
A temperie ribadenseno 2021 // The weather in Ribadeo in 2021
D.L. LU 10-2022
Ribadeo, xaneiro de 2022 // Ribadeo, 2022 January
Á miña familia, incluída a nova. // To my family, also to the newcomer
p.2 de 48
3.
A temperie ribadenseno 2021
/
The weather in Ribadeo in 2021
Rematou 2021. Un ano máis de
datos climáticos asegurando a tendencias
cara ó futuro. Cos datos recollidos na
Granxa-Escola Pedro Murias, trázase un
esquema da temperie en Ribadeo o pasado
ano e ponse en perspectiva relacionándoo
cos anos anteriores deste século XXI,
abranguendo xa máis de dous decenios,
aínda que con lagoas nalgunhas series
recollidas.
O fin é informar sobre o pasado e
facer prospectiva cara ó futuro Así, por
exemplo, Ribadeo non ten plan de
adaptación ó cambio climático. Este
tratamento de datos pode axudar a
delinealo.
Por último nestas poucas verbas de
inicio, dicir que hai xa anos que comecei a
facer un pequeno estudo anual sobre a
temperie ribadense, ampliando ano a ano
os datos tratados ó tempo que
incrementaba cos da nova anualidade as
series de datos de cada variable. Nese
sentido, estas liñas son unha nova versión
das que publiquei o pasado ano.
2021 is over. A year more on climate
data to foresee the future. With the data
collected at the Farm-School Pedro
Murias, a diagram of the weather in
Ribadeo was drawn up last year and put
into perspective by relating it to the
previous years of this 21st century,
covering more than two decades, but with
some lack in some pack of data.
The aim is to report on the past and
look to the future. For example, Ribadeo
has no plan to adapt to climate change.
This data processing can help delineate it.
Finally, in these few opening words,
I would like to say that, years ago, I
started to do a small annual study on the
weather of Ribadeo, expanding the data
treated year by year while increasing the
data series of each variable with those of
the new annuity. In that sense, these lines
are a new version of the ones I posted last
year.
p.3 de 48
4.
1.Introdución. Que ondemiro para ver o tempo? // Introduction. Tell me,
where could I look to see the weather?
En Ribadeo contamos coa estación
meteorolóxica da Granxa-Escola Pedro
Murias, ID 10047 de MeteoGalicia, a 3,5
km en liña recta da casa do concello,
accedida para tódolos datos das variables
en https://www.meteogalicia.gal:
Latitude:
43.5407 WGS84
(EPSG:4326)
Lonxitude:
-7.08302 WGS84
(EPSG:4326)
Altitude: 51 m.
Dende o ano 1993 ata comezado o
século XXI, D.Luciano Zubillaga mantivo
en perfecto funcionamento unha estación
manual. Esta estación conviviu algún
tempo coa nova estación automática, que
non comezou a funcionar con todo o
instrumental de xeito conxunto, senón ó
longo dos primeiros anos do novo século.
Do pasado anterior, dispóñense de series
de datos incompletas de diversos períodos,
que están a medio tabular e antes de ser
estudadas. Do 1993 en diante, as series
están case completas, a excepción de
algúns días por causas varias, e coa
necesidade de casamento dos datos
manuais e automáticos no período de
transición. A máis, en Castropol (e antes
nas Figueiras, dende hai varias décadas)
está funcionando unha estación
meteorolóxica que pode complementar as
medicións de Ribadeo, e mesmo resultar
máis representativa para a vila ó estar tan
só a 1,6 km en liña recta da casa do
In Ribadeo we have the
meteorological station of A Granxa-
Escola Pedro Murias, ID 10047 of
MeteoGalicia, 3.5 km in a straight line
from the town hall, accessed for all the
data of the variables in
https://www.meteogalicia.gal:
Latitude:
43.5407 WGS84
(EPSG:4326)
Longitude:
-7.08302 WGS84
(EPSG:4326)
Height: 51 m.
From 1993 until the beginning of the
21st century, D. Luciano Zubillaga kept a
manual station in perfect working order.
This station coexisted some time with the
new automatic station, which did not
begin to work with all the instruments
together, but throughout the early years of
the new century. From the previous past,
incomplete data series from various
periods are available, yet not being
studied. From 1993 onwards, the series
was almost complete, except for several
days, and with the need for manual and
automatic data marriage in the transition
period. In addition, in Castropol (and
before, in As Figueiras, from several
decades ago) a meteorological station has
been operating and can complement the
measurements of Ribadeo, and even be
more representative for the town as it is
only 1.6 km in a straight line from the
town hall of Ribadeo, but, until now these
p.4 de 48
5.
concello ribadense, maispolo momento os
seus datos só son usados como contraste.
A estación de Pedro Murias, no
período estudado, ten dous conxuntos de
instrumentos. Un, manual, ó que
corresponden os citados datos de diversas
épocas, aínda sen analizar. Outro,
automático, que foi incorporando
instrumentos e que no que ten relación con
temperaturas, comezou a funcionar no
2001, pero que nos seus comezos non
representa un conxunto harmónico por
faltarlle abondos datos invernais ata 2003
(en presións, ata 2006), con datos
dispoñibles de xeito público na web de
MeteoGalicia. Os datos de ambos
conxuntos de instrumentos parecería que
son intercambiables, pero por cuestións
técnicas só son relativos correspondentes,
que falta por harmonizar, o que fai que
nun primeiro paso sexa preferible ter en
conta só un deses conxuntos. Por estar
accesibles en internet as series continuas
ata a actualidade, elixín xa hai anos o
conxunto de datos da estación automática.
Polo demais, os únicos que se manteñen
accesibles na web de Meteogalicia hoxe en
día.
Ó longo destas poucas páxinas que
tratan de facer énfase nas liñas xerais, sen
deixar de lado o último ano, haberá
momentos nos que saia a colación o
cambio climático. O cambio climático é un
fenómeno a nivel planetario e a longo
prazo. E aínda que poda ser indicativa a
variación nalgún dos parámetros
meteorolóxicos que se analizan, hai que ter
en conta que o que se presenta aquí son
datos correspondentes a un único lugar
moi concreto, Ribadeo, e un período
abondo máis curto que o conveniente para
estudar o cambio. Algo que en certo xeito
se deixa sentir de xeito matemático nas
gráficas nas que aparece a liña de
tendencia coa súa ecuación e o parámetro
R2
, que da a bondade do axuste da liña de
tendencia obtida en relación cos datos
subministrados: nunha escala na que un
data are only using to contrast.
Pedro Murias station, in the period
studied, has two sets of instruments. One,
manual, to which the mentioned data of
diverse times correspond, still without
analyzing. Another, automatic, which has
been incorporating instruments and in
terms of temperatures, began operating in
2001, but in its beginnings does not
represent a harmonic set for lack of
abundant winter data until 2003 (in
pressures, until 2006), with data publicly
available on the MeteoGalicia website.
The data of both instrumental sets would
seem to be interchangeable, but for
technical reasons they are only relatively
corresponding, remaining to be
harmonized, which makes it preferable in
the first step to consider only one of these
sets. Because the continuous series is
accessible on the Internet, I chose the
automatic station data set years ago.
Otherwise, the only ones that remain
accessible on the Meteogalicia website
today.
Throughout these few pages that try
to emphasize the broad outlines, not to
mention the last year, there will be times
when climate change comes up. Climate
change is a planetary and long-term
phenomenon. And although the variation
in some of the meteorological parameters
that may be analyzed may be indicative, it
must be in mind that what is presented
here are data corresponding to a single
very specific place, Ribadeo, and a much
shorter period than convenient to study
the change. Something that in a way is
mathematically felt in the graphs in which
the trend line appears with its equation
and the parameter R2
, which gives the
goodness of the fit of the trend line
obtained to the data provided: on a scale
in which an adjustment perfect is
represented by R2
= 1, and in the absence
of possible correlation by R2
= 0, the R2
s
in some of the graphs below only reach a
fraction of that amount. Still, with the
p.5 de 48
6.
axuste perfecto venrepresentado por R2
=
1, e a falta de correlación posible por R2
=
0, os R2
dalgunhas das gráficas expostas
máis abaixo só chegan a unha fracción
desa cantidade. Aínda así, co aporte de
datos ano tras ano, a confianza aumenta.
As gráficas seguen a deixar clara a
tendencia ó cambio cando a inclinación é
abonda, indicando variacións grandes,
pero non no caso de inclinacións
pequenas, variacións débiles, como é
nalgúns dos datos manexados. De calquera
xeito, en relación ó anterior, cabe notar
que a medida que se van incorporando
datos en comparación con edicións de
anos anteriores, a calidade do axuste tende
a aumentar, elevándose o valor de R2
.
A presente análise non é exhaustiva,
quedando fóra polo momento variables de
datos e fenómenos, como se pode ver se se
tenta mirar a temperatura de orballo, para
as primeiras, ou a ocorrencia de néboa,
para os segundos. E é que o traballo está
limitado pola posibilidade de uso de
recursos, tanto de datos como de medios
para o seu tratamento.
Séguese, con pequenos aumentos, as
mesmas liñas que en edicións de anos
anteriores, como os que se poden atopar,
entre outros lugares, en
http://fqribadeo.blogspot.com/2018/01/a-
temperie-ribadense-no-2017.html ,
https://fqribadeo.ribadeando.com/2019/01/
a-temperie-ribadense-no-2018.html e
https://fqribadeo.ribadeando.com/2020/12/
a-temperie-ribadense-en-2020.html .
Este traballo estará colgado na rede
en
https://fqribadeo.ribadeando.com/2021/12/
a-temperie-ribadense-en-2021.html.
crescent amount of data each new year,
the confidence increase.
The graphs continue to make clear
the tendency to change when the slope is
sufficient, indicating large variations. But
not in the case of small slopes, weak
variations, as in some of the data handled.
However, it should be noted that as data
are incorporated compared to editions of
previous years, the quality of the
adjustment tends to increase, raising the
value of R2
.
The present analysis is not
exhaustive, leaving out for the time
variables of data and phenomena, as can
be seen, if one tries to look at the dew
temperature, for the former, or the
occurrence of fog, for the latter. And it is
that the work is limited by the possibility
of use of resources, so much of data as of
means for his treatment.
It follows, with small increases, the
same lines as in editions of previous years,
as those that can be found, among other
places, in
http://fqribadeo.blogspot.com/2018/01/a-
temperie-ribadense-no-2017.html ,
https://fqribadeo.ribadeando.com/2019/01
/a-temperie-ribadense-no-2018.html and
https://fqribadeo.ribadeando.com/2020/12
/a-temperie-ribadense-en-2020.html
This work will be in internet in
https://fqribadeo.ribadeando.com/2021/12
/a-temperie-ribadense-en-2021.html.
p.6 de 48
7.
2.Un pouco desituación. Microclima ribadense. // Something previous.
Microclimate of Ribadeo.
Dise que Ribadeo ten un un
microclima. E é certo. Polo demais, como
calquera outro lugar, se ben na vila de
Ribadeo a presenza da ría e a veciñanza do
mar dan máis valor a esa afirmación.
Dentro de Galicia, a cornixa cantábrica ten
características climáticas propias, como
ben sabe calquera que teña accedido ou
marchado (en particular no verán) pola
Xesta -ou, agora, polo Fiouco-
E, dentro desa Mariña que constitúe
a costa cantábrica, a proximidade da ría e a
orografía particular do concello (rasa,
cordal, val do río Grande...) fan variar as
características climáticas, non só por
diferenza de temperatura por altura, senón
tamén pola presenza maior ou menor de
néboas, a insolación que recibe, a
cantidade de chuvia... diferenzas todas que
non se poden estudar máis que de xeito
cualitativo ó non haber máis ca unha
estación meteorolóxica no concello, a xa
citada de Pedro Murias. Varios pequenos
estudos realizados con medios artesanais
teñen observado esas diferenzas, pero non
teñen calidade equiparable como para dar
fe das mesmas, polo que as reflexións aquí
realizadas corresponderían, en puridade, ó
entorno próximo á Pedro Murias.
Microclima ademais que está a
cambiar co conxunto climático, en boa
parte, como efecto da acción humana,
como xa Humboldt descubriu que pasaba e
se ven confirmando dende entón.
E microclima que se ve afectado nos
datos recollidos pola propia situación da
estación meteorolóxica, cun cordal
montañoso ó sur que varía as condicións
en relación ó entorno máis próximo á ría,
onde se atopa a vila, ou ó interior do termo
municipal de Ribadeo, no val do río
Grande.
And, within that A Mariña that
constitutes the Cantabrian coast, the
proximity of the estuary and the particular
orography of the council (coast,
mountain’s chain, the valley of the Rio
Grande ...) vary the climatic
characteristics, not only by the difference
of temperature by height but also due to
the greater or lesser presence of fog, the
insolation it receives, the amount of
rain ... all, differences that can only be
studied qualitatively because there is only
one weather station in the municipality,
the one mentioned Pedro Murias. Several
small studies carried out with artisanal
means have observed these differences,
but they do not have comparable quality
to attest to them, so the reflections made
here would correspond, in purity, to the
environment close to Pedro Murias.
Microclimate also is changing with
the climate, in big part, as an effect of
human action, as Humboldt has
discovered that happened and have been
confirmed since then.
And also microclimate affected the
data collected by the situation of the
weather station itself, with a mountain
range to the south that varies the
conditions of the environment closest to
the estuary, where Ribadeo city is located,
or inside the geography of Ribadeo, in the
valley of the Rio Grande.
p.7 de 48
8.
3.Temperatura. // Temperature
Anotras ano, o dito ‘ate o corenta de
maio non quites o saio’ cada vez se usa
menos por ter menos ocasión de evocalo a
nivel Galicia
(https://www.meteogalicia.gal/datosred/inf
oweb/clima/informes/estacions/anuais/
2021_gl.pdf). En Ribadeo, con (táboa 3.1)
14,15 ºC de media contabilizando dende o
ano 2003 e subindo, un pouco superior á
media galega, tampouco. Cousas do
cambio climático...
Os datos de temperatura, están
collidos da serie de medicións a 1,5 m
sobre o chan.
A temperatura ultimamente soe
chamar máis a atención que outras
variables meteorolóxicas polo aumento
global dentro do cambio climático.
Repetindo o xa dito, ó facer referencia
maioritaria á temperie dun só ano, non se
poden esperar mostras de dito cambio, que
implica períodos de tempo moito máis
longos.
En 2021 non hai unha marca de
temperatura alta como a que chegou a
medir a estación meteorolóxica da Pedro
Murias de 35,44 ºC ás dúas menos dez da
tarde UTC (catro menos dez hora legal) o
día 15 de outubro de 2017, despois de ter
acadado outra marca de altas temperaturas
poucos meses antes. Nin tampouco unha
marca como a menor rexistrada pola
mesma estación automática o 16 de
decembro de 2001, de tan só -1,41 ºC ás
oito da mañá UTC. Non, este período, as
temperaturas diarias non foron tan
extremas.
It is said that Ribadeo has a
microclimate. And it is true. Moreover, like
any other place, although in the town of
Ribadeo the presence of the estuary and
the vicinity of the sea give more value to
this statement. Within Galicia, the
Cantabrian cornice has its climatic
characteristics, as anyone who has
accessed or marched (by A Xesta or, now,
O Fiouco, particularly in summer) knows.
It exists different sayings to advert
about bad weather until summer, but they
are used less each new year because we
have less opportunity to evoke it in
Galicia
(https://www.meteogalicia.gal/datosred/inf
oweb/clima/informes/estacions/anuais/
2021_gl.pdf). In Ribadeo, with (table 3.1)
14.15 ºC on average counting since 2003
and rising, slightly above the media in
Galicia, neither. Climate change rules ...
Temperature data are taken from the
series of measurements at 1.5 m above the
ground.
Temperature lately tends to draw
more attention than other meteorological
variables due to the global increase due to
climate change. Repeating what has
already been said, in making majority
reference to the weather of a single year,
no samples of this change can be
expected, which implies much longer
periods.
In 2021 there is no high-temperature
mark like the one that came to measure
the Pedro Murias weather station of 35.44
ºC around two hours in the afternoon UTC
(four minus ten, legal hour) on October
15, 2017, after having reached another
mark of high temperatures a few months
earlier. Nor a mark as the lowest recorded
by the same automatic station on
December 16, 2001, of only -1.41 ºC at
eight in the morning UTC. No, this period,
the daily temperatures were not so
extreme.
p.8 de 48
9.
3.1. Temperaturas mediasdiversas. // Average temperatures
A táboa co resume de datos
recollidos (temperatura media diaria) é a
que aparece en baixo (Táboa 3.1):
The table with the summary of data
collected (average daily temperature) is as
shown below (Table 3.1):
Táboa 3.1
Na primeira liña, aparece a media de
temperatura anual dos anos 2003-2021 (en
2021, 14,29 ºC). descártanse 2001 e 2002
pola falta de datos extensiva a longos
períodos. Non se descartan outros anos
sen datos en días illados. Máis abaixo, as
medias mensuais, considerando as
temperaturas dende o 2003 (por exemplo,
os 10,1 ºC de xaneiro corresponden á
media de temperatura de tódolos xaneiros
de 2003 a 2020, incluído). E na penúltima
liña, a media anual acumulada dende o
2003, que vemos que cada vez se move
menos dun ano a outro, como corresponde
a un dato deste tipo, aínda que ten unha
pequena tendencia á suba: a media anual
acumulada marcou un novo máximo co
remate de 2021.
In the first line, the average annual
temperature for the years 2003-2021
appears (2021: 14,29 ºC). 2001 and 2002
are ruled out due to the lack of extensive
data over long periods. Other years
without some data are not ruled out.
Below, the monthly averages, considering
temperatures since 2003 (e.g., January
10.1 ºC correspond to the average
temperature of all January 2003 to 2020,
inclusive). And in the penultimate line, the
annual average accumulated since 2003,
which we see moving less and less from
one year to another, as corresponds to a
figure of this type, although it has a small
upward trend: the average accumulated
annual has marked a new high with the
end of 2021.
3.2. Temperatura media anual. // Average temperature of the years.
Represéntase o dato dos medios de
temperaturas anuais.
Are represented the data of average
temperature yearly.
p.9 de 48
10.
Gráfica 3.2a:
Obsérvase que,dos anos
contabilizados, 2020 marcou un novo
máximo, superando ós outros períodos
anuais anteriores, mais 2021 tamén estivo
por riba da media.
En conxunto, a temperatura media
anual no período indicado marca
diferenzas de medias anuais de máis de 1
ºC en Ribadeo, entre os extremos do 2010,
o ano máis frío da serie, e o 2020, o máis
cálido.
Como se observa na gráfica seguinte
(gráfica 3.2b), a liña de tendencia indica
que a temperatura está a subir por termo
medio uns 0,1 ºC cada 3 anos, o que
proxectado sen variación nos daría 3,2 ºC
de aumento ó longo do século, en
consonancia cun dos peores escenarios
previstos polo panel do cambio climático
(PCC). Salta á vista tamén que un puñado
de anos destaca lonxe por riba da liña de
tendencia, mentres a maioría queda por
baixo, pero máis próxima a ela, conforme
co aumento previsto de episodios
extremos. En calquera caso, ambas series
separadas progresan á alza. Sempre,
We can observe that, of the period
accounted, 2020 came to mark a new
maximum, surpassing the other previous
annual periods, but 2021 has reached also
over the medium temperature.
Overall, the average annual
temperature in the indicated period marks
differences in annual averages of more
than 1 ºC in Ribadeo, between the ends of
2010, the coldest year in the series, and
2020, the warmest.
As we can see in the following graph
(graph 3.2b), the trend line indicates that
the temperature is rising on average about
0.1 ºC every 3 years, which projected
without variation would give us a 3.2 ºC
increase throughout the century, in
agreement with one of the worst-case
scenarios predicted by the climate change
panel (CCP). It is also obvious that a
handful of years stand out far above the
trend line, while most are below, but
closer to it, in close agreement with the
previewed increasing of extreme
conditions of the weather. In any case,
both separate series progress upwards.
p.10 de 48
2002 2004 2006 2008 2010 2012 2014 2016 2018 2020 2022
12,50
13,00
13,50
14,00
14,50
15,00
15,50
Medias de temperatura anuais Ribadeo
s XXI
ano
t
media
11.
considerando que debidoá distribución hai
unha variación grande na estimación (R2
=
0,23, lonxe aínda de 1 que sería a
estimación perfecta como xa se comentou,
pero con tendencia a mellorar)
Always, considering that due to the
distribution there is a big variation in the
estimate (R2
= 0.23, far from 1 which
would be the perfect estimate as already
mentioned, but with a trend to improve)
Gráfica 3.2b:
3.3. Temperatura media mensual. // Monthly average temperature
A temperatura media mensual ó
longo do século (2003 en diante) da unha
gráfica que é característica, cun máximo
en agosto (mes máis cálido), seguido de
preto por xullo, e un mínimo en febreiro
(mes máis frío), seguido de preto por
xaneiro, correspondendo con que as
temperaturas diarias máximas se rexistren
uns 45 días despois do día de S. Xoán
(representativo do solsticio de verán,
máximo de horas de luz diarias, no que se
prenden as fogueiras axudarían a manter a
luz no máximo) e as mínimas, uns 45 días
despois de Sta. Lucía (día representativo
The average monthly temperature
throughout the century (2003 onwards)
gives a characteristic graph, with a
maximum in August (warmest month),
followed closely by July, and a minimum
in February (the coldest month), followed
closely by January, corresponding to the
maximum daily temperatures being
recorded about 45 days after St. John's
Day (representative of the summer
solstice, maximum hours of light per day,
in which fires are lit to help keep the light
at maximum) and the minimums, about 45
days after Ste. Lucia (representative day of
p.11 de 48
12.
do solsticio deinverno, mínimo de horas
de luz diarias, e patroa da vista, para a que
é necesario ter luz...)
the winter solstice, minimum daily hours
of light, and patron saint of sight, for
which it is necessary to have light ...)
Gráfica 3.3a:
Hai que ter conta que os datos que
aparecen de cada mes corresponden ó
período enteiro considerado (o que vai de
século, ver táboa 3.1), na práctica o
primeiro quinto do século XXI, nun
escenario cambiante de temperaturas á
alza. A imaxe coido que é representativa
abondo, máis os datos poden ser
representados doutros xeitos non menos
indicativos.
It should be borne in mind that the
data that appear for each month
correspond to the entire period considered
(the century until now, table 3.1), in
practice the first fifth of the 21st century,
in a changing scenario of rising
temperatures. The image I think is quite
representative, plus the data can be
represented in other ways no less
indicative.
Gráfica 3.3b:
p.12 de 48
13.
Nesta última, sonrepresentados os
mesmos datos de temperatura media que
no caso anterior (gráfica 3.3a) resultando
case unha curiosa elipse simétrica
inclinada por causa deses 45 días de atraso
en relación ós eventos astronómicos que
marcan de xeito aproximado as
festividades de S. Xoán e Sta. Lucía.
A variación suave entre tempadas
ven amosada pola gráfica seguinte, onde
se compara a media diaria do que vai de
século cunha curva sinusoidal:
In the latter, the same average
temperature data are represented as in the
previous case (graph 3.3a) resulting in
almost a curious inclined symmetrical
ellipse due to those 45 days delay
concerning the astronomical events that
mark (approximately) the festivities of St.
John and Sta. Lucia.
The smooth variation between
seasons is shown by the following graph,
which compares the daily average of the
century with a sinusoidal curve:
p.13 de 48
14.
Gráfica 3.3c:
3.4. Temperaturamedia: algún detalle. // Average temperature: some detail.
Algún detalle máis sobre
temperatura: como se pode observar
abaixo (gráfica 3.4a), a media dentro do
ano 2021, a primeira quincena de xaneiro
volveu marcar mínimos no século,
recuperando unha media normal despois
dunha segunda quincena máis cálida, e
mantendo temperaturas medias o resto do
ano, cun lixeiro repunte ó final.
Some detail more on temperature: as
we can see below (Figure 3.4a), the
average within 2021, the first fortnight of
the year returned to record lows in the
century, recovering a normal average
after a warmer second fortnight, and
maintaining average temperatures for the
rest of the year, with a slight rise at the
end.
Gráfica 3.4a:
p.14 de 48
0 61 122 183 244 305 366
8
10
12
14
16
18
20
Variación media diaria ó longo do ano
Pedro Murias, s. XXI
día
T
(ºC)
15.
A última gráficade temperaturas
medias é mais complicada de entender.
Representa a evolución da temperatura
media ó longo do século, dende o comezo
do cómputo e recalculando día a día, co
que tende a subir nos veráns e a baixar nos
invernos, atenuando as variacións co paso
do tempo ó ter cada vez máis peso no
cálculo as medias anuais. Se nos fixamos
ben na parte final, vemos que o último
altibaixo queda todo, na práctica, sobre a
liña de tendencia axustada como recta,
indicando unha aceleración da suba. R2
está próximo a 0,3, o que xa é unha
aproximación abondo boa da tendencia.
The latest average temperature
graph is more difficult to understand. It
represents the evolution of the average
temperature throughout the century, from
the beginning of the calculation, and
recalculating day by day, which tends to
rise in summer and fall in winter,
attenuating variations passing the time by
having more and more weight in the
calculation of annual averages. If we look
closely at the end, we see that the last
sinusoidal variation is all, in practice, on
the trend line adjusted as a straight line,
indicating an acceleration of the rise. R2
is
close to 0.3, which is already a pretty
good approximation of the trend.
p.15 de 48
0 60 120 180 240 300 360
0
2
4
6
8
10
12
14
16
18
temperatura promedio sobre dias anteriores do ano
Pedro Murias sXXI 2021 2001
2002 2003
2004 2005
2006 2007
2008 2009
2010 2011
2012 2013
2014 2015
2016 2017
2018 2019
2020
día do ano
T
(ºC)
16.
Gráfica 3.4b:
3.5. Temperaturasmáxima e mínima. // Maximum and minimum temperatures.
A evolución das temperaturas
extremas ás veces deixa unha
visualización máis clara da evolución xeral
de temperaturas, aínda que non teña por
que corresponder en cada ano individual
coa evolución da media. Como a media
móvese arredor dos 14 ºC, collendo como
referencia +/- 11 ºC, resulta un rango no
que se ven movendo que é sobrepasado só
uns cantos días ó ano e que sirve ó efecto
de destacar o extremos.
No axuste para o número de días de
temperaturas altas (gráfica 3.5a) resulta
unha media de un día máis con
temperaturas superiores a 25º cada cinco
anos. Se collemos temperaturas máis
extremas, 30 ºC (isto é, 16 º C sobre a
media) aínda non hai variación abonda
para ter unha consideración precisa, pero é
evidente tamén que cada vez vai habendo
máis anos que sobrepasan esa temperatura
The evolution of extreme
temperatures sometimes leaves a clearer
view of the general evolution of
temperatures, although it does not have to
correspond to each year with the evolution
of the average. As the average moves
around 14 ºC, taking as reference +/- 11
ºC, it is a range in which they are moving
that is exceeded only a few days a year
and that serves the purpose of highlighting
the extremes.
The adjustment for the number of
days of high temperatures (Figure 3.5a)
results in an average of one more day with
temperatures above 25º every five years. If
we take more extreme temperatures, 30 ºC
(i.e., 16 º C above average) there is still
not enough variation to have an accurate
consideration, but it is also evident that
there are more and more years that exceed
that temperature at some point. It is also
p.16 de 48
01/01/02 01/01/05 01/01/08 01/01/11 01/01/14 01/01/17 01/01/20
13,000
13,200
13,400
13,600
13,800
14,000
14,200
14,400
Media secular de temperatura
Ribadeo, s. XXI
data final
ºC
temp
media
acumulada
17.
nalgún momento. Asemade,nótase que o
2021, ó igual que 2020, non foi de
temperaturas extremas, como se apuntou
antes:
noted that 2021, the same as 2020, was
not one of the extreme temperatures, as
noted earlier:
Gráfica 3.5a:
O dito antes é algo que ten
correspondencia no que pasa coas
mínimas:
The above said is something that has
a correspondence in what happens with
the minimums:
Gráfica 3.5b:
p.17 de 48
18.
Neste caso, odescenso é máis
pronunciado, e de cara a próximos anos
haberá necesidade de cambiar a
temperatura de referencia para cómputo
dos días que é pasada cara abaixo, pois a
tendencia indica que cada ano hai case un
día menos de temperaturas inferiores a 3
ºC1
, de xeito que, de seguir, esta gráfica en
poucos anos non será significativa en
termos estatísticos. O anterior, dito aínda
que este ano o número de días superou o
mínimo posible significativo acadado o
ano pasado, 1. A ter en conta que non pode
seguir baixando sen comezar a presentar
datos nesgados por ese motivo, non pode
baixar de 0 días con temperaturas de
menos de 3 ºC. En canto a gráfica de
máximas, o número de días con
temperatura superior a 25 ºC tenderá a
seguir aumentado, pero cada vez o
aumento será menos significativo.
Deixo abaixo a gráfica comparativa
de días de mínimas con outra temperatura
(3 ºC e 6 ºC, mesma táboa de datos que
acompañaba á anterior) para resaltar o
dito, con algo a destacar: de 2015 a 2019,
In this case, the decline is more
pronounced, and in the coming years will
need to change the reference temperature
for counting the days that are passed
down, as the trend indicates that every
year there is almost a day less with
temperatures below 3 ºC2
, so that, if
followed, this graph in a few years will not
be statistically significant. This year the
number of days has not reached the
minimum possible significant, 1, as
succeeds with 2020. But can not continue
to go down without starting to present
biased data for that reason, can not go
down from 0 days with temperatures
below 3 ºC. As for the maximum graph,
the number of days with a temperature
above 25 ºC will tend to continue to
increase, but each time the increase will
be less significant.
I leave under this paragraph the
graph of comparison over the days with
two different temperatures to the minimum
(3 ºC and 6 ºC), to facilitate the
interpretation of said, with something to
note: from 2015 to 2019, if the
1 O ano 2002 non aparece por non ter datos do inverno.
2 Year 2002 is out because a lack of data for winter.
p.18 de 48
19.
se o termómetrobaixou de 6 ºC, tamén
baixou de 3 ºC.
E unha curiosidade: O número de
días da primeira semana do ano, en
diversos anos, nos que a temperatura
baixou de 3º C nalgún momento. E, contra
o que poidera parecer, hai uha certa
tendencia ás temperaturas extremas, tamén
negativas...
thermometer dropped from 6 ºC, it also
dropped from 3 ºC.
Also a curiosity: The number of days
in the first week of the year, in several
years, in which the temperature dropped
under 3º C at some time. And, contrary to
what may seem, there is a certain
tendency to extreme temperatures, also
negative ...
Gráfica 3.5c:
Gráfica 3.5d:
p.19 de 48
2000
2001
2002
2003
2004
2005
2006
2007
2008
2009
2010
2011
2012
2013
2014
2015
2016
2017
2018
2019
2020
2021
2022
0
10
20
30
40
50
60
70
80
f(x) = − 2,59 x + 5242,37
R² = 0,45
f(x) = − 0,84 x + 1691,16
R² = 0,47
Nº días con t<6ºC
s XXI
ano
nº
días
20.
3.6. Temperatura: enresume. // Temperature: main summary.
Hai unha tendencia ó quecemento,
manifestada tamén en consecuencias
prácticas, feitos como a aparición de
bolboretas 'caveira' na zona, ou a
extensión rápida de diversas pragas. Algo
que acompañaría a unha tendencia global
que ademais parece estar acelerándose,
aínda que as liñas de tendencia
correspondentes ás diversas gráficas non
foron aproximadas a dita aceleración
(están axustadas a relacións polinómicas
con potencias de x maior ca 1).
There is a tendency to warm up, also
manifested in practical consequences,
facts such as the appearance of 'skull'
butterflies in the area, or the rapid spread
of various pests. Something that would
accompany a global trend that also seems
to be accelerating, although the trend
lines corresponding to the various graphs
were not made corresponding to that
acceleration (they are adjusted for
polynomial relations with powers of x
greater than 1).
p.20 de 48
21.
4.Chuvia. Se chove,que chova! // Rain. As we say, ‘If it’s raining, it rains!’
Se chove, que chova... ó fin, nunca
choveu que non escampara. O uso do
segundo dito segue a ser certo, pero no do
primeiro parece que hai que comezar a
medirse, pois semella aparecer unha
tendencia a chuvias torrenciais, que poden
causar estragos.
Para Galicia, Ribadeo, cunha media
anual de 978,6 L/m2
, é máis ben seco,
comparado coas marcas no que vai de
século de Lousame (3393 L/m2
) e
Monforte (366 L/m2
). Dito o anterior, a
estación meteorolóxica está situada nunha
zona do concello con poucas
precipitacións, como pode verse en mapas
de pluviometría a nivel Galicia ou inferior,
acadando probablemente nalgunhas zonas
do concello a media galega.
Continuando coa recollida de datos
da estación meteorolóxica da Pedro
Murias, atopámonos con que a serie fiable
de chuvia ten asemade unha lonxitude
menor do conxunto total de datos
recollidos, abranguendo igual que no caso
de temperaturas, dende o 2003. Aínda así,
neste caso, con datos incompletos de 2001
e 2002, ditos anos están incluídos nas
gráficas seguintes como algo indicativo.
If it’s raining, it rains... and, it never
rained that it didn’t scatter. The use of the
second saying is still true, but in the first,
it seems that we need to start measuring
because there seems to be a trend in
torrential rains, which can wreak havoc.
For Galicia, Ribadeo, with an
annual average of 978.6 L / m2
, tend to
dry, compared to the century-old brands of
Lousame (3393 L / m2
) and Monforte (366
L / m2
). That said, the weather station is
located in an area of the municipality with
little rainfall, as can be seen in rainfall
maps in Galicia or more detailed ones,
probably reaching in some areas of the
municipality the Galician average.
Continuing with the collection of
data from the Pedro Murias weather
station, we find that the reliable rain
series also has a shorter length of the total
set of data collected, covering the same as
in the case of temperatures, since 2003.
Still, in this case, with incomplete data
from 2001 and 2002, these years are
included in the following graphs as
indicative.
4.1. Chuvia media. // Average rain.
Táboa 4.1:
Na primeira liña baixo os anos,
aparece o total choiva caída cada ano do
2001 ó 2021 (L/m2
, a ter en conta que os
datos de 2001 e 2002, como está dito,
teñen datos incompletos, co que o total
para eses anos sería maior). Na ringleira
In the first line under the years,
appears the total rainfall every year from
2001 to 2021 (L/m2
, taking into account
that the data for 2001 and 2002, as
mentioned, don’t have all data, so the total
for those years would be major). In the
p.21 de 48
22.
baixo os meses,aparece a media diaria de
litros por cada metro cadrado, caída ó
longo do mes correspondente. A media
anual, 986,1 L/m2
, queda por baixo da
media galega (cousa de un 25 % menos,
segundo MeteoGalicia:
https://www.meteogalicia.gal/datosred/inf
oweb/clima/informes/estacions/anuais/
2021_gl.pdf).
row under the months, appears the daily
average of litres for each square meter,
dropped over the corresponding month.
The annual average, 986.1 L/m2
, is below
the Galician average (about -25 %, with
data of MeteoGalicia:
https://www.meteogalicia.gal/datosred/inf
oweb/clima/informes/estacions/anuais/
2021_gl.pdf).
4.2. Chuvia media anual. // Average rain per year.
Gráfica 4.2a:
Represéntase na gráfica anterior o
dato da choiva acumulada ó longo do ano
2021 (Gráfica 4.2a), en escala de días e
sinalados cada algo menos de dous meses
(50 días). Ista representación da media de
choiva acumulada ó longo dun ano para un
día dado é unha gráfica que sorprende ó
facela pola súa limpeza. Vese que a
cantidade de choiva caída vaise
incrementando loxicamente, pero
distínguense tempos de máis precipitación
The graph above shows the rainfall
accumulated over the year 2021 (Graph
4.2a), on a scale of days and indicated for
set of 50 days. This representation of the
average rainfall accumulated over a year
for a given day is a surprising graph when
done for its cleanliness. We can see that
the amount of rain that falls is logically
increasing, but there are times of more
precipitation and times of less. In general,
we can say that this year was 15 % upper
p.22 de 48
0 50 100 150 200 250 300 350 400
0
200
400
600
800
1000
1200
Chuvia acumulada 2021
día
L/m2
23.
e tempos demenos. En termos xerais,
podemos dicir que este ano resultou un 15
% por riba da media de 986,1 L/m2
(en
2021, 1137 L/m2
). O réxime de chuvia que
segue o patrón anual, con chuvias
distribuídas ó longo do ano, mais a
primeira parte foi un episodio pródigo en
chuvia, se se compara coa media,
comparación representada na gráfica
seguinte (4.2b). Tamén podemos observar
os aumentos bruscos que representan
episodios de chuvia intensa:
average (986,1 L / m2
on average, 1137 L /
m2
in 2021), and with a rainfall regime
that follows the annual pattern, with rains
distributed throughout the year, but the
first part was an episode of overraining,
compared to the average, as represented
in the following graph (4.2b). We can also
see the sharp increases that represent
episodes of heavy rain:
Gráfica 4.2b:
Gráfica 4.2c:
p.23 de 48
0 50 100 150 200 250 300 350 400
0
200
400
600
800
1000
1200
Chuvia acumulada 2021 (azul)
comparada coa media secular (vermello)
día
L/m2
24.
O gráfico anterior,correspondente á
choiva que se foi acumulando durante
cada ano (para unha mellor visualización,
a medida que transcorre o século, o grosor
dos trazos aumenta), da idea clara do dito
máis arriba sobre o 2021, amosando que
en xaneiro / febreiro foi un ano moi
húmido.
En canto á relación con outros anos,
a gráfica seguinte (4.2d, na que se
descartaron 2001 e 2002 pola falta de
datos de tempadas enteiras) amosa unha
tendencia lixeira a aumentar a
precipitación anual (+3,5 L/m2
/ano), pero
totalmente enmascarada polo baixo
coeficiente R2
.
The graph above, corresponding to
the rain accumulated during each year (to
favour the interpretation, as the century
passes, the thickness of the strokes
increases), of a clear idea of what was
said above about 2021, showing that
January / February were months with a lot
of rain.
As for the relationship with other
years, the following graph (4.2d, in which
2001 and 2002 were discarded due to the
lack of data for entire seasons) shows a
slight tendency to increase annual
precipitation (+3,5 L/m2
/year) but is
masked by the low coefficient R2
.
p.24 de 48
0 50 100 150 200 250 300 350 400
0
200
400
600
800
1000
1200
1400
Chuvia acumulada durante o ano
2021 2020
2019 2018
2017 2016
2015 2014
2013 2012
2011 2010
2009 2008
2007 2006
2005 2004
2003 2002
2001
días transcorridos
L/m2
25.
Gráfica 4.2d:
4.3. Chuviamedia mensual. // Average monthly rain.
A chuvia que se foi acumulando ó
longo do ano queda representada xa nas
gráficas anteriores. Un resume mensual
para o que vai de século represéntase nas
dúas gráficas seguintes (gráficas 4.3a e
4.3b).
A primeira, máis clásica, mediante
barras de diferentes alturas indica que os
meses máis chuviosos están unha vez
comezado o outono e no inverno, e os
máis secos, na segunda parte do verán e
comezos do outono. A continuidade de
ascensos e descensos é en xeral suave,
excepto no caso de decembro, un mes de
chuvia media en medio de outros dous que
son os máis chuviosos, e, de xeito lixeiro,
setembro.
The rain accumulated throughout
the year is already represented in the
previous graphs. A monthly summary for
the entire century is represented in the
following two graphs (Graphs 4.3a and
4.3b).
The first one, ‘classical’, using bars
of different heights indicates that the
rainiest months are once autumn and
winter have begun, and the driest, in the
second part of summer and early autumn.
The continuity of ascents and descents is
generally smooth, except in the case of
December -a month of average rain in the
middle of two others which are the
rainiest-, and, slightly, September.
p.25 de 48
2002 2004 2006 2008 2010 2012 2014 2016 2018 2020 2022
0
200
400
600
800
1000
1200
1400
f(x) = 3,47 x − 5990,36
R² = 0,01
Caída anual de chuvia en Ribadeo
ano
L/m2
26.
Gráfica 4.3a:
A segundagráfica representa os
mesmos datos, mais tentando semellar a
case elipse do caso xa visto das
temperaturas. Vese que os eixes neste caso
están desprazados case 90º en relación ó
que amosa a gráfica de temperaturas
(gráfica 3.3b), e a figura resulta moito
menos harmónica, coa maior anomalía en
decembro, e o arco entre outubro e abril
copando máis dos dous terzos da chuvia
caída.
The second graph represents the
same data but tries to look like the almost
ellipse of the case already seen of
temperatures. It is seen that the axes in
this case, are displaced almost 90º about
what the temperature graph shows (graph
3.3b), and the figure is much less
harmonic, with the largest anomaly in
December, and the arc between October
and April covering more than two-thirds
of the rain falling.
p.26 de 48
xan feb mar abr mai xun xul ago set ou nov dec
0,0
1,0
2,0
3,0
4,0
5,0
6,0
Chuvia diaria media (por meses no século)
meses
L/m2
27.
Gráfica 4.3b:
4.4. Distribuciónda chuvia. // Raining distribution.
Considerando a caída de auga
dezminutal da Pedro Murias durante o
decenio pasado (case medio millón de
datos), chégase á conclusión de que en
Ribadeo non hai horas preferentes para a
chuvia, como se pode ver na seguinte
gráfica (4.4a).
Considering the water drop each ten
minutes of Pedro Murias during the last
decade (almost half a million data), we
can conclude that in Ribadeo there are no
preferential hours for rain, as can be seen
in the following graph, (4.4a).
Gráfica 4.4a:
p.27 de 48
xan
feb
mar
abr
mai
xun
xul
ago
set
ou
nov
dec
0,0
2,0
4,0
6,0
Chuvia diaria media (por meses)
meses
L/m2
28.
Por outra banda,aínda que a
sensación é de que as chuvias tenden a ser
máis torrenciais, resulta difícil concretalo
numericamente. Así, como se ve nas
gráficas seguintes, o número de días que
en 2021 choveu por riba 25 L/m2
(unhas
dez veces a media diaria) superou anos
anteriores, pero máis ben tende a baixar no
tempo, se ben a chuvia caída neses
momentos diminúe, pero de xeito máis
suave, indicando precipitacións máis
cuantiosas.
On the other hand, although the
feeling is that the rains tend to be more
torrential, it is difficult to concretize it
numerically. Thus, as can be seen in the
following graphs, the number of days that
in 2021 it rained above 25 L/m2
(about ten
times the daily average) did exceed
previous years, but rather tends to fall,
although the rain fell at that time
decreases, but more gently, indicating
more abundant rainfall.
Gráfica 4.4b:
p.28 de 48
0 1 2 3 4 5 6 7 8 9 10 11 12 13 14 15 16 17 18 19 20 21 22 23 24
0,000
0,500
1,000
1,500
2,000
2,500
3,000
chuvia dezminutal acumulada ó longo do día
Ribadeo, século 21
hora
L/m2
29.
Gráfica 4.4c:
4.5. Unhacuriosidade. // A curiosity.
Se se fan contas, mirando o consumo
de auga da vila de Ribadeo, uns mil
trescentos millóns (1 300 000 000) de
litros, e redondeamos a auga caída a 1000
If we take into account the water
consumption of the town of Ribadeo,
about one thousand three hundred million
(1,300,000,000) litres, and round the
p.29 de 48
2002 2004 2006 2008 2010 2012 2014 2016 2018 2020 2022
0
2
4
6
8
10
12
14
f(x) = − 0,01 x + 20,22
R² = 0
Número de días con máis de 25 L de chuvia
ano
días
2002 2004 2006 2008 2010 2012 2014 2016 2018 2020 2022
0
5
10
15
20
25
30
35
40
45
50
L chuvia caída en días con > 25 L (media diaria)
ano
L
30.
L/m2
, (lixeiramente porbaixo da media)
dan as contas que o consumo de Ribadeo
(extensión do concello, 104 km2
) é
equivalente á auga caída sobre 1,3 km2
, do
seu territorio. É dicir, se se puidera
aproveitar ó 100 % da precipitación, a
auga caída sobre o que ven ocupando a
vila de Ribadeo, ou, doutro xeito, un 1,3 %
da auga caída no concello:
water falling to 1000 L/m2
, (slightly below
average), so the consumption of Ribadeo
(extension of the municipality, 104 km2
) is
equivalent to the water falling on 1.3 km2
,
of its territory. That is equivalent to say if
it was possible to take advantage of 100%
of the precipitation, the fallen water over
the town of Ribadeo, or, in another way,
1.3% of the fallen water in the
municipality:
Imaxe 4.5 (obtida do SIXPAC / obtained from the SIXPAC)
p.30 de 48
31.
5.Vento. O ventoestá tolo! // Wind. Wind is mad!
O nordés, vento predominante en
Ribadeo de compoñente NE (xunto co
vendaval, de compoñente SO), lévase
asociado moito tempo cunha certa tolemia.
Agora hai máis razón para a asociación,
pero non tanto coa tolemia humana de
xeito directo, canto co aumento do vento
por algo inducido pola nosa mala cabeza:
o cambio climático. Algo que está
convertendo os furacáns nas ‘novas
tormentas’, aínda que tamén haxa unha
compoñente de magnificación por
asignación dun nome con máis gancho.
Os datos do vento son os tomados a
10 m de altura.
The northeast, predominant wind in
Ribadeo of NE component (along with the
vendaval, of SO component), has long
been associated with a certain madness.
Now there is more reason for the
association, but not so much with human
madness directly, as with the rising wind
for something induced by our bad head:
climate change. Something that is turning
hurricanes into ‘new storms’, although
there is also a magnification component
by assigning a more hooked name.
Wind data are taken at 10 m height.
5.1. Vento medio. // Average wind.
O ano foi o que máis vento
acumulou do século, nunha clara tendencia
ó aumento.
Deixo a táboa xeral (en dúas
unidades, km/h e m/s) xa que as unidade
usual en meteoroloxía, non coinciden coa
recomendada no S.I.
The year was the windiest in the
century, in a clear upward trend.
I leave here the general table (in two
units, km/h and m/s) as the usual units in
meteorology do not match the one
recommended in the I.S. of units.
Táboa 5.1a: media diaria de vento (km/h)
Táboa 5.1b: media diaria de vento (m/s)
A distribución do vento no ano
seguiu o patrón normal, quizais de xeito
Wind distribution in the year
followed the normal pattern, maybe less
p.31 de 48
32.
menos nidio quenoutros anos. A primeira
parte, que abranguería na práctica o
inverno, con abonda pendente, indicando
máis cantidade de vento; a segunda,
primavera e verán, máis horizontal (menos
vento); e a terceira, o outono e comezo do
novo inverno, e que sería o tramo máis
irregular dos tres, con máis inclinación
cara ó final (Gráfica 5.1a).
A segunda gráfica presenta ese
mesmo patrón en comparación cos outros
anos do século (Gráfica 5.1b).
clearly than in other years. The
corresponding line seems to be distributed
in three straight lines with only slightly
different inclinations: the first, which
would cover winter, with more slope,
indicating more wind; the second, spring
and summer, more horizontal (less wind);
and the third, the autumn and beginning of
the new winter, and which would be the
most irregular stretch of the three, with
more inclination towards the end (Graph
5.1a).
The next graph presents the same
data, comparing 2021 and the complete
set of years of the XXI century (Graph
5.1b).
Gráfica 5.1a:
Gráfica 5.1b:
p.32 de 48
0 50 100 150 200 250 300 350 400
0
20000
40000
60000
80000
100000
120000
Vento acumulado durante o ano pasado
(km recorridos)
días transcorridos
km
33.
En canto adistribución do vento por
semanas, no século, pode observarse o
comentado antes: inverno e outono teñen
ventos de media ata un 50% máis rápidos
que o verán.
As for the distribution of wind by
weeks, in the century, we can see: winter
and autumn have winds on average up to
50% faster than summer.
Gráfica 5.1c:
p.33 de 48
0 50 100 150 200 250 300 350 400
0
20000
40000
60000
80000
100000
120000
Vento acumulado durante o ano
(km recorridos)
2021 2020
2019 2018
2017 2016
2015 2014
2013 2012
2011 2010
2009 2008
2007 2006
2005 2004
2003 2002
2001
días transcorridos
km
34.
O que seconfirma asemade coa
distribución mensual, de variacións
sempre máis suaves e limitadas (Gráfica
5.1d).
That is also confirmed by the
monthly distribution, ever with softer and
limited variations (Graph 5.1d).
Gráfica 5.1d:
p.34 de 48
0 2 4 6 8 10 12 14 16 18 20 22 24 26 28 30 32 34 36 38 40 42 44 46 48 50 52
0
2
4
6
8
10
12
14
16
Vento por semanas
(km/h, media no século)
semana do ano
km/h
xan feb mar abr mai xun xul ago set ou nov dec
0,0
2,0
4,0
6,0
8,0
10,0
12,0
14,0
16,0
vento medio (por meses)
Ribadeo século XXI
meses
km/h
35.
O mesmo patrónvisual obsérvase
tamén na representación circular a
continuación, na que se ve unha forma
equivalente á de temperaturas ou de
choiva, mais cun desfase esta vez de case
180º (Gráfica 5.1e).
The same visual pattern is also
observed in the circular representation
below. So, we can see a shape equivalent
to that of temperatures or rain, but with a
lag of almost 180º (Graph 5.1e).
Gráfica 5.1e:
5.2. Tendencia vento. // Wind trend.
A representación da velocidade
media do vento no ano ó longo do século
(gráfica 5.2) apunta a variación
relativamente limitadas con tendencia a
aumentar (segundo o axuste, máis dun 10
% no período considerado): a experiencia
de vento forte é máis frecuente estes
últimos anos. Aínda así, o baixo
coeficiente R2
non permite asegurar este
aumento correlativo co paso do tempo.
The representation of the average
wind speed each year over the century
(Figure 5.2) points to the relatively limited
variation with a tendency to increase
(according to the adjustment, plus than
10% in the period considered): the strong
wind experiences are more frequent in
recent years. Still, the low coefficient R2
does not ensure this correlative increase
over time.
p.35 de 48
xan
feb
mar
abr
mai
xun
xul
ago
set
ou
nov
dec
0,0
5,0
10,0
15,0
Vento diario medio (por meses)
Ribadeo, s. XXI (km/h)
meses
km/h
36.
Polo demais, Ribadeonon é un sitio
no que se rexistren marcas de velocidade
do vento, e mesmo dentro dunha zona
costeira como a Mariña, ten zonas calmas,
aínda que non tanto como nas zonas
interiores de Galicia.
Moreover, Ribadeo is not a place
where wind speed marks are recorded, and
even within a coastal area such as tA
Mariña, has calm places, although not as
much as in the inland Galicia.
Gráfica 5.2:
5.3. Dirección do vento. // Wind direction.
A Táboa 5.3 presenta os datos
relacionados coa dirección do vento no
século, e de xeito independente, en 2021.
Obsérvanse algunas variacións e
tendencias.
Table 5.3 presents data related to
wind direction in the century, and
independently, in 2021. Some variations
and trends are observed.
Táboa 5.3:
p.36 de 48
2000
2001
2002
2003
2004
2005
2006
2007
2008
2009
2010
2011
2012
2013
2014
2015
2016
2017
2018
2019
2020
2021
2022
0,00
0,50
1,00
1,50
2,00
2,50
3,00
3,50
f(x) = 0,02 x − 31,53
R² = 0,19
Velocidade media do vento
Ribadeo, s.XXI (m/s)
ano
m/s
37.
Gráficas 5.3a e5.3b:
No 2021 a dirección do vento seguiu
as pautas históricas, aínda que máis
definidas que a media, como se pode
comprobar nas Gráficas 5.3a e 5.3b. Nas
táboas obsérvase que os datos de S/SO
máis NE/E suman, a nivel dos datos
fiables recollidos na Pedro Murias, 74,8 %
dos días no caso de acumulación no
século, ou sexa 3 de cada 4, mentres
chegan a 81,3 % no caso de 2021 (máis de
4 de cada 5). É dicir, incrementouse a
preponderancia dos ventos nordés e
vendaval.
Algunha consideración máis:
- O posicionamento da estación
meteorolóxica de Pedro Murias, cunha
pequena cadea montañosa un pouco ó sur,
fai moi posible que, de non existir dita
In 2021 the wind direction followed
the historical guidelines, although more
defined than the average, as can be seen
in Graphs 5.3a and 5.3b. The tables show
that the S / SW data, plus NE / E add up,
at the level of reliable data collected in
Pedro Murias, 74.8 % of the days of the
century (or 3 out of 4), while reaching
81,3 % in the case of 2021 (more than 4
out of 5). That is, the predominance of
northerly and gale-force winds has
increased.
Some more considerations:
- The positioning of the Pedro
Murias weather station, with a small
mountain range a little to the south, makes
it very possible that, if there is no such
chain, if there is a more open space in a
p.37 de 48
1
2
3
4
5
6
7
8
0
15
30
Dirección do vento. % de días en cada
dirección
Ribadeo, 2021
orientación (º)
nº
días
1
2
3
4
5
6
7
8
0
15
30
Dirección do vento. % de días en
cada dirección
Ribadeo, século XXI
orientación (º)
nº
días
38.
cadea, de existirun espazo máis aberto en
dirección sur como ocorre coa vila de
Ribadeo, as porcentaxes poideran variar
lixeiramente, ampliando a compoñente N-
S nas gráficas.
- A suma de ventos de compoñente
sur da o 45,3 % dos días a nivel século,
mentres que acada o 50,5 % no 2021. Pero
os ventos de compoñente sur son cálidos,
correspondendo co aumento da
temperatura observada. Asemade, son
ventos con aire que se enfría ó subir en
latitude, polo que traen chuvia. Dita
variación hai que contrastala co
quecemento climático, co aumento de
temperatura do aire e baixa de humidade
relativa consecuente para a mesma
cantidade de auga. No caso de ventos de
compoñente norte, son 34,5 % a nivel
século, e só o 33,5 % a nivel 2021. Pero os
ventos de compoñente norte son fríos...
- Quedaría por comprobar se os
ventos encadean máis días -ou tempadas
enteiras- seguidos tendendo a converterse
nun sistema de alisios, correspondendo co
agrupamento de chuvia caída en menos
días.
southerly direction as with the town of
Ribadeo, the percentages may vary
slightly, enlarging the NS component in
the graphs.
- The sum of southerly winds of 45.3
% of the days at the century level, while it
reaches 50.5 % in 2021. But the southerly
winds are warm, corresponding to the
increase in temperature observed. In
addition, they are winds with air that
cools when they rise in latitude, so they
bring rain. This variation must be
contrasted with global warming, with the
increase in air temperature and the
consequent drop in relative humidity for
the same amount of water. In the case of
northerly winds, they are 34.5 % at the
century, and only 33.5 % at the level of
2021. But the northerly winds are cold ...
- It remains to be seen whether the
winds chain more days - or entire seasons
- in a row tending to become a trade wind
system, corresponding to the grouping of
rainfall in fewer days.
p.38 de 48
39.
6.Presión reducida. Estáun día pesado? // Reduced pressure. Is a heavy
day?
A presión é unha magnitude que non
se esquece nas informacións
meteorolóxicas pola súa importancia na
formación da temperie, mais que non é
sentida por nós como a temperatura, a
chuvia ou o vento. Aínda así, somos
capaces de avaliar diferenzas ó ascender
ou descender unha montaña ó ir nun
coche, pois 'estálannos os oídos'. Mais dita
falta de sensibilidade nosa non significa
moito, pois as súas variacións fan posibles
os ventos ou a condensación de nubes para
formar néboa, sendo un indicador
fundamental na meteoroloxía, razón pola
que non é esquecida na difusión de datos
meteorolóxicos.
Unha nota de atención: como a
presión da atmosfera varía coa altura, para
poder facer comparacións de presión dun
xeito homoxéneo, emprégase a chamada
presión reducida, que sería a equivalente a
nivel do mar da presión que se está a
medir a altura que sexa. É a recollida nas
gráficas.
A Pedro Murias ten entre os anos
2001 e 2006 grandes lagoas neste dato
(comezou as medidas de presión a
comezos de 2000), normalizándose a
situación a partir do 7 de abril do 2006.
Por iso presento unha gráfica (Gráfica 6a),
coa serie completa, outra (Gráfica 6b) coa
serie a partir do 2007, e unha terceira
(Gráfica 6c), que representa a media de
presión do ano anterior ó día
correspondente, cos datos a partir de 2007.
As dúas primeiras dan unha idea
parella. Pode observarse que a presión
sube cada ano ó longo do outono a medida
que ven o frío e o aire se volve máis denso
por esta razón (pesando máis un mesmo
volume e exercendo máis presión), o que
na primeira gráfica enturba a liña de
tendencia. Pero en ambas nótase que
Pressure is a quantity that is not
forgotten in meteorological information
because of its importance in the formation
of the weather, but which is not felt by us
as temperature, rain or wind. Still, we can
assess differences when ascending or
descending a mountain when going in a
car, because 'our ears are ringing'. But
this lack of sensitivity of us does not mean
much, as its variations make it possible for
winds or cloud condensation to form fog,
being a key indicator in meteorology,
which is why it is not forgotten in the
dissemination of meteorological data.
A note: as the pressure of the
atmosphere varies with altitude, to make
pressure comparisons homogeneously, the
so-called reduced pressure is used, which
would be the equivalent at sea level of the
pressure being measured at a determined
height. It is collected in the graphs.
Pedro Murias has large gaps in this
data between 2001 and 2006 (he began
the pressure measures at the beginning of
2000), normalizing the situation from
April 7, 2006. Therefore I present a graph
(Graph 6a), with the series complete,
another (Graph 6b), from 2007, and
another (Graph 6c) which represents the
average pressure of the year before the
corresponding day, with data from 2007.
6a and 6b give a similar idea. It can
be seen that the pressure rises every year
throughout the autumn as they see the cold
and the air becomes denser for this reason
(weighing more the same volume and
exerting more pressure), which in the first
graph blurs the trend line. But in both, it is
noticeable that they tend to increase the
pressure very slightly (something like 1
hPa every 15 years in the graph of annual
averages, more reliable than the other as
said before, but so close to 0 that
p.39 de 48
40.
tenden de xeitomoi lixeiro ó aumento de
presión (algo así como 1 hPa cada 15 anos
na gráfica de medias anuais, máis fiable ca
outra polo dito antes, pero aínda así, moi
próximo a 0, o que fai aparecer nulo o
coeficiente da x), aínda que de novo teña
escasa significación como dato só dun
puñado de anos dunha única estación. En
relación a isto, engadir que altas presións
relativas correspóndense con ‘bo tempo’
relativo, estando dito aumento en
correspondencia co ‘bo tempo’ que suporía
o aumento das temperaturas.
Nas gráficas, a pesar da tendencia,
atopamos moita dispersión de datos, o que
fai que o parámetro que nos dá a 'bondade'
da liña de tendencia, R2
, teña un valor
pequeno, indicando asemade a pouca
fiabilidade desa indicación. Nas gráficas,
de xeito consecuente co xa dito, nótase un
incremento da presión ó longo do tempo,
sempre tendo en conta o pequeno aumento
do que estamos a falar: en algo máis de
5000 días, 15 anos, o aumento observado é
de 1 hPa, unha milésima da presión media.
Mais iso non significa que o aumento,
xunto cos outros datos meteorolóxicos
observados, en particular, temperaturas,
chuvias e vento, non sexa preocupante.
coefficient of x in trend line is represented
as ‘0’), although again it has little
significance as data only a little set of
years of a single station. About this, add
that relatively high pressures correspond
to relative ‘good weather’, this increase
being in correspondence with the ‘good
weather’ which would mean the increase
in temperatures.
In the graphs, despite the trend, we
find a lot of data scattering, so the
parameter that gives us the 'goodness' of
the trend line, R2
, has a small value, also
indicating the unreliability of that
indication. In the graphs, in line with what
has already been said, there is an increase
in pressure over time, always taking into
account the small increase of what we are
talking about: in just over 5000 days, 15
years, the observed increase is 1 hPa, one-
thousandth of the average pressure. But
this does not mean that the increase,
together with other meteorological data
observed, in particular temperatures,
rainfall and wind, is not worrying.
Gráfica 6a:
p.40 de 48
41.
Gráfica 6b:
Gráfica 6c:
p.41de 48
0 1000 2000 3000 4000 5000 6000 7000 8000 9000
980
990
1000
1010
1020
1030
1040
1050
f(x) = 0 x + 1017,58
R² = 0,01
Presión reducida
Pedro Murias, s. XXI
días do século
hPa
0 365 730 1095 1460 1825 2190 2555 2920 3285 3650 4015 4380 4745 5110 5475
980
990
1000
1010
1020
1030
1040
1050
f(x) = 0 x + 1018,26
R² = 0
Presión reducida
Pedro Murias, comezo 2007-
días
hPa
42.
p.42 de 48
01000 2000 3000 4000 5000 6000
1017
1017,5
1018
1018,5
1019
1019,5
f(x) = 0 x + 1017,98
R² = 0,64
Presión reducida media ano anterior
1/1/2007-
días a partir do 1/1/2007
presión
(hPa)
43.
7.Tendencia. Un mundoen cambio. // Trend. A changing world.
Cando as barbas/
do teu veciño/
vexas cortar/
pon as túas/
a remollar.
Non é Ribadeo un lugar no que o
cambio climático se deixe sentir de xeito
especial. Por iso temos unha avantaxe, o
poder adaptarnos guiándonos polos
resultados dos demais. Pero para iso, hai
que mirar, pensar, e actuar.
A máis da temperatura, choiva,
vento ou presión, poden recollerse moitos
outros datos meteorolóxicos para dar unha
idea máis completa do tempo que pode
facer en Ribadeo, ou mesmo sinxelamente,
para comparar con outros tempos e
lugares.
Mais, coas medidas xa recollidas
para as gráficas publicadas con
anterioridade, cunha análise máis
detallada, poden obterse datos
interesantes, sen cansar demasiado. Así
pasa por exemplo, cos 14,15 ºC de media
que Ribadeo ten no ano (dato recollido na
primeira parte, e subindo cada ano) ou as
temperaturas medias de meses que poden
resultar máis interesantes de primeiras,
como xullo (18,7 ºC) ou agosto (19,2 ºC),
ou para promocionar outras datas, como
setembro (17,7 ºC), datos que non é doado
atopar nas guías turísticas de Ribadeo, e
que pola súa bonanza, coido que sería
unha avantaxe que figuraran.
A tendencia de temperaturas á alza
está clara (acompañada doutras menos
claras como presión ou vento), e máis
visible pola representación dos días de
cada ano que Ribadeo rexistrou nalgún
momento temperaturas por riba de 25 ºC
ou por baixo de 3 ºC. Ambos falan dunha
tendencia que se nota no adianto da
primavera ou na floración dalgunhas
Ribadeo is not a place where climate
change could be felt specially. So we have
an advantage, the ability to adapt guided
by the results of others. But for that, we
need to look, think, and act.
In addition to temperature, rain,
wind or pressure, many other weather
data can be collected to give a more
complete idea of Ribadeo’s weather, or
even simply, to compare with other times
and places.
But, with the measurements already
collected for the graphs published
previously, with more detailed analysis,
interesting data can be obtained, without
getting too tired. This is the case, for
example, with the average 14.15 ºC that
Ribadeo has in the year (data collected in
the first part, and rising each year) or the
average temperatures of months that may
be more interesting than the first, such as
July (18.7 ºC ) or August (19.2 ºC), or to
promote other dates, such as September
(17.7 ºC), data that is not easy to find in
the tourist guides of Ribadeo, and that by
its goodness I think it would be an
advantage to consider.
The upward trend in temperatures is
clear (accompanied by less clear ones
such as pressure or wind), and more
visible by the representation of the days of
each year that Ribadeo recorded at some
point temperatures above 25 ºC or below
3 ºC. Both speak of a trend that is noticed
in the advance of spring or the flowering
of some trees twice a year, with the
corresponding vital stress, exhaustion and
weakness of the specimen. This is an
p.43 de 48
44.
árbores dúas vecesnun ano, co
correspondente tensamento vital,
esgotamento e debilidade do exemplar.
Trátase dun aumento cada vez máis
patente das temperaturas observadas en
anos consecutivos, traducido en que por
termo medio cada sete anos aumenta un
día o número de rexistros diarios con
temperaturas de máis de 25 ºC. Máis
rechamante é aínda a diminución do
número de rexistros diarios con
temperaturas por baixo de 3 ºC, a razón
dunha media de un día de caída ó ano.
Unha tendencia que se está a incrementar,
se se ten en conta que os dous primeiros
anos do século están entre os tres con
menor número de días con algunha medida
de temperatura superior a 25 ºC.
Caso diferente é o da chuvia ou o do
vento, que se ben parecen aumentar,
podería ser só un efecto derivado do baixo
R2
que ambas tendencias obteñen.
Cos poucos datos tomados, aínda
que esteamos a falar sempre como mínimo
de varios milleiros para calquera das
variables estudadas, non se pode falar máis
que dunha tendencia. Pero é unha
tendencia que está en liña co antano tan
discutido cambio climático a nivel
mundial e á súa orixe nas actividades
humanas.
increasingly obvious increase in
temperatures observed in consecutive
years, which means that on average every
seven years the number of daily records
increases in one the temperatures of more
than 25 ºC. Even more striking is the
decrease in the number of daily records
with temperatures below 3 ºC, at the rate
of an average of one day of fall per year. A
trend that is increasing, if we take into
account that the first two years of the
century are among the three with the
fewest days with some temperature
measurement above 25 ºC.
A different case is that of rain or
wind, which although they seem to
increase, could be just an effect derived
from the low R2 that both trends get.
With the few data taken, although we
are always talking about at least several
thousand for any of the variables studied,
we can only talk about a trend. But it is a
trend that is in line with the long-
discussed global climate change and its
origin in human activities.
p.44 de 48
45.
8.Referencias. // References.
Otraballo compleméntase, aproveita
e nalgún caso mesmo corrixe detalles do
xa publicado en Ribadeando
(http://ribadeando.blogspot.com.es/search/
label/Meteorolox%C3%ADa) e Física e
Química en Ribadeo
(http://fqribadeo.blogspot.com.es/search/la
bel/Meteorolox%C3%Ada). En calquera
caso, usa datos tratados en follas de
cálculo con información da Estación
Meteorolóxica de Meteogalicia sita en
Pedro Murias, no termo municipal de
Ribadeo
(http://www.meteogalicia.gal/observacion/
estacions/estacions.action?
request_locale=gl), tamén usados nos dous
blogs citados.
Libre Office foi o programa usado
para cálculos, representacións e escritura.
‘Os tempos e o clima de Galicia’,
avv, Ed. Xerais, 2019, foi usado para
algúns datos complementarios.
Asemade, cabe referenciar o traballo
escolar ‘Hai sesenta anos e hoxe: o clima
en Ribadeo (1951/59-2009/17)’, a
disposición en
http://fqribadeo.ribadeando.com/2018/05/h
ai-sesenta-anos-e-hoxe-o-clima-en_8.html,
usado para algunha cita.
O mapa de Ribadeo está tratado
sobre unha imaxe do SIGPAC
(http://sigpac.magrama.es/fega/h5visor/)
This work is complemented with,
takes advantage of and in some cases even
corrects details of what has already been
published in Ribadeando
(http://ribadeando.blogspot.com.es/search
/label/Meteorolox%C3%ADa) and Física
e Química en Ribadeo
(http://fqribadeo.blogspot.com.es/search/l
abel/Meteorolox%C3%Ada). In any case,
are used data processed in spreadsheets
with information from the Meteogalicia
Meteorological Station located in Pedro
Murias, in the municipality of Ribadeo
(http://www.meteogalicia.gal/observacion/
estacions/estacions.action?
request_locale=gl), also used in the two
blogs cited.
Libre Office was the program used
for calculations, representations, and
writing.
‘Os tempos e o clima de Galicia’
(The times and climate of Galicia), Ed.
Xerais, 2019, was used for some
additional data.
In addition, it is worth mentioning
the school work 'Hai sesenta anos e hoxe:
o clima en Ribadeo’ (Sixty years ago and
today: the climate in Ribadeo 1951 / 59 -
2009 / 17)', available at
http://fqribadeo.ribadeando.com/2018/05/h
ai-sesenta-anos-e-hoxe-o-clima-en_8.html,
used for some appointment.
The map of Ribadeo is treated on an
image of the SIGPAC
(http://sigpac.magrama.es/fega/h5visor/)
Ribadeo, xaneiro de 2022 // 2022 January
Antonio Gregorio Montes
p.45 de 48
46.
9.Índices // Index
Índicede apartados
1.Introdución. Que onde miro para ver o tempo? // Introduction. Tell me, where could I look to see
the weather?..........................................................................................................................................4
2.Un pouco de situación. Microclima ribadense. // Something previous. Microclimate of Ribadeo...7
3.Temperatura. // Temperature..............................................................................................................8
3.1. Temperaturas medias diversas. // Average temperatures..........................................................8
3.2. Temperatura media anual. // Average temperature of the years................................................9
3.3. Temperatura media mensual. // Monthly average temperature...............................................11
3.4. Temperatura media: algún detalle. // Average temperature: some detail................................14
3.5. Temperaturas máxima e mínima. // Maximum and minimum temperatures..........................16
3.6. Temperatura: en resume. // Temperature: main summary.......................................................20
4.Chuvia. Se chove, que chova! // Rain. As we say, ‘If it’s raining, it rains!’....................................21
4.1. Chuvia media. // Average rain.................................................................................................21
4.2. Chuvia media anual. // Average rain per year.........................................................................22
4.3. Chuvia media mensual. // Average monthly rain....................................................................25
4.4. Distribución da chuvia. // Raining distribution.......................................................................27
4.5. Unha curiosidade. // A curiosity..............................................................................................29
5.Vento. O vento está tolo! // Wind. Wind is mad!.............................................................................31
5.1. Vento medio. // Average wind.................................................................................................31
5.2. Tendencia vento. // Wind trend...............................................................................................35
5.3. Dirección do vento. // Wind direction.....................................................................................36
6.Presión reducida. Está un día pesado? // Reduced pressure. Is a heavy day?.................................39
7.Tendencia. Un mundo en cambio. // Trend. A changing world.......................................................43
8.Referencias. // References...............................................................................................................45
9.Índices // Index................................................................................................................................46
Outros índices (as referencias iniciais coinciden coa sección) // Other indexes (initial references
match section):
- Índice de Táboas // Tables
3.1.-Temperaturas. Medias. // Temperature. Averages.
4.1.-Chuvia media // Average rain
5.1a.-Vento (km/h) // Wind (km/h)
5.1b.-Vento (m/s) // Wind (m/s)
5.3.-Dirección do vento // Wind direction
- Índice de Gráficas // Graphs
3.2a.-Media de temperaturas anuais. // Average yearly temperatures.
3.2b.-Variación das temperaturas medias anuais. // Variation of average yearly temperatures.
3.3a.-Temperatura media mensual (barras) // Average monthly temperature (bars)
p.46 de 48
47.
3.3b.-Temperatura media mensual(radios) // Average monthly temperature (radius)
3.3c.-Variación media diaria (de temperaturas) ó longo do ano // Dayly average temperature
variation in the year.
3.4a.-Temperatura media sobre días anteriores do ano // Average temperature over days passed in
the year.
3.4b.-Temperatura media no que vai transcorrido do século // Average temperature over days
passed in the century
3.5a.-Días con máxima > 25 ºC // Days that maximal temperature > 25 ºC
3.5b.-Días con mínima < 3 ºC // Days that minimal temperature < 3 ºC
3.5c.-Días con mínima < 6 ºC // Days that minimal temperature < 6 ºC
3.5d.-Días de xaneiro con menos de 3 ºC // Days in January with temperature below 3 ºC
4.2a.-Chuvia acumulada 2020 // Accumulated rain 2020
4.2b.-Chuvia acumulada. Comparación coa media no século en función dos días transcorridos no
ano // Accumulated rain . Comparison among average in the century and the number of days
passed of the year.
4.2c.-Chuvia acumulada durante o ano // Accumulated rain in the year
4.2d.-Caída anual de chuvia en Ribadeo // Yearly rainfall in Ribadeo
4.3a.-Chuvia diaria media por meses no século (barras) // Average monthly rain in the century
(bars)
4.3b.-Chuvia diaria media por meses no século (radios) // Average monthly rain in the century
(radius)
4.4a.- Chuvia dezminutal acumulada // Accumulated rain in the journey (ten to ten minutes)
4.4b.- Días con >25 L de chuvia // Number of days with more than 25 L rainfall
4.4c.- Chuvia caída en días con >25 L // 2020 rainfall in days with more 25 L
5.1a.-Vento acumulado durante o ano // Accumulated wind in the year
5.1b.-Vento acumulado durante o ano. Comparación // Accumulated wind in the year. Comparison
5.1c.-Vento por semanas no século // Wind each week (century)
5.1d.-Vento por meses no século // Wind each month (century)
5.1e.-Vento diario por meses no século // Dayly wind (month by month, century)
5.2-Velocidade media do vento (m/s, século) // Average wind velocity (m/s, century)
6a.-Presión reducida // Reduced pressure
6b.-Presión reducida media ano anterior // Average reduced pressure a year before
5.3a.-Dirección do vento. Ano. // Wind direction. Year
5.3b.-Dirección do vento. Século. // Wind direction. Century
- Índice de Imaxes // Images
4.5.-Plano comparativo de Ribadeo // Comparative map of Ribadeo
p.47 de 48


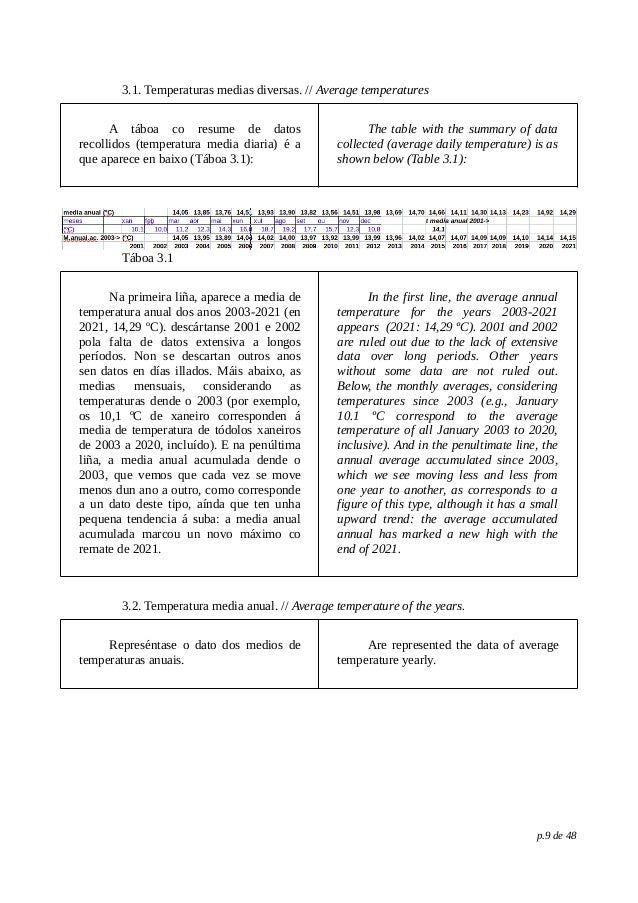


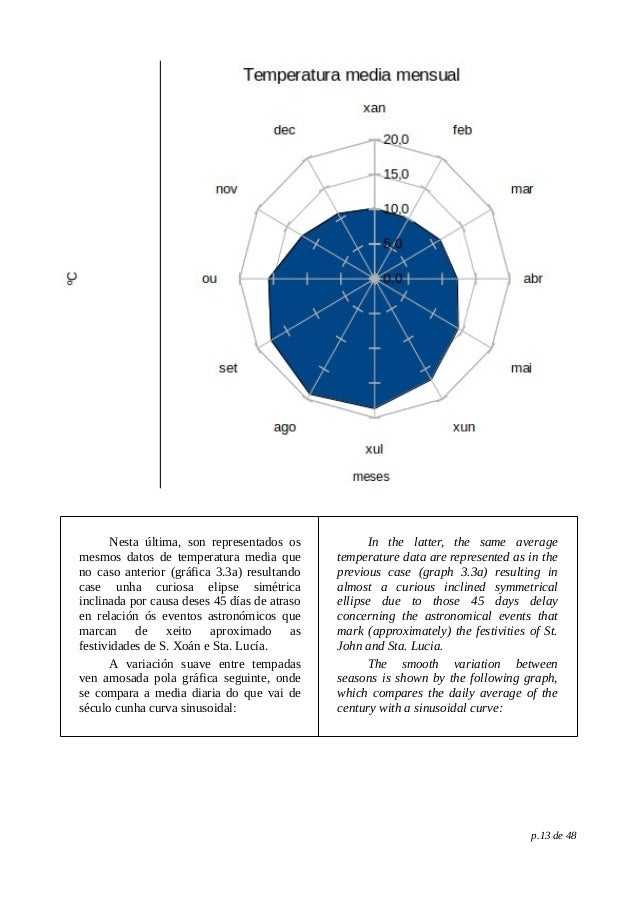
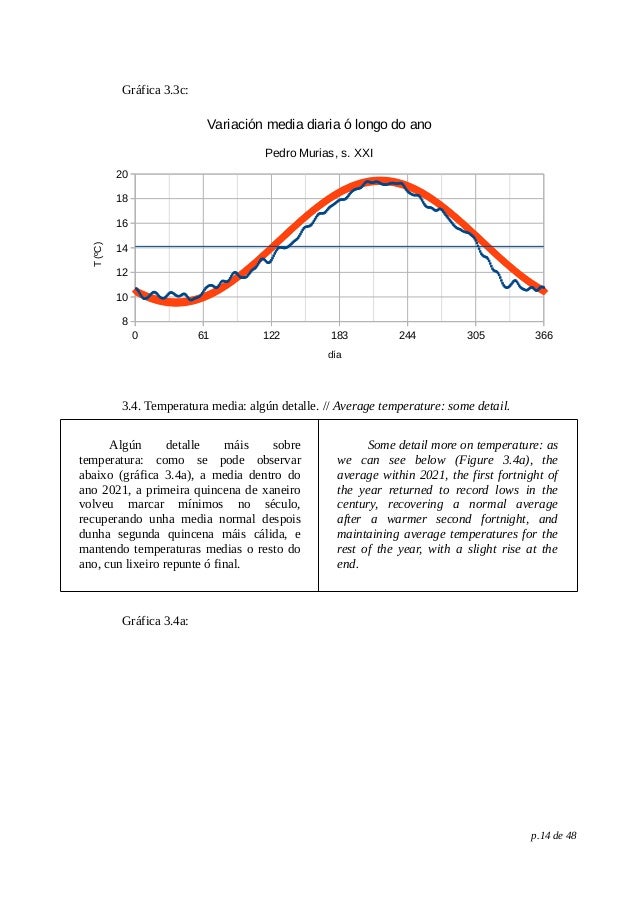


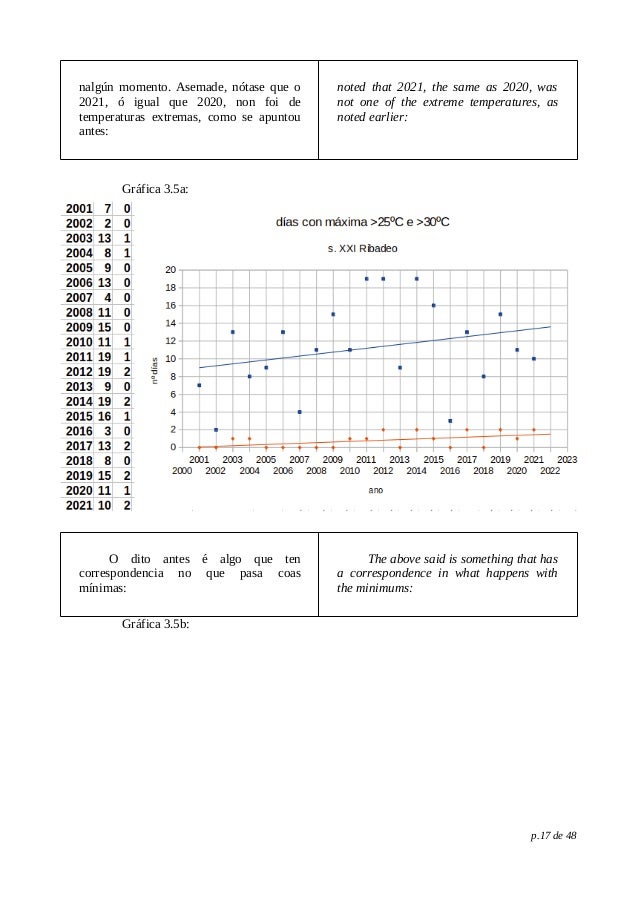


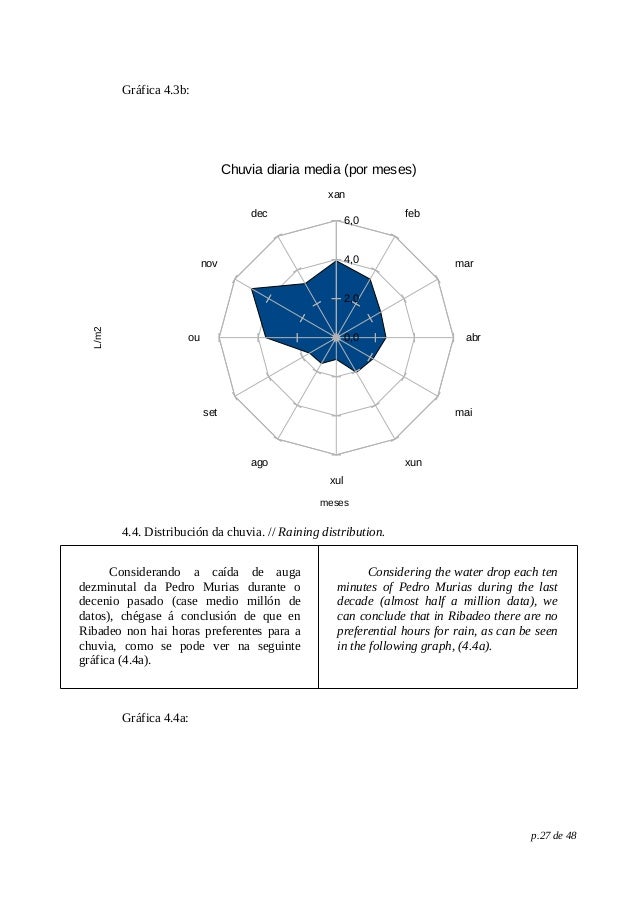
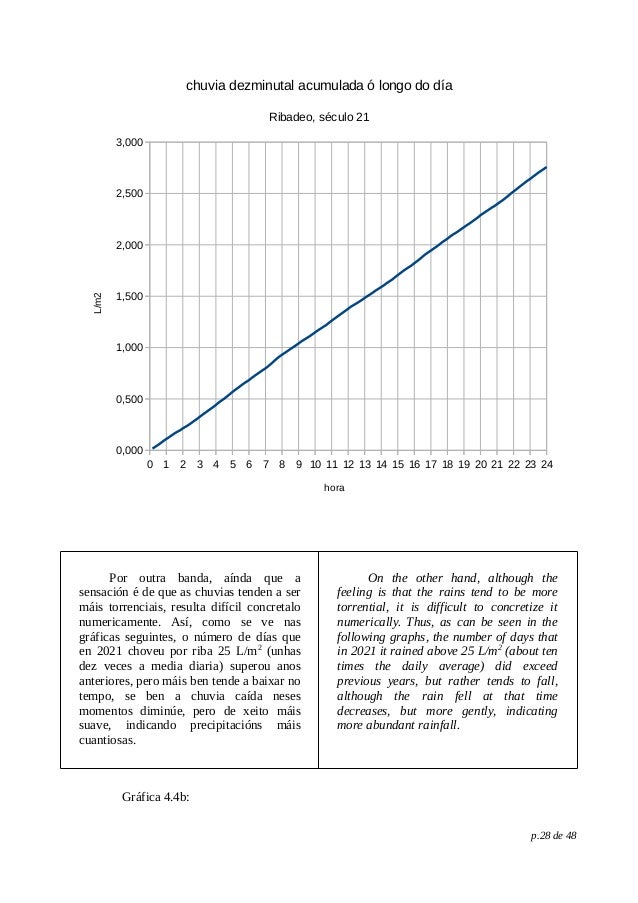

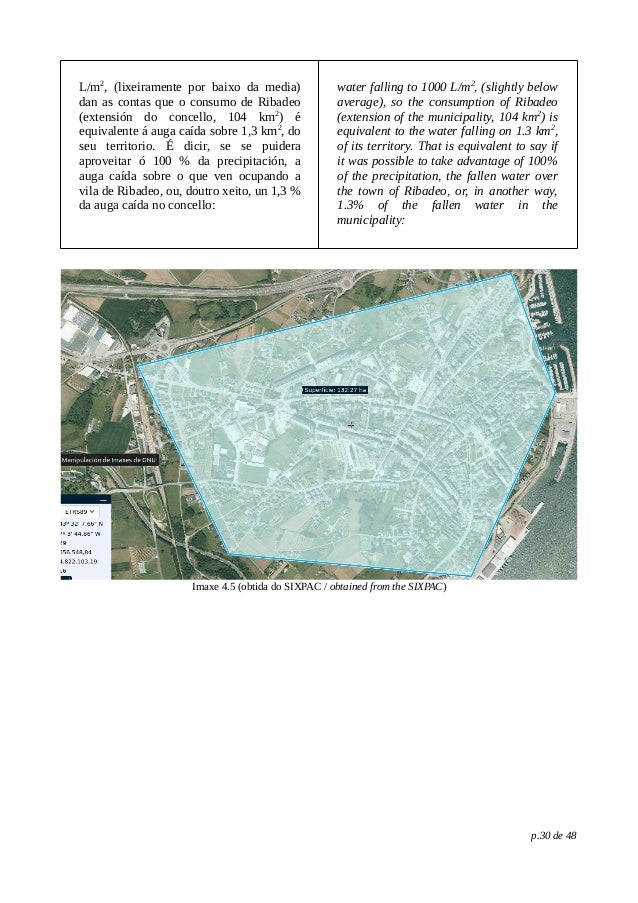


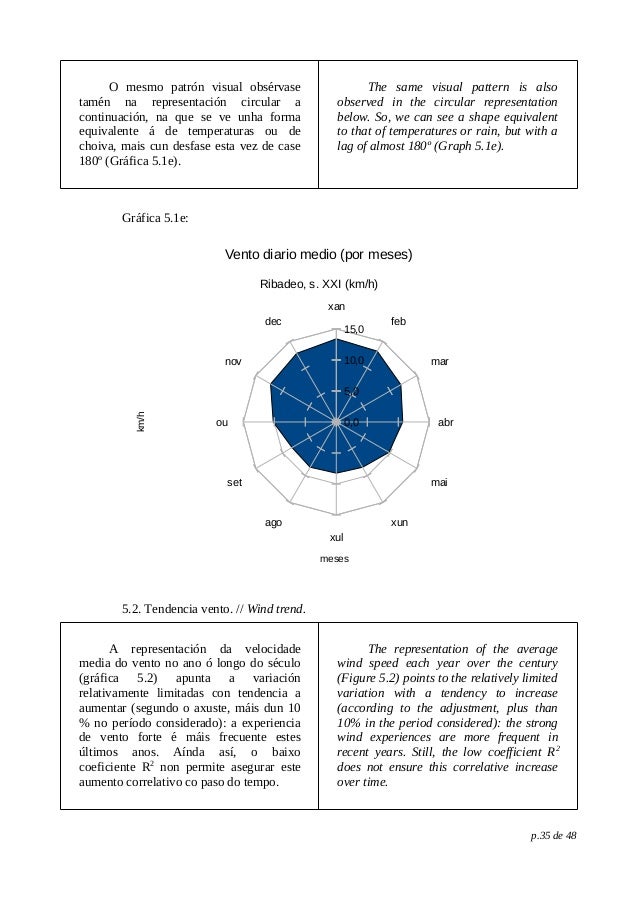

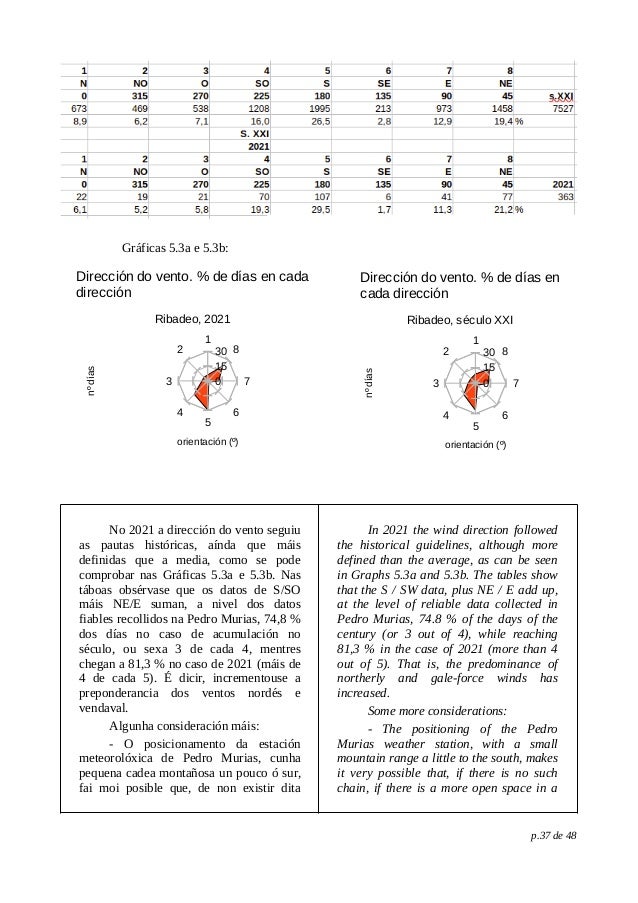


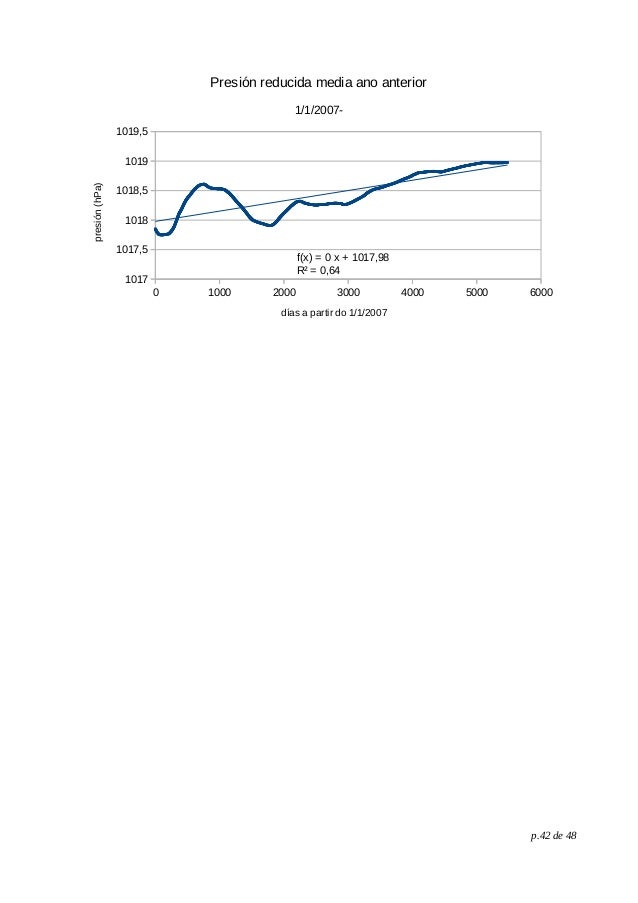


![Acceso a servizos dixitales [Ribadeo 5.12.2025].pdf](https://cdn.slidesharecdn.com/ss_thumbnails/accesoaservizosdixitalesribadeo5-251210194357-ff2ff770-thumbnail.jpg?width=640&height=640&fit=bounds)


