Call Girls In Yusuf Sarai Women Seeking Men 9654467111
Performance analysis of banks in india
1. European Journal of Business and Management www.iiste.org
ISSN 2222-1905 (Paper) ISSN 2222-2839 (Online)
Vol 4, No.3, 2012
Performance Analysis of Banks in India - Pre and Post World
Trade Organization (General Agreement on Trade in Services)
V K Gupta 1* Monika Aggarwal2
1. Professor, Indian Institute of Management, Indore, India
2. Assistant Professor, Government P. G. College, Panchkula, India
* E-mail of the corresponding author: vkgupta@iimidr.ac.in
Abstract
Under World Trade Organization (WTO), the opening of the Indian banking sector fully to the foreign
players will pose a keen competition for the banks in India. Under Commercial presence (Mode 3) of
General Agreement on Trade in Services (GATS), foreign banks with branch presence were allowed
Foreign Direct Investment (FDI) in private sector banks in 2005. These developments have a tremendous
impact on overall functioning of Indian banks and enhancement of competition . The objective of the study
was to assign ranks to different bank groups on the basis of their overall performance scores. The study
concludes that although foreign banks and new private sector banks (modern) were significantly better
than the public sector banks and old private banks (traditional)but the traditional banks had improved
their performance post WTO. This study will hopefully claim the attention of our policy makers, bankers,
corporate executives and other interested parties.
Keywords: GATS, WTO, Indian banking sector, Productivity, Profitability, Efficiency, Composite Index,
Intergroup variation
1. Introduction
Banking all over the world during the last decade witnessed changes, which perhaps it did not see during
the entire history. The changes are witnessed in both, developed and developing countries. It is mainly due
to liberalization of economies and globalization of world markets, especially, because of increasing
interdependence of developed and developing countries. Financial deregulation has led to competitive
banking practices in most emerging economies. India is no exception, and as an emerging market, is
becoming a competitive and important market, not only for financial products but also for other products. A
basic indicator of financial development of an economy is the contribution of finance-related activities to
Gross Domestic Product (GDP). The share of real GDP originating from finance-related activities in India
tripled from just around 2 per cent during the 1970’s to around 6 per cent during the 1990’s and further to 7
per cent during the first half of previous decade. Within the services sector, the share of finance rose from
less than 5 per cent to more than 13 per cent over the same period (Reserve Bank of India Bulletin).
The Indian banking system has undergone significant structural transformation since the 1990s. Prior to
1991, India’s economy and financial system was heavily regulated and dominated by the public sector, as a
result, the banking sector in India has become less competitive, as reflected in the low profitability, large
non-performing assets, low capital base, and low operational efficiency. Since 1991, the Government of
India, to increase the efficiency, productivity and viability of Indian banks, has undertaken numerous
reforms. The reforms which have greatly changed the face of Indian banking are: de-regulation of interest
rates, reduction in Statutory Liquidity ratio (SLR), reduction in Cash reserve ratio (CRR), reforms on
capital adequacy, setting-up of new private and foreign banks, prudential accounting standards, branch
licensing liberalized etc. In fact the policy makers have recognized that inefficiency is an important factor
contributing to the cost of banking services in India. Recommendation on entry of additional foreign banks
was made by Committee on the Financial System (CFS) so as to improve the competitive efficiency and to
upgrade banking technology. But these recommendations were not accepted until April 1994, when the
government agreed to allow for an expansion of foreign banks under the WTO’s General Agreement on
8
2. European Journal of Business and Management www.iiste.org
ISSN 2222-1905 (Paper) ISSN 2222-2839 (Online)
Vol 4, No.3, 2012
Trade in Services (GATS).1
Under the WTO regime, India has to open its banking sector to foreign competition, because India had
signed the General Agreement on Trade in services relating to financial services. The liberalisation
measures adopted during the beginning of 90s attempted to reduce entry barriers by withdrawing the earlier
license –permit regime. Measures have also been adopted to gradually lift restrictions on foreign banks,
while certain limits on foreign competition will remain until 2009.
There were number of new entrants in the banking business. During the period of 1990-2001, 33 new banks
arrived among which 24 are of foreign origin. Most of the foreign banks arrived during the later period i.e.
1995 onwards (Reserve Bank of India Occasional papers, volume 24, 2003). These steps have enhanced the
competitive framework for banking. Initially, under GATS India committed to allow 5 additional branches
to both new and existing foreign banks. Subsequently, in a supplementary agreement signed in July 1995,
this limit of 5 was increased to 8 branches and further to 12 in February 1998. However, India has gone
beyond the WTO’s commitment of 12 branches and has now allowed 20 branches in revised offer in 2005.
Further, in consultation with Government of India, the Road map for the presence of Foreign Banks in India
divided into two phases was unveiled in February 2005 by Reserve Bank of India (RBI), due to the
commitments made at WTO.
Road map has two phases for implementation (as shown in table 1). These are as follows:
• Phase I – March 2005 to March 2009 and
• Phase II – Review on April 2009 and onwards.
The road map included successive relaxation to start wholly owned subsidiaries, relaxed branch expansion,
acquisition in private sector banks up to 74 percent, relaxation in the priority sector’s composition,
repatriation of profits, capital requirements, etc. These developments have a tremendous impact on
overall functioning of foreign banks and enhancement of competition. Under Commercial presence (Mode
3) of GATS foreign banks with branch presence were allowed FDI in private sector banks. With
liberalization of the FDI regime, FDI in banking sector was brought under automatic route. In many old and
new private banks, the non-residents of India hold equity such as in ICICI Bank Ltd., the non-residents
share is 72 percent. All these measures have resulted in fierce competition to the public sector banks, as the
new private sector banks having majority equity shareholding of Foreign Institutional investors are fully
computerized and equipped with latest technology and professionals. The underlying factor was the
availability of sufficient capital for appropriate operations. Most of foreign banks, however, had begun
operations before India’s first nationalization of private banks in April 1969, and only seven new branches
had opened since 1990. The number of foreign banks in India increased from 24 in 1990 to 41 during
2000; although their number consequently declined to 29 in 2007 on account of merger between the Indian
branches of foreign banks, merger of banks at a global level and closure of some foreign banks. In the years
preceding the signing of the GATS agreement (1995), very few licenses for new foreign bank branches
were granted, and the presence of foreign banks in India was limited.
In order to study the performance banking sector pre and post GATS period, the assessment of efficiency
and productivity of banking, in the global environment thus assumes great importance. Moreover,
efficiency or productivity measures could act as leading indicators for evolving strengths and weaknesses
of the banking system. Efficiency and productivity analysis is of great relevance because if banks become
better functioning entities, as the domestic and international competition intensifies, this increases the
reliability and security of banking system in India and ultimately led to increase in rate of economic growth.
The objectives of present study are:
a. To develop a composite index of performance of different bank groups operating in India on the basis
of overall performance scores.
1
. Freedom of entry into the financial system should be liberalised and the Reserve Bank should now permit the
establishment of new banks in the private sector, provided they conform to the minimum start up capital and other
requirements and the set of prudential norms with regard to accounting, provisioning and other aspects of
operations, (Government of India, 1991, p.72).
9
3. European Journal of Business and Management www.iiste.org
ISSN 2222-1905 (Paper) ISSN 2222-2839 (Online)
Vol 4, No.3, 2012
b. To analyze the gap between efficient and inefficient bank groups.
c. To suggest measures to improve the performance of bank groups due to the implications of GATS.
2. Literature Review
As banking is a pivot around which economic development of a nation depends. A number of studies were
conducted to compare different types of banks operating in India based on different performance/efficiency
criteria/ parameters from time to time. Few of them have investigated empirically the effects of foreign
bank entry on the efficiency of the financial sector.
Borner, Brunetti and Weder (1996); World Bank (1997a) explained that the opportunities arising from using
financial services trade liberalization as a pre-commitment device for complementary reform in these
areas have been less well publicized. Pre-commitment to simultaneous financial services trade liberalization,
and macroeconomic and regulatory reform can help bring about the benefits from more trade as well as
from more financial and macroeconomic stability. In fact, credible policy pre-commitments to good and
stable policy making are now considered key in explaining rapid growth and development.
Buch (1997) asserts that foreign-owned banks use modern technology and rely on the human capital of
their parent banks, so that they would be expected to perform better than government-owned or domestic
private banks in transitional economies. On similar lines, private banks would be expected to perform better
than government-owned banks. Claessens et al. (2001) investigated performance differences between
domestic and foreign banks in eighty countries, both developed and developing, from late-1990’s to mid
2000’s and found that foreign bank entry was generally followed by a reduction in both profitability and the
overhead expenses of domestic banks, suggesting that foreign participation improves the efficiency of
domestic banking. Foreign bank entry may also lower risk through improved risk management techniques
and more realistic provisioning against bad loans. As those techniques become more deeply rooted in the
local banking culture (and perhaps as the quality of supervisory oversight improves), the stability of the
local financial system should improve.
Uhomoibhi toni Aburime (2008) This paper has extensively reviewed the pros and cons of foreign bank
penetration. The pros, as identified by the review, include better resource allocation, higher competition and
efficiency, lower probability of financial crisis, enhanced public confidence in the banking sector, enhanced
access to international capital, and development of bank supervisory and legal framework. On the other
hand, the cons of foreign bank penetration include loss of domestic banks’ market share, instability of the
domestic deposit base, credit rationing to small firms, loss of domestic banks’ profitability, foreign
domination and control of the banking system, volatility of domestic financial markets, and worsening of
the domestic financial system’s ability to respond to large internal and external shocks. Bank regulatory
authorities, especially in developing countries, should put these pros and cons into consideration when
deciding whether to relax or tighten restrictions on foreign bank penetration into their respective banking
systems. This will help them to simultaneously maximize the pros and minimize the cons.
Sarkar et al (1998) compared public, private and foreign banks in India to find the effect of ownership type
on different efficiency measures by using regression analysis. Rammohan (2002, 2003) also used financial
measures for comparing operational performance of different categories of banks in the post liberalization
period. However, most of the studies, which look at the efficiency of Indian commercial banks, concentrate
on cost, profit, and income or revenue efficiencies, using DEA as a technique of analysis. Rammohan and
Ray (2004) compared the revenue maximizing efficiency of public, private and foreign banks in India
during 1999-2000, using physical quantities of inputs and outputs in the 1990’s, using deposits and
operating costs as inputs, and loans, investments and other income as outputs. They found that public sector
banks were significantly better than private sector banks on revenue maximization efficiency, but between
public sector banks and foreign banks the difference in efficiency was not significant. Kumbhakar and
Sarkar (2004) estimated the efficiency of public and private banks using stochastic frontier production
model with data from 1986- 2000. They found that cost in efficiency has declined over time, but the rate of
decline slowed down after the reforms. Shanmugam and Das (2004) has analysed the efficiency of 94 banks
belonging to four different ownership groups in India during 1992–1999 using stochastic frontier
production model. The banking industry has shown a progress in terms of efficiency of raising
10
4. European Journal of Business and Management www.iiste.org
ISSN 2222-1905 (Paper) ISSN 2222-2839 (Online)
Vol 4, No.3, 2012
non-interest income, investments and credits. The efficiency improvement is considerable in the case of
investments in all banks, particularly in private banks. Thus, the result matches with the economic growth
objective of the reform measure. It was found that the State bank group and foreign banks are more
efficient than their counterparts. However, they found that there are still larger gaps between the actual and
potential performances of banks. Sathye (2005) studied the impact of privatization on banks performance
and efficiency for the period 1998-2002 and found that partially privatized banks have performed better
than fully public sector banks and they are catching up with the banks in the private sector.
Das et al (2005) analyzed and estimated the efficiency of Indian banks using data envelopment analysis
during 1997-2003 and found that, despite liberalization measures aimed at strengthening and improving the
operational efficiency of the financial system, Indian banks were still not much differentiated in terms of
input- or output-oriented technical efficiency and cost efficiency; however, they found that they differ
sharply in terms of revenue and profit efficiencies. They also found that bank size, ownership, and the fact
of its being listed on the stock exchange had a positive impact on the average profit efficiency and to some
extent, revenue efficiency scores. Dash & Charles (2009) investigated the technical efficiency of Indian
banks, using the Data Envelopment Analysis (DEA) model, segmented in terms of ownership during the
period of 2003-08. The efficiency scores were calculated for a sample of forty-nine major banks operating
in India. The results of the study showed that foreign banks were slightly more efficient than public and
private banks, and that there was not much of a difference in the efficiency of public and private banks.
Literature suggests that impact of foreign banks entry on domestic banks is not uniform across the
developed and developing countries. In developing countries the entry of foreign banks lead to increase in
competition, transfer of technology, increase in efficiency, reduction in profitability and margins for
domestic banks, foreign banks had higher profits than domestic banks in developing countries, while the in
developed countries the results were in reverse trend. Although large number of studies was taken up, either
the variables are few or number of years is less. This research paper tries to fill the gap by analyzing the
performance of different ownership of bank groups as a result of increase in competition due to
commitments at Multilateral Trading system.
3. Research Methodology
3.1Research Design
This paper focuses on the performance of banking sector by analyzing the profitability and productivity of
Public Sector Banks vis-à-vis Private Sector Banks and Foreign Banks. The objective of the study was to
assign ranks to different bank groups on the basis of their overall performance scores. The said scores
were calculated on the basis of weighted aggregates of operating efficiency and financing effectiveness
based on accounting ratios. The weights were objectively derived by the application of Principle
Component method using the said variables. The parameters selected for evaluation of performance of
various categories of banks relating to efficiency, profitability and productivity are given below.
Operating Costs to Total Assets, Cost to Income Ratio, Intermediation Cost, Labour Cost per unit of
Earning Assets, Ratio of Labour Cost to Non-Labour Cost, Ratio of Net Interest Margin (NIM) to Total
Asset, Business per Employee, Business per Branch, Business per Unit Labour Cost, Share of other income
to total income, Return on Assets (ROA), Return on Equity (ROE).
The data on these parameters during 1991-92,1995-96,1999-2000, 2003-04, 2007-08 period have
been analyzed to observe the trend and the impact of various reform measures taken by traditional banks
(Public sector banks and Old private banks) to face the challenges posed by the modern banks (New and
Foreign banks) .The different periods have been selected to take in to consideration the period when the
reforms were initiated (1991-92) and in 1995-96 new private banks came into operation and agreement with
WTO signed and in further years the policy regarding the foreign banks were liberalized and foreign
direct investment was encouraged which led to vast changes in performance of various banks. Banking
sector is divided into nine banks groups for analytical purposes, as each group represents a distinct identity
of its own. The nine groups of banks studied are State bank group (8), Nationalized banks (19), all public
sector banks (27) old private sector banks (19), new private sector banks (8), all private banks (27) all
domestic banks, foreign banks (29), all commercial banks (79)
11
5. European Journal of Business and Management www.iiste.org
ISSN 2222-1905 (Paper) ISSN 2222-2839 (Online)
Vol 4, No.3, 2012
3.2. Data Collection.
The study relies on secondary data published by institutions and organizations concerned with commercial
banks. The publications of the Reserve Bank of India – Report on Trend and Progress of Banking in India
(Annual), Report on Currency and Finance (Annual), RBI Bulletins (Monthly) various issues has been used
to collect data.
3.3 Data Analysis Tools
Factor Analysis
In this study all the divergent dimensions of the performance of banks is taken up to evaluate their
performance scores and to rank different bank groups on the basis of their respective composite indices
based on sufficiently large number of indicators of banking development. There are two ways of assigning
weights to calculate composite index;
• Equal weights
• Weighted Average
In many composite indicators all variables are given the same weight when there are no statistical or
empirical grounds for choosing a different scheme. Equal weighting could imply the recognition of an
equal status for all indicators. The method of assigning equal weights may not be a realistic one. A more
reasonable and logical approach is to assign weights to each indicator as per their importance and take
weighted average of the signal generated by those indicators to form what is called composite index.
For this purpose ‘Factor Analysis’ a multivariate technique known for data reduction is used. Only those
factors were retained which have Eigen value of at least 1. The communalities, which give the proportion of
variance for each of the original variables, preserved in the factor solutions (denoted by h2) are also shown.
One of the methods of factor analysis is the ‘Principle Component Analysis’, widely used in literature. In
the first principle component analysis, the guiding principle for determining individual or group indicator
weights is the inter–correlation between them. High weights being assigned to those variables having
higher contribution and vice versa. Any principle component is actually a weighted sum of all the basic
series. The weights in the principle component are chosen such that the following requirements are
satisfied.
a. The values of the factor loading of the principle components are uncorrelated.
b. The variables of the principle component (Eigen values) are in decreasing order from the principle
component 1 to the principle component n.
c. First principle component should explain greatest possible variation of the data set, the second the
greatest possible variance among those components which are uncorrelated with the first, and so forth.
In the present study, ‘The First principal Component’ method has been adopted. The statistical model is in
the terms of the first principal component and which is expressed as:
n
P1 = Σ a ji Z j
z −i
a ji
Where denotes the factor loading of jth variable and i indicate the factor number i.e. first factor:
Z j = Standardized jth variable and is expressed as
xj xj
Zj = , =Original variable, S .D × j = Standard Deviation of the jth variable
S .D × j
Composite index is calculated for the sub periods under study .The sub periods are 1991-92, 1995-96,
1999-2000, 2003-04, and 2007-08. In calculating composite index, five indicators of efficiency, three of
productivity and four of profitability have been included in the construction of overall performance index.
This gives adequate representation to each dimension of bank’s performance. No doubt, there are other
indicators, which do reflect some dimension of efficiency/ productivity or profitability, but the selected
indicators are well-accepted indicators and are widely used by Reserve Bank of India (Report on Currency
and finance, 2007-08).
4. Data Analysis and Discussion
12
6. European Journal of Business and Management www.iiste.org
ISSN 2222-1905 (Paper) ISSN 2222-2839 (Online)
Vol 4, No.3, 2012
4.1 Factor Analysis
For the present study, the First Principal Component method has been used to determine the relative
weights of various indicators pertaining to banking development. In the First Principal Component
Analysis, the guiding principal for determining individual or group indicator weights is the inter-correlation
between them. High weights have been assigned to variables having higher contribution, and vice-versa. It,
at the same time bypasses the problem of multicollinerity. The Component analysis produces components
in descending order of their importance. Therefore, First Principal Component or Factor can be used as an
index for assigning weight to various parameters across all the bank groups. The factor loadings of the
selected twelve indicators of banking development, measured in terms of efficiency, productivity and
profitability for the years 1991-92, 1995-96, 1999-2000, 2003-04 and 2007-08 are discussed as follows:
4.1.1 Factor Analysis of 1991-92
Table 2 shows the analysis of 1991-92. It clearly emerges that the selected variables represented by two
components explains 90.64 per cent of variance across the inter-bank groups. But, the first component
explains 78.29 per cent of the inter-bank variation across the eight bank groups. Except operating costs,
NIM and return on equity, all other factors were very important in explaining the differentials across the
banks. The operating cost indicator in coefficient of variation was also very less, as compared to other
variables. These three variables were important in the second component, which explained only 12.35 per
cent of inter-bank differentials. Even, from the communalities column, it was quite evident that the
operating cost value was very low and hence not so important in explaining inter-bank differentials across
various bank groups. But, it was clear that all the three productivity variables were very dominant variables
in explaining differential across bank performance during 1991-92. But, in case of efficiency variables,
three variables namely X3 (Labour cost to earning asset), X4 (Labour cost to non labour cost), X5
(Intermediation cost), and X7 (Non-interest income) were significant and contributory variables in
explaining inter-bank groups differential. Similarly, in terms of profitability variables, the X11 (return on
asset) was relatively more important than X12 (return on equity).
4.1.2 Factor Analysis of 1995-96
From the results of 1995-96(Table 2), it follows that twelve variables can be easily classified into three
broad components, and they together explains 95.23 per cent of inter-bank group variance. But the
dominance of first component had relatively gone down, as it explained only 59.45 per cent variance across
bank groups. X1 (Operating cost), X2 (Cost/Income), X3 (Labour cost/asset) X4 (Labour cost/non labour
cost) amongst the efficiency parameter and X8 (business /employee), X10 (business per unit labour cost)
amongst the productivity indicators, were the dominant variables of first component. But the two
profitability indicators, namely return on asset and return on equity are two dominate indicators in second
component and account for 26.74 percent of variance. But along with it, non-interest income was another
significant factor in explaining inter-bank group variations. Hence, non-interest income, which was in
dominant position in 1991-92, was placed in second component in 1995-96. This fact was also clear from
the coefficient of variation (COV) value of this indicator (non-income), which had gone down from 36.7 to
15.29 percent in 1995-96. Indicators namely X5 (Intermediation cost) and X6 (NIM/asset), business
per branch (X9) were the dominant variables in the third component. The relative importance of few
indicators had gone down, during 1995-96 as compared to 1991-92. The third component explained only
9.028 per cent of inter-bank group variances as measured by twelve selected variables.
The importance of all twelve variables in explaining inter-bank variation could be easily seen from their
very high communalities, where each variables communality was higher than 0.8. But the results pointed
out that as compared to 1991-92; during 1995-96 there was trend towards greater uniformity across various
banks groups, as measured by efficiency parameter. But, two productivity indicators had emerged as an
important factor during 1995-96.
4.1.3 Factor Analysis of 1999- 2000
The results of factor Analysis for the years 1999-2000 (Table 3) showed that three broad components had
emerged which together explained 97.35 percent of variation across inter-bank groups. Three variables
13
7. European Journal of Business and Management www.iiste.org
ISSN 2222-1905 (Paper) ISSN 2222-2839 (Online)
Vol 4, No.3, 2012
namely X3 (Labour cost to earning asset), X2 (Cost/Income) and X4 (labour cost/ non labour cost) from
efficiency parameter and one from productivity X10 (business per unit of labour cost) were the dominant
variables in the first component. The dominant variables of second component were NIM /asset,
intermediation cost, business per employee along with business per branch were four dominant variables of
second component, which explained 34.26 percent of variation across bank groups. Return on equity
was the only dominant variable in third component, which explained nearly 10 percent of variance across
inter-bank groups. This clearly showed that, during 1999-2000, the relative importance of return on equity
had gone down in explaining inter-bank group variations. This fact was also seen form the relatively low
coefficient of variation (COV) value of 20.96 during 1999-2000 compared to 112.23 during 1995-96. The
high Communalities values of all the twelve variables do point out that three derived components explained
sufficiently high (97.35) percent of inter-bank variations during 1999-2000.
4.1.4 Factor Analysis of 2003-04
Table 3 indicated the results of factor analysis of inter-bank group data for twelve variables for the year
2003-04. Two-factor broad component had been derived which together explained 94.02 per cent of
variance across inter-bank group variable set for the year 2003-04. The first Component explained 54.89
per cent of variance and it was broadly represented by three efficiency parameters namely, labour cost to
asset (X3), labour cost to non labour cost (X4) and intermediation cost (X5), along with productivity
variables like business per employee (X8), business per unit labour cost (X10) and one from profitability
indicator, namely return on equity (X12). The five variables namely operating cost/asset, cost/Income,
NIM/asset, business per branch and return on asset were dominate variables of second component, which
explained 39.13 per cent of variance across inter-bank groups. Business per branch was the important
indicator in both the groups. This could also be seen from the very high coefficient of variation value of
business per branch (160.11 percent) for the year 2003-04. The cost to income indicator considered had
lowest communality value of 0.781 across all the indicators, and it was not considered important in both
derived components. Also this fact was validated by the very low coefficient of variation (4.06 per cent)
across all the selected variables but, all other indicators depicted very high communalities, which
underscores the importance of all other eleven indicators in explaining variance across inter-bank
indicators.
4.1.5 Factor Analysis of 2007-08
It is clear from the Table 3 that two broad components emerged from the factor analysis results for the year
2007-08. The first component explains 66.28 percent of variance across the interbank groups in the selected
twelve indicators. The variables in first component are predominantly represented by X2 (cost to income),
X1(operating cost /asset), X3 (Labour cost to earning asset), X9(Business per branch), X6(NIM/asset), X8
(business per employee) and X10 (business per unit labour cost). All the three productivity indicators are
significant in the first component. The X4 (labour cost to non labour cost) of efficiency and X12 (return
on equity) from profitability have very low presence in the first component. The second component is
dominantly represented by labor cost to non-labour cost and operating cost. This component could explain
19.49 percentage of variance across the variable set of the year. The two components during 2007-08, could
explain nearly 85.77 per cent of variance little less than other years, where it was over 90 percent but, if we
do consider third component the value goes up to 92.84 percent. But, the third component Eigen value is
less than one (0.848). The communalities in two cases, namely, return on equity (0.471) and NIM/asset
(0.578) is relatively low. This shows that these two variables do not represent two derived components.
4.2 Relative Weights of Banking Variable
Table 4 showed the relative weights of banking variables, for the years 1991-92, 1995-96, 1999-2000,
2003-04 and 2007-08. The weights have been calculated from the factor analysis results (shown in Tables 2
to 3). The weights derived on the principle of ‘First principal component’ analysis showed how the
importance of different variables had changed over a period of time, in understanding the interbank group
variation across variable set. It was seen that during 1991-92, labour cost/ earning asset (X 3), labour cost to
non labour cost ratio (X 4), business per unit labour cost (X10), business per employee (X8), other income
to total income ratio (X7), business per branch (X9) and intermediation cost (X5) were the most important
14
8. European Journal of Business and Management www.iiste.org
ISSN 2222-1905 (Paper) ISSN 2222-2839 (Online)
Vol 4, No.3, 2012
variables. The operating cost (X1), NIM/Asset (X6), return to equity (X12) were three variables, which
were of least importance in explaining inter-bank groups’ variance. This might be due to less competition,
less exposure to capital market and less operational flexibility of the banks. Rate of interest was regulated,
which got almost reflected in the final spread of the bank. After only few years of broad economic reforms
undertaken in various sectors of the economy, the relative importance of various variables changed
drastically. The most important variables in descending order of importance were business per employee
(X8), business per unit labour cost (X10), labour cost per unit of earning asset (X3) labour cost to non
labour cost (X4) and operating cost (X1). Five indicators namely, X5 (Intermediate cost), X6 (NIM/asset),
X7 (other income/total income), X9 (business per branch) and X12 (return to equity) were the least
important during 1995-96. During 1999-2000 labor cost to asset ratio (X3) was relatively most important
indicator in explaining interbank group variance. It was followed by X2 (cost to Income), X10 (business per
unit Labor Cost) and X4 (labour cost to non labour cost). The least important were X8 (business per
employee), X9 (business per branch), X5 (intermediation cost), X12 (return on equity) and X6 (NIM/asset).
Labor cost continues to be one of the most important indicators during all the selected years. But during
1999-2000, its relative importance was highest amongst all the years. Similarly, labor cost to non-labour
cost was very important in first four periods, but, during 2007-08, its relative weight across indicators
went down to last position. During 2003-04, the least important variables were X1 (operating cost/asset),
X2 (cost to income), X6 (NIM /asset) and X11 (return on asset). While X12 (return on equity), X4 (labor
cost to non labor cost), X8 (business per employee), X3 (labour cost /earning asset) and X5 (intermediation
cost) were the top discriminators. During 2007-08 X10 (business per unit labour cost), X11 (return on asset),
X9 (business per branch), X3 (labor cost to asset), X2 (cost to income) and X6 (NIM/asset) are the top
indicators in explaining variance across interbank groups. But, over a period of time X11 (return on asset),
X10 (business per unit labor cost), X2 (cost to income), X6 (NIM/asset), X9 (business per branch)
importance has increased over a period of time. Therefore, it is imperative that Indian banks must do
introspection to improve, return on asset in changed scenario characterized by openness, competition and
prudence. The cost of labor is increasing, therefore, in an era of competition some efforts must be
undertaken to increase the efficiency of labor and increase turnover to remain competitive. Thus, it is
quite clear that during the study period, the relative weights of all the undertaken parameters have
fluctuated a lot except X3 (labour cost/earning asset) and X10 (business per unit labour cost). This calls for
the need to look into totality or composite index of banks performance, as seen from combining all the
indicators and not a single indicator.
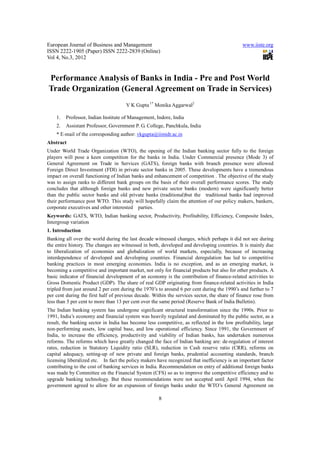
4.3 Weighted Composite index of Overall performance
Table 4 and Figure 1 depicted the weighted composite Index of overall performance as measured from all
the selected 12 Indicators. It was observed that foreign banks, occupied the first position during 1991-92,
2003-04 and 2007-08. Even, nationalized, State Banks group and all public sector groups were slightly
better than national average of 63.48 in 1995-96, but private banks, dominated during 1999-2000. During
2003-04, foreign banks regained their top position, but nationalized banks, State Bank group and all public
sector banks were below the national average of 266.56. During 2007-08, almost same position remained,
but overall performance of Indian banks in the liberalized environment was good. The variance across the
groups had increased in 1995-96 (56.37) as compared to 1991-92 (42.53). But after that inter-bank group
variance has decreased. In 2007-08 the variance has decreased to 19.49 from 27.16 in 1999-2000.This is
healthy indicator of Indian banking industry as variations in different groups have remarkably decreased
due to number of measures taken by the government but still foreign banks are enjoying the top position.
This is definitely an outcome of liberalized and deregulated environment provided by the post GATS
period.
5. Findings of the Study
Overall performance index revealed that new private sector banks occupied the top position in 1995-96 and
1999-2000 and thereafter they occupied the second slot and that foreign banks maintained their top
position in 1991-92, 2003-04 and 2007-08. The performance of SBI group, nationalized banks and old
private banks were below the mean value of 246.01 in all the selected years. Only new private banks and
15
9. European Journal of Business and Management www.iiste.org
ISSN 2222-1905 (Paper) ISSN 2222-2839 (Online)
Vol 4, No.3, 2012
foreign banks were above the mean ratio. New private banks have given a tough competition to foreign
banks. On the whole public sector banks and old private sector banks have improved their performance
from previous years as seen from the figure 1.There are differences in interbank performance from the very
beginning. One of the reasons for the low performance in productivity is Business per branch and business
per employee. Business per branch and employee is very high in case of foreign banks, followed by new
private banks and then public sector banks. Coefficient of Variation revealed that Inter-bank group
differences reduced from 56.37 in 1995-96 to 19.49 in 2007- 08. This shows that with the implementation
of GATS, various reforms measures were taken like operational flexibility, FDI in banking sector, opening
of economy and more transparency and autonomy to public sector banks, their efficiency has improved,
though they still lag behind private sector banks (modern banks).
6. Recommendations
It becomes clear that with GATS, India’s policy of opening the banking sector to domestic and foreign
competition has borne favorable results. The new private sector banks with latest technology and
professional staff has given a dent on the performance of foreign banks which were occupying the no. 1
position in 1991-92, before the coming of new private banks. But, with the further opening of economy to
foreign players there is need to increase the productivity and efficiency of public sector banks and
consolidating the weak banks. In order to sustain growth of public sector banks (traditional banks), they
have to enhance their technological innovation, marketing skills, product development, tapping non-interest
sources of income, reducing operating cost, skill enhancement of human resources of public sector and old
private sector banks. As there is huge gap in the performance of Public and Private banks and one of
the reasons for the low productivity of traditional banks is business per branch, hence, in order to increase
business per branch of public sector banks whose 35 % branches are in rural areas, firstly, they should have
strategic tie up with regional rural banks- for reaching the far-fetched areas instead of opening branches
themselves in the areas, which cannot provide them the break even business, secondly, they should use
more affordable technology, so that transaction cost of rural operations could come down and rural
branches could become profit centers . Currently, the financial service agreement reflects the status quo,
but India cannot keep the foreign banks entry regulations and stake of investment, restricted forever.
Keeping this in mind India should improve and implement fast financial sector reforms and make this
sector more competitive. The 21st century mantra is to “Consolidate, Compete and Converge”. Hence,
there is a need for consolidation to compete on a global platform.
7. Implication of the study
GATS commitments if made by India will lead to increase in market access of foreign banks. Therefore, a
guarded approach is necessary while making further commitments, since unrestricted entry of foreign
banks may marginalize public sector and old private banks. Public sector banks (PSBs), with a share of 70
per cent in credit and deposits, still hold dominant position in Indian banking system followed by new
private sector banks (21.6 percent) and foreign banks (8.4 percent) in 2009-10. Hence, overall
strengthening of our financial institutions is necessary both to face competition from foreign banks within
the country and to increase India’s presence abroad.
8. Limitation of the study and Direction for Future Research
Due to constraint of time, soundness and asset quality indicators cannot be undertaken to calculate
composite index. The technique of Balanced Scorecard can also be used as a tool for comprehensive
evaluation of performance
9. Conclusion
The study has analyzed overall performance of banking sector divided into nine groups on 12 selected
variables relating to efficiency, productivity and profitability for five different periods (1991-92, 1995-96,
1999-2000, 2003-2004, 2007-2008) to take the effect of different reform measures and GATS
commitments to open up the economy taken by RBI. Overall performance index, revealed that new
private sector banks occupied the top position in 1995-96 and 1999-2000 and after that foreign banks
maintained their top position (2003-04, 2007-08) Public sector banks and old private banks had improved
16
10. European Journal of Business and Management www.iiste.org
ISSN 2222-1905 (Paper) ISSN 2222-2839 (Online)
Vol 4, No.3, 2012
their performance from 1991 and inter-bank group differences were reduced from 56.37 in 1995-96 to
19.49 in 2007- 08 showing the impact of various reform measures taken by government to enhance
competition. Thus, the policy changes on entry of foreign banks in India implemented during 1995 and
2004 had significant impact on their presence in the structure of Indian banking industry.
Reforms should be taken to strengthen the regulatory mechanism to avoid potential conflicts between
home country regulators of Foreign Service providers and host country regulators. India’s strategy of
opening the banking sector for new private banks has certainly yielded good returns and has also led to
increase in the efficiency of public sector banks and measures should further be taken to reform the public
sector banks by adopting the strategies of consolidation and improving productivity and bringing down
operating cost which eventually will lead to profits. Hence, overall strengthening of our financial
institutions is necessary both to face competition from foreign banks within the country and to increase
India’s presence abroad. It can be concluded that due to the changing banking landscape number of
opportunities and challenge have arisen. Hence, to survive in the environment of intense competition, the
focus should be on ‘’Growth based on calculated risk”. Today, the Darwinian dictum on evolution is more
relevant than ever before: “It is not the strongest (of the species) that will survive, nor the most intelligent;
but the ones most responsive to change”.
References
Buch, C.M. (1997), “Opening Up For Foreign Banks: How Central And Eastern Europe Can Benefit,”
Economics of Transition,Vol 5 Issue2,Page339-366 Nov
1997,Http://Onlinelibrary.Wiley.Com/Doi/10.1111/J.1468-0351.1997.Tb00021.X/Abstract
Classes, Stijjin, Asli Demirguc-Kunt, And Harry Huizinga (2001). ‘How Does Foreign Entry Affect The
Domestic Banking Market?’, Journal Of Banking And Finance 25(5):891-911.
Das, A., Nag, A., and Ray, S.C. (2004), “Liberalization, Ownership, and Efficiency in Indian Banking: A
Nonparametric Approach,” Economics Working Papers, University Of Connecticut
Dash, Charles, (2009) A Study Of Technical Efficiency Of Banks In India (Available At Ssrn: Http:// Ssrn .
Com/ Abstract=1417376
Kumbhakar, S. C. And Sarkar, S. (2003), " Deregulation, Ownership, And Productivity Growth In The
Banking Industry: Evidence From India," Journal Of Money, Credit And Banking, Ohio State University
Press, Vol. 35(3).
Ram Mohan,T.T. (2002), ‘ Deregulation and Performance of Public sector banks” EPW, February2,
pp.393-397
Ram Mohan, T. T. And S. C. Ray (2004), “Comparing Performance Of Public And Private Sector Banks: A
Revenue Maximisation Efficiency Approach”, Economic And Political Weekly, Vol.39, No.12. Reserve
Bank Of India (Various Official Publications).
Nag. A. K And Shivaswamy. K (1990), Foreign Banks In India – Recent Performance, Reserve Bank Of
India Occasional Papers, Vol. 11, No. 4, December, Pp 297-328
Sarkar, P.C. And Das, A, (1997) “Development Of Composite Index Of Banking Efficiency: The Indian
Case”, RBI Occasional Papers.
Sathye, M (2005), “Privatization, Performance, And Efficiency: A Study Of Indian Banks”, Vikalpa, 2005,
30(1), 7-16.
Shanmugam, K.R, And Das, A (2004), “Efficiency Of Indian Commercial Banks During The Reform
Period”, Applied Financial Economics, 2004, 14, 681-686.
Uhomoibhi, Aburime, (2008). “Foreign Bank Penetration: An Expose of the Pros and Cons. European
Journal Of Economics, finance and administrative Sciences, No 9 pp.48-56.Available at SSRN:
http://ssrn.com/abstract=1107762.
World Trade Organization, (1997). “Opening Markets in Financial Services and The Role Of GATS”,
Geneva: World Trade Organization
17
11. European Journal of Business and Management www.iiste.org
ISSN 2222-1905 (Paper) ISSN 2222-2839 (Online)
Vol 4, No.3, 2012
Notes
Table 1 Road Map for Foreign Bank Presence (Source: Road map of RBI, February, 2005)
Announced Reforms Prior to March 2005-2009 2009 Thereafter
2005
Structure of foreign bank presence in Branches only Branches or wholly-owned Full national treatment,
India subsidiaries including IPO, subject to 26%
Aggregate foreign direct investment 49% 74% for banks identified as 74%
limit in private banks distressed by RBI
Foreign voting rights limit 10% Proposed amendment to allow voting rights to reflect ownership
level
Branching limit per year 12 20, subject to RBI approval
UNCHANGED
Five percent foreign investment limit in private banks by individual foreign banks
Ten percent foreign investment limit in private banks by foreign institutional investors or individual corporate entities
Table 2 Result of Factor Analysis 1991 – 92, 1995 – 96
1991 – 92 1995 – 96
Sr. Rotated Communalit Rotated Component Matrix Communalit
Variables
No. Components ies (h2 ) ies (h2 )
1 2 1 2 3
X1 Operating cost to Total Asset 0.265 0.508 0.329 0.821 0.363 0.375 0.946
X2 Cost to Income 0.776 0.489 0.841 0.692 0.712 0.103 0.997
X3 Labour cost/Earning Asset 0.994 0.001 0.987 0.898 0.391 0.036 0.961
X4 Labour cost to non labour Cost 0.971 0.232 0.996 0.915 0.155 0.355 0.987
X5 Intermediation cost 0.904 0.42 0.994 0.196 0.04 0.885 0.824
X6 NIM to Asset 0.033 0.967 0.936 0.18 0.37 0.898 0.976
X7 Other income to total income 0.937 0.318 0.978 0.326 0.722 0.455 0.835
X8 Business per employee 0.955 0.289 0.996 0.963 0.22 0.02 0.976
X9 Business per branch 0.935 0.347 0.995 -0.36 0.187 0.907 0.994
X10 Business per unit labour cost 0.969 0.232 0.993 9
0.922 0.196 0.31 0.984
X11 Return on asset 0.795 0.544 0.928 -0.65 0.733 0.121 0.983
X12 Return on equity 0.534 0.787 0.904 6
-0.20 0.957 0.096 0.966
.. Eigen Value 9.395 1.482 4
7.135 3.21 1.08
%age of variance explained to total 78.294 12.353 59.45 26.747 9.028
Cumulative variance 78.294 90.647 59.45 86.206 95.234
Table 3 Result of Factor Analysis 1999 – 2000, 2003-04, 2007-08 8
1999 – 2000 2003-04 2007-08
Rotated Component Com Rotated Com Rotated Com
Sr. Analysis munal Component munal Component munal
Variables
No. ities matrix ities ities
1 2 3 (h2 ) 1 2 (h2 ) 1 2 (h2 )
X1 Operating cost to Total 0.673 0.724 0.105 0.987 0.201 0.937 0.918 0.644 0.742 0.965
X2 Asset
Cost to Income 0.928 0.169 0.332 0.999 0.332 0.819 0.781 0.912 0.057 0.835
18
12. European Journal of Business and Management www.iiste.org
ISSN 2222-1905 (Paper) ISSN 2222-2839 (Online)
Vol 4, No.3, 2012
X3 Labour cost/Earning Asset 0.988 0.1 0.11 0.998 0.934 0.333 0.984 0.925 -0.31 0.953
X4 Labour cost to non labour 0.909 0.36 0.174 0.986 0.969 0.05 0.941 0.12 4
-0.97 0.955
X5 Cost
Intermediation cost 0.314 0.814 0.421 0.938 0.909 0.092 0.835 0.519 0.556 0.578
X6 NIM to Asset 0.403 0.893 0.005 0.96 0.302 0.94 0.975 0.858 0.335 0.848
X7 Other income to total 0.713 0.624 0.317 0.997 0.795 0.584 0.973 0.771 0.552 0.899
X8 income
Business per employee 0.143 0.965 0.096 0.961 0.961 0.21 0.967 0.847 0.427 0.899
X9 Business per branch 0.323 0.925 0.046 0.962 0.669 0.729 0.979 0.928 0.345 0.89
X10 Business per unit labour 0.915 0.253 0.014 0.901 0.852 0.503 0.979 0.957 0.105 0.927
X11 cost
Return on asset 0.623 0.607 0.492 0.999 0.069 0.98 0.966 0.954 0.272 0.983
X12 Return on equity 0.267 0.082 0.956 0.993 0.986 0.113 0.985 0.22 -0.65 0.471
Eigen Value 6.385 4.111 1.186 6.587 4.695 7.954 2.339
%age of variance 53.21 34.26 9.88 54.889 39.13 66.282 19.49
explained to total
Cumulative variance 53.21 87.47 97.35 54.89 94.02 66.28 85.77
Table 4 Relative Weights of Banking Variables, Weighted Composite Index of Performance of Bank Groups
Weighted Composite Index of Performance of
Relative Weights of Banking Variables
Variables in 1991- 1995- 1999- 2003- 2007- Bank group 1991- 1995- 1999- 2003- 2007-
Table 2 & 3 1992 1996 2000 2004 2008 1992 1996 2000 2004 2008
X1 0.88 12.58 8.54 0.61 5.76 1. SBI Group 109.1 70.95 131.25 238.49 204.39
X2 7.58 8.94 16.22 1.67 11.56 2. Nationalized 107.7 65.79 102.17 241.42 219.01
X3 12.44 15.62 18.39 13.25 11.89 3. All Public 108.3 65.81 112.40 240.25 203.21
X4 11.87 15.62 15.56 14.26 0.61 4. Old Private 106.5 75.99 134.92 246.40 204.81
X5 10.29 0.71 1.86 13.00 3.74 5. New Private - 234.0 233.70 300.00 255.28
X6 0.01 0.60 3.05 1.38 10.22 6. All Private 106.4 83.53 151.34 265.10 246.10
X7 11.05 1.98 9.57 9.60 8.25 7. Domestic 108.1 61.20 116.76 239.44 221.45
X8 11.48 17.38 0.38 14.03 9.96 8. Foreign 274.7 136.7 177.20 311.33 337.35
X9 11.00 2.54 1.96 6.80 11.96 9. All Banks 113.4 63.48 121.43 266.56 222.98
X10 11.82 15.06 15.77 11.03 12.72 X (Mean) 129.3 95.31 142.35 260.99 246.01
X11 7.96 8.02 7.31 0.08 12.64 σ 55.00 53.73 38.62 26.20 47.95
X12 3.58 0.75 1.34 14.76 0.67 COV. 42.53 56.37 27.163 9.97 19.49
Figure 1: Overall Performance of Bank Groups
19