Booking open Available Pune Call Girls Talegaon Dabhade 6297143586 Call Hot ...
AZTLAN Investment Outlook 2019
1. Outlook January 2019
AZTLANEquity Management, LLC
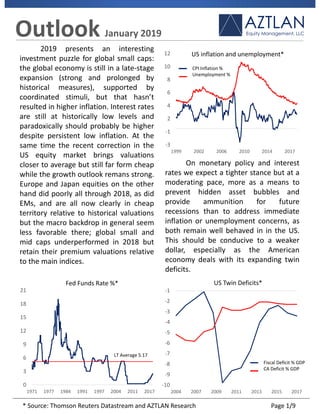
2019 presents an interesting
investment puzzle for global small caps:
the global economy is still in a late-stage
expansion (strong and prolonged by
historical measures), supported by
coordinated stimuli, but that hasn’t
resulted in higher inflation. Interest rates
are still at historically low levels and
paradoxically should probably be higher
despite persistent low inflation. At the
same time the recent correction in the
US equity market brings valuations
closer to average but still far form cheap
while the growth outlook remans strong.
Europe and Japan equities on the other
hand did poorly all through 2018, as did
EMs, and are all now clearly in cheap
territory relative to historical valuations
but the macro backdrop in general seem
less favorable there; global small and
mid caps underperformed in 2018 but
retain their premium valuations relative
to the main indices.
0
3
6
9
12
15
18
21
1971 1977 1984 1991 1997 2004 2011 2017
Fed Funds Rate %*
US inflation and unemployment*
-3
-1
2
4
6
8
10
12
1999 2002 2006 2010 2014 2017
On monetary policy and interest
rates we expect a tighter stance but at a
moderating pace, more as a means to
prevent hidden asset bubbles and
provide ammunition for future
recessions than to address immediate
inflation or unemployment concerns, as
both remain well behaved in in the US.
This should be conducive to a weaker
dollar, especially as the American
economy deals with its expanding twin
deficits.
US Twin Deficits*
-10
-9
-8
-7
-6
-5
-4
-3
-2
-1
2004 2007 2009 2011 2013 2015 2017
LT Average 5.17
Fiscal Deficit % GDP
CA Deficit % GDP
CPI Inflation %
Unemployment %
* Source: Thomson Reuters Datastream and AZTLAN Research Page 1/9
2. US and Canada AZTLANEquity Management, LLC
The tightening in monetary
conditions should result in additional
compression to valuation multiples but
the growth outlook should still support
earnings growth. The US market as
measured by P/E for the S&P500 was on
the pricier side going into the December
downdraft (PE of 22x) and begins 2019
right around the 20-year historical
average of 19.5x: valuations had reached
such high levels only 4 times in the last
15 years.
600
1,100
1,600
2,100
2,600
3,100
10
15
20
25
30
35
1999 2002 2006 2010 2014 2018
1,000
1,500
2,000
2,500
3,000
3,500
4,000
4,500
14
22
30
38
46
54
62
2004 2007 2011 2015 2018
Small caps in the US (using the
Russell 2000 index as proxy) were even
more expensive as of December 2018,
close to one standard deviation above
their 7-year historical average P/E
multiple; for small caps, valuation
multiple compression had started earlier
in October and so US small caps also go
into 2019 right around their 7-year
average.
Small caps retain their recent
premium valuations relative to the S&P
500 but at lower more attractive levels
now. The dividend yield for the S&P
500 stands at 2.0% and 1.35% for small
caps.
Canadian stocks underperformed
in 2018 driven by weaker energy prices
and weaker commodities broadly: a
weakening US dollar could be
supportive for Canadian stocks in 2019.
(LH) Historical P/E multiple
(RH) Index level
S&P500 Index and LTM P/E*
(LH) Historical P/E multiple
(RH) Index level
Russell 2000 Index and LTM P/E*
700
800
900
1000
2014 2015 2016 2017 2018 2019
Canada: TSX 60 Index*
* Source: Thomson Reuters Datastream and AZTLAN Research Page 2/9
3. 98
100
102
104
106
108
110
112
114
116
2014 2015 2016 2017 2018
Europe AZTLANEquity Management, LLC
Being underweight European
equities worked well in 2018 as the MSCI
Europe equity index corrected by 15%,
trending down steadily through the year.
On valuations European equities now
trade at a 28% discount relative to the
US market based on PE multiples
(Europe at 13.8x trailing, 12.4x forward
PE*) and with a 3.77% dividend yield.
Normally these valuations would make
European equities very attractive but
then there’s the Brexit uncertain
outcome on top of deteriorating
macroeconomic conditions that seemed
to have gain negative momentum for the
core Euro zone during the 4th quarter.
700
900
1,100
1,300
1,500
1,700
1,900
2,100
2,300
7
12
17
22
27
32
1999 2003 2007 2011 2015 2019
Within a generally negative macro
context for Europe we do find some
exceptions, specifically in the periphery,
including some of the Nordic countries
where economic conditions appear
relatively stronger and where we find
attractive valuations at the stock level.
Iceland is an interesting “hybrid” equity
market for us, as it is part of the Nordic
block but will be classified as Frontier by
FTSE* in 2019: it’s a small market but
liquid enough and with free cash flow
generating companies presenting
attractive valuations. Norway, Finland
and Denmark also present attractive
bottom-up opportunities, in our view.
(LH) Historical P/E multiple
(RH) Index level
MSCI Europe Index and LTM P/E*
Euro Zone
Iceland
European Economic Sentiment Indicators*
Denmark
Norway
* Source: Thomson Reuters Datastream and AZTLAN Research Page 3/9
4. 75
85
95
105
115
125
2009 2011 2013 2015 2018 500
700
900
1100
1300
1500
1700
1900
Japan AZTLANEquity Management, LLC
Japan equities were also good to
avoid in 2018 as the correction there was
more than 25% from the peak in January
2018. With this underperformance and
looking ahead valuations actually appear
very cheap in Japan as PE multiples are
now at a 10-year trough and the
dividend yield in aggregate close to 3%.
1,000
1,200
1,400
1,600
1,800
2,000
11
14
17
20
23
26
2013 2014 2015 2016 2017 2018
1.3
1.8
2.3
2.8
3.3
2008 2010 2012 2013 2015 2016 2018
An interesting aspect regarding
Japan’s investment outlook is the
currency: historically the Yen has
maintained a negative correlation with
equities. This time around and barring
an economic recession, cheap valuations
in the context of heightened global risk
sentiment and Yen as a safe heaven
asset (with Japan as the world’s largest
sovereign creditor) could see an
inflection in 2019 with simultaneous
strength in both equities and the Yen.
Clearly, economic conditions drive
corporate earnings which in turn
determine valuations, so we are cautious
in our assessment but it is remarkable
that valuation levels had not reached
such steep discounted levels in the
recent past, with PE multiples collapsing
well below one standard deviation below
average and dividend yield shooting
straight up.
(LH) Historical P/E multiple
(RH) Index level
Japan TOPIX Price Index and LTM P/E*
Japan TOPIX Dividend Yield %*
The Yen and Japan Equity Returns*
(LH) Yen/US$ Fx
(RH) TOPIX Index
* Source: Thomson Reuters Datastream and AZTLAN Research Page 4/9
5. Emerging Asia AZTLANEquity Management, LLC
Emerging markets equities peaked
at the beginning of 2018 and
underperform developed markets
through October; since then EMs have
shown more resiliency faring relatively
better during the Dec/18 correction. On
valuation multiples EMs have not yet
experienced a rerating to the levels seen
prior to the financial crisis of 2008 when
PE multiples briefly touched 18x and
have persistently traded at a discount to
DMs since the recovery. At the end of
2018 the trailing PE ratio for EM was just
a tad below 12x (10.5x forward) with a
dividend yield of 2.91%.
100
400
700
1,000
1,300
1,600
7
14
21
28
35
42
1988 1993 1998 2003 2008 2013 2018
On the geopolitical front we think
the bilateral commerce negotiation with
the US may be solved short term but has
the potential to escalate longer term as
China asserts its rising position as a top
economic and military power. We do not
see any immediate red flags, and the
trade dispute with the US might as well
get resolved in the short term -providing
strong support to EM and Chinese
equities- but overall China is slowing
down while other economies in the
region like South Korea, Thailand and
Vietnam could benefit from a shift in
manufacturing exports. We note India as
a place of focus for our research in 2019
with comparatively more balanced
demographics and macro conditions
providing for a long runway for growth.
In Asia China dominates the MSCI
EM index with its close to 30% country
weight. There we see a less favorable
outlook with an economy that is showing
signs of deceleration and some notable
economic and demographic imbalances,
on top of the ongoing trade dispute with
the US.
* Source: Thomson Reuters Datastream and AZTLAN Research Page 5/9
(LH) Historical P/E multiple
(RH) Index level
MSCI EM Price Index and LTM P/E*
Comparative GDP % Growth
Asian Economies*
5
6
7
8
9
10
11
12
13
14
15
-2
0
2
4
6
8
10
12
14
16
2000 2004 2007 2010 2014 2017
China (RH)
Vietnam(LH)
Thailand (LH)
S. Korea (LH)
6. 80
85
90
95
100
105
110
115
120
125
130
2010 2012 2014 2016 2018
EEMEA AZTLANEquity Management, LLC
Within the EEMEA group (Easter
Europe, the Middle East and Africa)
Russian equities quietly outperformed in
2018 notwithstanding a brief military
action warning by the US in Syria after a
suspected poison attack, a warning that
quickly faded away back in April. We do
not believe the historical Russia-risk
discount will dissipate any time soon but
earnings valuations this low tend to be
defensive in the context of higher
volatility. Moreover, what has been as
remarkable as intriguing is the break in
correlations between Russian equities
and oil which had been historically strong
and was completely absent during the
4Q18 correction in energy prices.
10
30
50
70
90
110
130
150
45
65
85
105
125
145
2010 2012 2014 2016 2018
Elsewhere in Eastern Europe places
like Romania, Hungary and Poland
present healthier macro tailwinds
compared to the major European
economies with equally attractive market
valuations.
In Africa and Middle East Egypt
stands out as a recovering economy with
attractive opportunities dependent on
the continuation of sound macro policies
recently instrumented staying in place as
higher rates help bring down inflation
while remittances and FDI support the
currency. Countries struggling to follow
orthodox policies, like Turkey, are unlikely
to stabilize in the short term. In Africa we
also see attractive opportunities and
closely monitor places like Nigeria where
elections will be held later this year and
as the financial industry moves forward
with consolidation after the Access-
Diamond Bank merger, which should
finalize in 1Q19.
Russian Equities and Oil*
(LH) MSCI Russia Equity Index
(RH) Crude Oil Spot $/barrel
Hungary
Poland
European Economic Sentiment Indicators*
Euro Zone
Romania
* Source: Thomson Reuters Datastream and AZTLAN Research Page 6/9
7. 100
150
200
250
300
350
LatAm AZTLANEquity Management, LLC
In Latin America the two largest
economies, Brazil and Mexico, had
presidential elections in late 2018 and
start 2019 with new administrations at
completely opposite extremes of the
political and ideological spectrum: in the
case of Brazil far-right Bolsorano brings a
pro-business agenda to be implemented
as the economy continues to emerge
from a protracted and deep recession. In
Brazil the implementation of pension
and tax reforms followed by much
needed measures to promote global
industrial competitiveness will be
paramount in supporting equities longer
term, while much of the good sentiment
seems to be priced in after the recent
rally. In Mexico, leftist/populist president
AMLO brings a retrograde agenda that
we find unlikely to be supportive of
equities despite lower valuations after
the post-election selloff.
85
105
125
145
165
185
205
5
10
15
20
25
30
2009 2011 2013 2015 2017 2019
In Chile the Piñera administration
has the complicated task of moving
forward with Chile’s labor and pension
reforms while the economy may see
tailwinds under a lower USD scenario in
which copper prices may strengthen.
Argentina has to some extent de-
risked after both the currency and
equities collapsed in 2018, but the
economy still faces persistently high
inflation and policy continuation will be
tested as presidential elections take
place later in 2019. In Puerto Rico, a
hybrid US-LatAm play, we expect a much
stronger economic expansion bolstered
by the US/FEMA disaster recovery funds
-about $7bn out of $15bn, still to be
disbursed in 2019- plus additional
deployments of rebuilding public and
private investment funds, while the
island restructures its long-term public
finances.
(LH) Historical P/E multiple
(RH) Index level
MSCI Brazil Price Index and LTM P/E*
3
9
15
21
27
33
39
2012 2015 2017
ARS/US$ FX and MSCI Argentina Equity Index*
(LH) ARS/US$ Fx
(RH) MSCI Argentina Index Returns
* Source: Thomson Reuters Datastream and AZTLAN Research Page 7/9
8. Conclusions AZTLANEquity Management, LLC
Overall 2019 shows supportive
fundamentals for global equites but not
without increased volatility. This will be
particularly favorable for sound active
strategies as compared to passive
investing. Basically, valuations are close
to average (i.e. not expensive) in places
where macro conditions are still
relatively stronger while the global risk
outlook is just marginally higher, leaving
some room to the upside.
As for the economic cycle we see
the US and Canada, China, and the
Eurozone at late stage, with Japan
slightly ahead. The US however still
presents supportive macro tailwinds,
while Europe and China will require
policy support to ameliorate economic
deceleration. In China and Europe we
see a slowdown and not a recession.
2019 Risk Outlook Themes
Severe China slowdown
Recession in Europe
Domestic US politics
Ukraine-Russia escalation
South China Sea tensions
Turkey or Italy destabilizing the EU
Excess leverage in US HY corporates
Global rise of inequality and populism
For currencies we expect some
weakening in the US dollar later in 2019
as the tightening adjustment takes place
and as the US tackles its deficits and
other domestic issues. This outlook is
favorable for commodities, especially
energy after the 4Q18 crash in oil prices,
and is in general favorable for EMs; these
factors will be countered by the
magnitude of the slowdown in China and
Europe as well as other macroeconomic
and geopolitical developments in 2019.
Shorter term we expect a favorable
resolution to the US-China trade dispute
to be supportive of risk assets but we
see this as a minor element within a
broader and more complex power
struggle between the world’s 2 largest
economies.
2019 Key SMID Cap Themes
US “health care tech” names
Puerto Rico recovery
Selective Nordic exposure
Japan SMID caps and currency
Energy/commodities/Canada
In EMF Russia, Egypt, Vietnam, SK,
Brazil, China tech
Turkish exporters / lira beneficiaries
Page 8/9