Transnational Communities - Not Your Grandfather's Diaspora
FLF Internship Project 1 -Mass Affluent Market in Canada
1. Author: Ahsan Mahmood (Falcon Lam Financial Intern 2015)
Mass Affluent Market in Canada and the U.S
Introduction
The Mass Affluent Market comprises of those individuals who own liquid financial assets greater
than $100,000 in value and less than $1000, 000. These individuals differ from the upper middle
income bracket due to the possession of investable liquid financial assets such as cash, stocks,
bonds, options, mutual funds and so on, that enable them to have higher financial flexibility. The
ownership of fixed assets such as real estate is being ignored. However, they earn less or are less
affluent than the wealthiest income bracket. This report will delve in to their demographics,
consumer behavior, lifestyles and attitudes, as well as their major concerns and attitude towards
financial planning.
Demographics
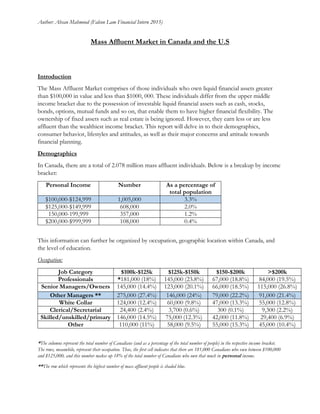
In Canada, there are a total of 2.078 million mass affluent individuals. Below is a breakup by income
bracket:
Personal Income Number As a percentage of
total population
$100,000-$124,999 1,005,000 3.3%
$125,000-$149,999 608,000 2.0%
150,000-199,999 357,000 1.2%
$200,000-$999,999 108,000 0.4%
This information can further be organized by occupation, geographic location within Canada, and
the level of education.
Occupation:
Job Category $100k-$125k $125k-$150k $150-$200k >$200k
Professionals *181,000 (18%) 145,000 (23.8%) 67,000 (18.8%) 84,000 (19.5%)
Senior Managers/Owners 145,000 (14.4%) 123,000 (20.1%) 66,000 (18.5%) 115,000 (26.8%)
Other Managers ** 275,000 (27.4%) 146,000 (24%) 79,000 (22.2%) 91,000 (21.4%)
White Collar 124,000 (12.4%) 60,000 (9.8%) 47,000 (13.3%) 55,000 (12.8%)
Clerical/Secretarial 24,400 (2.4%) 3,700 (0.6%) 300 (0.1%) 9,300 (2.2%)
Skilled/unskilled/primary 146,000 (14.5%) 75,000 (12.3%) 42,000 (11.8%) 29,400 (6.9%)
Other 110,000 (11%) 58,000 (9.5%) 55,000 (15.3%) 45,000 (10.4%)
*The columns represent the total number of Canadians (and as a percentage of the total number of people) in the respective income bracket.
The rows, meanwhile, represent their occupation. Thus, the first cell indicates that there are 181,000 Canadians who own between $100,000
and $125,000, and this number makes up 18% of the total number of Canadians who own that much in personal income.
**The row which represents the highest number of mass affluent people is shaded blue.
2. Author: Ahsan Mahmood (Falcon Lam Financial Intern 2015)
Geographic Location:
Region $100k-$125k $125k-$150k $150k-$200k >$200k
Atlantic 69,000 (6.8%) 43,000 (7.1%) 12,800 (3.6%) 6,100 (1.4%)
Quebec 156,000 (15.5%) 76,000 (12.4%) 37,700 (10.6%) 109,000 (25.6%)
Ontario 409,000 (40.7%) 239,000 (39.2%) 172,000 (48%) 158,000 (36.8%)
Prairies 236,000 (23.5%) 164,000 (27%) 88,000 (24.6%) 118,000(27.6%)
British
Columbia
135,000 (13.4%) 87,000 (14.3%) 47,000 (13.3%) 36,400 (8.5%)
City $100k-$125k $125k-$150k $150k-$200k >$200k
Toronto 219,000 (21.8%) 115,000 (18.9%) 77,000 (21.6%) 84,000 (19.7%)
Vancouver 67,000 (6.6%) 36,300 (6%) 25,700 (7.2%) 27,200 (6.4%)
Montreal 74,000 (7.4%) 44,000 (7.3%) 17,200 (4.8%) 90,000 (21%)
Quebec City 8,600 (0.9%) 13,300 (2.2%) 4,300 (1.2%) 4,100 (1.0%)
Ottawa/Gatineau 38,200 (3.8%) 20,200 (3.3%) 25,400 (7.1%) 13,900 (3.2%)
Calgary 66,000 (6.5%) 51,000 (8.3%) 32,600 (9.1%) 45,000 (10.4%)
Edmonton 55,000 (5.4%) 42,000 (6.9%) 28,400 (7.9%) 19,600 (4.6%)
Education:
Level of Education $100k-$125k $125k-$150k $150k-$200k >$200k
High School diploma 130,000 (12.9) 89,000
(14.6%)
29,200 (8.2%) 48,000 (11.1%)
Bachelor’s degree 306,000
(30.5%)
128,000
(21%)
107,000
(29.9%)
104,000 (24.2%)
Post Grad + degree 186,000
(18.5%)
171,000
(28.1%)
96,000 (26.9%) 14,900 (34.9%)
Trade
certificate/diploma
156,000
(15.6%)
64,000
(10.5%)
41,000 (11.4%) 28,900 (6.8%)
University/other non-
University certificate
201,000 (20%) 131,000
(21.5%)
69,000 (19.4%) 81,000 (18.9%)
No certificate/diploma 25,500 (2.5%) 26,000
(4.3%)
15,100 (4.2%) 17,500 (4.1%)
Mass Affluent Immigrants
According to a study by BMO Harris Private Banking in 2013, 24% of affluent individuals with
$1Million (Canadian) or more in investable assets are immigrants to Canada while an additional 24%
are first generation immigrants with at least one parent born outside Canada. 68% of this group
reported that their wealth was self-made. Furthermore, the study found that about a third of
3. Author: Ahsan Mahmood (Falcon Lam Financial Intern 2015)
Canada’s affluent population are new and recent citizens, who are also the fastest growing segment
of the country’s affluent.
As Canada’s major cities rank highly among the livable cities of the world, wealthy immigrants from
nations like India and China seeking lifestyle changes have been attracted to them. Due to incentives
from the government and a general easing in their immigration policy, the country’s urban
population has seen a large influx of immigrants, most of whom are skilled professionals with prior
knowledge of stock markets etc. Business and entrepreneurial class immigrants are ready to invest
and start enterprises in Canada as a means of expanding their wealth and often in hopes of obtaining
a Canadian passport. Many of them are elite and demanding clients who are looking for ways to
place their wealth and settle down.
Networking through immigrant business and community groups has proven integral in expanding a
mass affluent customer base, according to Vishu Dhiri, an advisor with Global Securities in Surrey,
British Columbia.
“All these activities help me in growing my business and also help provide vital services to the
community and letting them know what is available” says Dhiri.
The United States:
In the US, there are approximately 30 million households that are mass affluent and they own
roughly 37% of the country’s liquid financial assets. They greatly influence the buying behavior of
the general public, and are thus instrumental in economic performance.
Main takeaway: The South region holds the most number of Mass affluent households.
Consumer Behavior:
The mass affluent have some typical characteristics:
Save more than they spend and invest for their future.
Worry about funding their children’s college education, but are not opposed to their children paying
some part of their educational costs.
Worry about replacing their paycheck in retirement.
Often wish to leave an inheritance to their children.
Spend between $4,000 and $10,000 (USD) per month in retirement.
Household
Income
North East Mid-West South West
US$100K-150K 3,080,270 3,186,596 4,989,644 3,601,279
US$150K-200K 1,329,888 1,044,124 1,821,196 1,456,640
US$200K or > 1,410,559 919,472 1,773,514 1,429,083
4. Author: Ahsan Mahmood (Falcon Lam Financial Intern 2015)
A MetLife study – ‘money on the sidelines, 9/2010’ was conducted on close to 1900 consumers
above 45 years of age, including 500 individuals with at least US$200,000 in investable assets. It
found that this group invests heavily its liquid assets in bank products.
The study also compiled data on the preferred investment vehicles of the mass affluent market in
the US:
Wealth Distribution of Mass Affluent Households
Principal Residence Investment Real Estate
Liquid Financial Assets Pension and Employee Retirement Plans
Insurance and Annuities Privately Held Business
5. Author: Ahsan Mahmood (Falcon Lam Financial Intern 2015)
Another survey carried out in 2012 by HNW, Inc., titled “The Elephant in the Branch: Retail
Banking and the Mass Affluent Opportunity” had some very insightful facts that they feel would
benefit individual financial planners market their services and better adapt to the needs of their
clients. The sample size was 400 mass affluent individuals in the US.
The Mass Affluent community is the fastest growing wealth segment in the country
It currently accounts for one-third of all retail investment assets
Most do not consider themselves ‘wealthy’ but instead categorize themselves as ‘savers’
45% say they are ‘conservative investors’
Dislike a ‘product push’ approach from advisors, as nearly half of them felt that financial
advisors only contact them to “sell or push something”
A majority of participants reveal that as the value invested in the bank rises, they expect a
proportionate increase in services extended by advisors
Trust is a MAJOR factor in the client-advisor relationship
One of their major concerns is outliving their assets, thus an advisor must include ways to
protect against this in his game plan with the client.
Lifestyle and Attitudes:
According to the Yankelovich MONITOR (2004), an annual study of consumers, mass affluent
customers based purchasing decisions on the following findings:
Mutual
Funds
Bank Savings
Accounts
Money
Market
Accounts
CD's
Treasury/Sav
ings Bonds
Municipal
Bonds
Fixed
Annuities
Series1 65% 52% 51% 38% 21% 20% 19%
0%
10%
20%
30%
40%
50%
60%
70%
Preferred Investment Vehicles
6. Author: Ahsan Mahmood (Falcon Lam Financial Intern 2015)
They are interested in portraying themselves as individualistic, self-confident, in control of
their lives and different from convention.
They care a lot about high levels of customer service, and are highly vocal about sub-par
service and likely to walk out if mistreated by a representative.
They are reliant on the internet as a means of getting things accomplished without the help
of others, again re-iterating their individualistic nature. They are likely to shop for products
and services as well as airline tickets.
It is interesting to find that the mass affluent place more importance on experiences and
relationships than material possessions. The top three signs of life success cited by these
individuals were: (1) Being satisfied with your life, (2) being in control of your life, and (3)
having a good marriage.
Only 12% of them said they ‘have a lot of money’
Conclusion:
Mass affluent individuals in Canada are the most concentrated in Ontario (978,000) and further, in
the Toronto area (495,000). A large chunk of them belong to the baby boomer generation (born
from 1945-1965, 1.241 million individuals), and most are in senior managerial positions of
organizations. As far as the gender trend goes, as income rises in the mass affluent population, they
are much more likely to be male than female.
It is vital for financial planners and advisors to understand their attitudes, concerns and lifestyles.
They must establish a holistic relationship that factors in other investment and financial needs to
gain their confidence and acceptance of the plan laid out for them. Proactively reaching out to them
with information they may be interested in, not just to push products on them, is one of the ways
planners can build on their trust. The vast mass affluent market presents opportunities for financial
services professionals in Canada and the US alike, but only the smartest and most strategic ones win
over this educated, self-empowered and not-so-fickle population.