Download free for 30 days
Sign in
Upload
Language (EN)
Support
Business
Mobile
Social Media
Marketing
Technology
Art & Photos
Career
Design
Education
Presentations & Public Speaking
Government & Nonprofit
Healthcare
Internet
Law
Leadership & Management
Automotive
Engineering
Software
Recruiting & HR
Retail
Sales
Services
Science
Small Business & Entrepreneurship
Food
Environment
Economy & Finance
Data & Analytics
Investor Relations
Sports
Spiritual
News & Politics
Travel
Self Improvement
Real Estate
Entertainment & Humor
Health & Medicine
Devices & Hardware
Lifestyle
Change Language
Language
English
Español
Português
Français
Deutsche
Cancel
Save
Submit search
EN
Uploaded by
AhmadFikriNoor
618 views
Data Penjualan Mobil Januari-April 2020 (Gaikindo)
Data Penjualan Mobil Januari-April 2020 (Gaikindo)
Economy & Finance
◦
Read more
0
Save
Share
Embed
Embed presentation
Download
Download to read offline
1
/ 2
2
/ 2
More Related Content
PDF
2024 Trend Updates: What Really Works In SEO & Content Marketing
by
Search Engine Journal
PDF
Artificial Intelligence, Data and Competition – SCHREPEL – June 2024 OECD dis...
by
OECD Directorate for Financial and Enterprise Affairs
PDF
Storytelling For The Web: Integrate Storytelling in your Design Process
by
Chiara Aliotta
PDF
How to Leverage AI to Boost Employee Wellness - Lydia Di Francesco - SocialHR...
by
SocialHRCamp
PDF
PMK Nomor 48 Tahun 2020 (Kementerian Keuangan)
by
AhmadFikriNoor
PDF
Perpres 54 Tahun 2020
by
AhmadFikriNoor
PDF
Laporan Ekonomi dan Keuangan Syariah 2019 (Bank Indonesia)
by
AhmadFikriNoor
PDF
Paparan BPS Ekspor Impor April 2020
by
AhmadFikriNoor
2024 Trend Updates: What Really Works In SEO & Content Marketing
by
Search Engine Journal
Artificial Intelligence, Data and Competition – SCHREPEL – June 2024 OECD dis...
by
OECD Directorate for Financial and Enterprise Affairs
Storytelling For The Web: Integrate Storytelling in your Design Process
by
Chiara Aliotta
How to Leverage AI to Boost Employee Wellness - Lydia Di Francesco - SocialHR...
by
SocialHRCamp
PMK Nomor 48 Tahun 2020 (Kementerian Keuangan)
by
AhmadFikriNoor
Perpres 54 Tahun 2020
by
AhmadFikriNoor
Laporan Ekonomi dan Keuangan Syariah 2019 (Bank Indonesia)
by
AhmadFikriNoor
Paparan BPS Ekspor Impor April 2020
by
AhmadFikriNoor
Recently uploaded
PDF
Rupin Banker_ Global Money Flows and Their Impact on Emerging Economies.pdf
by
Rupin Banker
PDF
Authors' team Bezpartochnyi, M., Britchenko, I., Bezpartochna, O. et al. Inte...
by
Igor Britchenko
PDF
PSU-MAC001-modified- Căn bản kinh tế vĩ mô.pdf
by
tt356044
PDF
CLEANING CHECKLIST.pdf"Cleaning Checklist – Stay Organized with Daily, Weekly...
by
CA Suvidha Chaplot
PDF
DAILY PLANNER FOR WORKING WOMEN.pdf"Daily Planner for Indian Working Women – ...
by
CA Suvidha Chaplot
PDF
PLANNER BY CA SUVIDHA CHAPLOT.pdf"Weekly Planner Template by CA Suvidha Chapl...
by
CA Suvidha Chaplot
PDF
SAVINGS PLANNER SHEET.pdf "Savings Challenge Tracker by CA Suvidha Chaplot – ...
by
CA Suvidha Chaplot
PDF
EXPENSES TRACKER.pdf "Expenses Tracker – Organize and Manage Your Monthly Bud...
by
CA Suvidha Chaplot
PDF
PERSONAL.pdf "Personal Expense & Income Sheet – Track Your Finances with Ease"
by
CA Suvidha Chaplot
PDF
Buying PayPal Business Accounts for Online Business.pdf
by
https://www.slideshare.net/kjhgfdsan97
PDF
EXFUSION - NEO.FX - english – Forex – Copy Trading – TAG Markets – Affiliate
by
Exfusion
PPTX
10x Your Gold & Forex Trading in 2026 with AI Algo Trading
by
Project Syndicate
PDF
GenerationAI Paris 2025 | How a CFO Can Get ROI with GenAI.pdf
by
apidays
PPTX
TRIPS Agreement: Objectives, Features and the Global Waiver Debate
by
AnveshaSingh14
PPTX
micro-1.pptxnbbbbnsnnsnsnsnbdbbbdbdbdbsnsk
by
ahmedkadri618
DOCX
How to Buy Verified Cash App Account.docx
by
marketing
DOCX
5 Best Marketplaces to Buy and Sell Facebook Accounts ....docx
by
marketing
DOCX
Instant Delivery of Buy Verified Cash App Accounts_ A Guide to Digital Financ...
by
USAALLHUB Digital Marketer in 2026
DOCX
Buy Verified Binance Accounts for Business Use in 2026.docx
by
USAALLHUB Digital Marketer in 2026
DOCX
_How to Buy Twitter Accounts in 2025.docx
by
hi1885171
Rupin Banker_ Global Money Flows and Their Impact on Emerging Economies.pdf
by
Rupin Banker
Authors' team Bezpartochnyi, M., Britchenko, I., Bezpartochna, O. et al. Inte...
by
Igor Britchenko
PSU-MAC001-modified- Căn bản kinh tế vĩ mô.pdf
by
tt356044
CLEANING CHECKLIST.pdf"Cleaning Checklist – Stay Organized with Daily, Weekly...
by
CA Suvidha Chaplot
DAILY PLANNER FOR WORKING WOMEN.pdf"Daily Planner for Indian Working Women – ...
by
CA Suvidha Chaplot
PLANNER BY CA SUVIDHA CHAPLOT.pdf"Weekly Planner Template by CA Suvidha Chapl...
by
CA Suvidha Chaplot
SAVINGS PLANNER SHEET.pdf "Savings Challenge Tracker by CA Suvidha Chaplot – ...
by
CA Suvidha Chaplot
EXPENSES TRACKER.pdf "Expenses Tracker – Organize and Manage Your Monthly Bud...
by
CA Suvidha Chaplot
PERSONAL.pdf "Personal Expense & Income Sheet – Track Your Finances with Ease"
by
CA Suvidha Chaplot
Buying PayPal Business Accounts for Online Business.pdf
by
https://www.slideshare.net/kjhgfdsan97
EXFUSION - NEO.FX - english – Forex – Copy Trading – TAG Markets – Affiliate
by
Exfusion
10x Your Gold & Forex Trading in 2026 with AI Algo Trading
by
Project Syndicate
GenerationAI Paris 2025 | How a CFO Can Get ROI with GenAI.pdf
by
apidays
TRIPS Agreement: Objectives, Features and the Global Waiver Debate
by
AnveshaSingh14
micro-1.pptxnbbbbnsnnsnsnsnbdbbbdbdbdbsnsk
by
ahmedkadri618
How to Buy Verified Cash App Account.docx
by
marketing
5 Best Marketplaces to Buy and Sell Facebook Accounts ....docx
by
marketing
Instant Delivery of Buy Verified Cash App Accounts_ A Guide to Digital Financ...
by
USAALLHUB Digital Marketer in 2026
Buy Verified Binance Accounts for Business Use in 2026.docx
by
USAALLHUB Digital Marketer in 2026
_How to Buy Twitter Accounts in 2025.docx
by
hi1885171
Featured
PDF
The six step guide to practical project management
by
MindGenius
PDF
Introduction to Data Science
by
Christy Abraham Joy
PDF
Beginners Guide to TikTok for Search - Rachel Pearson - We are Tilt __ Bright...
by
RachelPearson36
PDF
How Race, Age and Gender Shape Attitudes Towards Mental Health
by
ThinkNow
PDF
Time Management & Productivity - Best Practices
by
Vit Horky
PDF
Product Design Trends in 2024 | Teenage Engineerings
by
Pixeldarts
PDF
Social Media Marketing Trends 2024 // The Global Indie Insights
by
Kurio // The Social Media Age(ncy)
PDF
PEPSICO Presentation to CAGNY Conference Feb 2024
by
Neil Kimberley
PDF
Content Methodology: A Best Practices Report (Webinar)
by
contently
PDF
Getting into the tech field. what next
by
Tessa Mero
PDF
Skeleton Culture Code
by
Skeleton Technologies
PDF
Everything You Need To Know About ChatGPT
by
Expeed Software
PDF
ChatGPT and the Future of Work - Clark Boyd
by
Clark Boyd
PDF
Google's Just Not That Into You: Understanding Core Updates & Search Intent
by
Lily Ray
PDF
Trends In Paid Search: Navigating The Digital Landscape In 2024
by
Search Engine Journal
PDF
How to have difficult conversations
by
Rajiv Jayarajah, MAppComm, ACC
PDF
5 Public speaking tips from TED - Visualized summary
by
SpeakerHub
PDF
2024 State of Marketing Report – by Hubspot
by
Marius Sescu
PDF
AI Trends in Creative Operations 2024 by Artwork Flow.pdf
by
marketingartwork
PPTX
How to Prepare For a Successful Job Search for 2024
by
Albert Qian
The six step guide to practical project management
by
MindGenius
Introduction to Data Science
by
Christy Abraham Joy
Beginners Guide to TikTok for Search - Rachel Pearson - We are Tilt __ Bright...
by
RachelPearson36
How Race, Age and Gender Shape Attitudes Towards Mental Health
by
ThinkNow
Time Management & Productivity - Best Practices
by
Vit Horky
Product Design Trends in 2024 | Teenage Engineerings
by
Pixeldarts
Social Media Marketing Trends 2024 // The Global Indie Insights
by
Kurio // The Social Media Age(ncy)
PEPSICO Presentation to CAGNY Conference Feb 2024
by
Neil Kimberley
Content Methodology: A Best Practices Report (Webinar)
by
contently
Getting into the tech field. what next
by
Tessa Mero
Skeleton Culture Code
by
Skeleton Technologies
Everything You Need To Know About ChatGPT
by
Expeed Software
ChatGPT and the Future of Work - Clark Boyd
by
Clark Boyd
Google's Just Not That Into You: Understanding Core Updates & Search Intent
by
Lily Ray
Trends In Paid Search: Navigating The Digital Landscape In 2024
by
Search Engine Journal
How to have difficult conversations
by
Rajiv Jayarajah, MAppComm, ACC
5 Public speaking tips from TED - Visualized summary
by
SpeakerHub
2024 State of Marketing Report – by Hubspot
by
Marius Sescu
AI Trends in Creative Operations 2024 by Artwork Flow.pdf
by
marketingartwork
How to Prepare For a Successful Job Search for 2024
by
Albert Qian
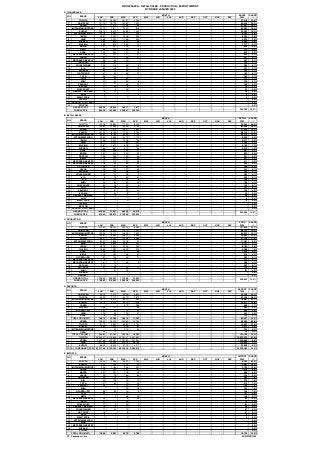
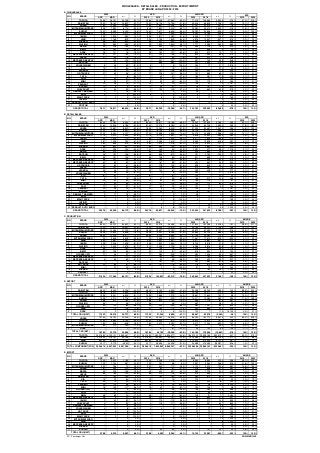
Data Penjualan Mobil Januari-April 2020 (Gaikindo)
1.
A. WHOLESALES SALES SHARE JAN
FEB MAR APR MAY JUN JUL AUG SEP OCT NOV DEC 2020 % 1 TOYOTA 24,119 25,053 26,191 2,056 - - - - - - - - 77,419 31.6% 2 DAIHATSU 14,173 15,778 18,162 1,330 - - - - - - - - 49,443 20.2% 3 HONDA 12,777 11,373 12,068 1,183 - - - - - - - - 37,401 15.3% 4 MITSUBISHI MOTORS 9,179 7,811 7,582 808 - - - - - - - - 25,380 10.4% 5 SUZUKI 10,512 8,613 5,085 1,042 - - - - - - - - 25,252 10.3% 6 MITSUBISHI FUSO 3,116 3,092 2,777 305 - - - - - - - - 9,290 3.8% 7 ISUZU 2,331 2,044 1,325 335 - - - - - - - - 6,035 2.5% 8 HINO 1,465 2,004 1,168 339 - - - - - - - - 4,976 2.0% 9 NISSAN 585 845 600 58 - - - - - - - - 2,088 0.9% 10 WULING 489 875 384 29 - - - - - - - - 1,777 0.7% 11 MAZDA 297 437 208 43 - - - - - - - - 985 0.4% 12 B M W 155 215 253 78 - - - - - - - - 701 0.3% 13 DFSK 243 304 101 25 - - - - - - - - 673 0.3% 14 MERCEDES-BENZ PC 124 222 221 57 - - - - - - - - 624 0.3% 15 LEXUS 32 127 155 37 - - - - - - - - 351 0.1% 16 MERCEDES-BENZ CV 95 139 103 - - - - - - - - - 337 0.1% 17 DATSUN 226 47 27 - - - - - - - - - 300 0.1% 18 VOLKSWAGEN 123 114 48 9 - - - - - - - - 294 0.1% 19 K I A 54 128 73 19 - - - - - - - - 274 0.1% 20 HYUNDAI 130 70 33 21 - - - - - - - - 254 0.1% 21 UD TRUCKS 47 60 63 27 - - - - - - - - 197 0.1% 22 TATA 55 100 7 1 - - - - - - - - 163 0.1% 23 FAW 18 48 44 17 - - - - - - - - 127 0.1% 24 MINI 32 50 35 8 - - - - - - - - 125 0.1% 25 PEUGEOT 17 31 35 22 - - - - - - - - 105 0.0% 26 SCANIA 11 44 9 12 - - - - - - - - 76 0.0% 27 CHEVROLET 11 5 34 4 - - - - - - - - 54 0.0% 28 RENAULT MAXINDO 15 14 17 2 - - - - - - - - 48 0.0% 29 AUDI 3 1 1 4 - - - - - - - - 9 0.0% 30 MAN TRUCK 1 1 2 - - - - - - - - - 4 0.0% 31 INFINITI - - - - - - - - - - - - - 0.0% 32 RENAULT AUTO EURO - - - - - - - - - - - - - 0.0% 33 PROTON - - - - - - - - - - - - - 0.0% 80,435 79,645 76,811 7,871 - - - - - - - - 80,435 160,080 236,891 244,762 244,762 244,762 244,762 244,762 244,762 244,762 244,762 244,762 B. RETAIL SALES RETAIL SHARE JAN FEB MAR APR MAY JUN JUL AUG SEP OCT NOV DEC 2020 % 1 TOYOTA 24,928 23,884 17,787 8,443 - - - - - - - - 75,042 30.8% 2 DAIHATSU 14,582 13,658 10,946 5,160 - - - - - - - - 44,346 18.2% 3 HONDA 12,603 11,918 10,657 1,855 - - - - - - - - 37,033 15.2% 4 SUZUKI 10,120 8,144 7,161 2,700 - - - - - - - - 28,125 11.5% 5 MITSUBISHI MOTORS 8,460 8,163 5,450 2,703 - - - - - - - - 24,776 10.2% 6 MITSUBISHI FUSO 2,950 3,086 2,473 1,119 - - - - - - - - 9,628 4.0% 7 ISUZU 1,705 2,022 1,528 756 - - - - - - - - 6,011 2.5% 8 HINO 1,617 2,020 1,245 481 - - - - - - - - 5,363 2.2% 9 WULING 1,381 1,670 838 263 - - - - - - - - 4,152 1.7% 10 NISSAN 785 861 602 165 - - - - - - - - 2,413 1.0% 11 DFSK 355 346 255 101 - - - - - - - - 1,057 0.4% 12 MAZDA 254 402 224 53 - - - - - - - - 933 0.4% 13 DATSUN 295 238 192 26 - - - - - - - - 751 0.3% 14 B M W 175 200 191 55 - - - - - - - - 621 0.3% 15 MERCEDES-BENZ PC 122 219 202 68 - - - - - - - - 611 0.3% 16 MERCEDES-BENZ CV 118 149 95 62 - - - - - - - - 424 0.2% 17 UD TRUCKS 148 137 80 33 - - - - - - - - 398 0.2% 18 LEXUS 29 105 137 43 - - - - - - - - 314 0.1% 19 HYUNDAI 114 103 45 33 - - - - - - - - 295 0.1% 20 VOLKSWAGEN 123 114 48 9 - - - - - - - - 294 0.1% 21 K I A 5 76 62 61 - - - - - - - - 204 0.1% 22 TATA 37 104 19 6 - - - - - - - - 166 0.1% 23 MINI 40 55 50 20 - - - - - - - - 165 0.1% 24 CHEVROLET 52 34 53 4 - - - - - - - - 143 0.1% 25 FAW 18 48 44 17 - - - - - - - - 127 0.1% 26 PEUGEOT 17 31 35 22 - - - - - - - - 105 0.0% 27 SCANIA 11 44 9 12 - - - - - - - - 76 0.0% 28 RENAULT MAXINDO 15 14 17 2 - - - - - - - - 48 0.0% 29 AUDI 3 1 1 4 - - - - - - - - 9 0.0% 30 MAN TRUCK 1 1 2 - - - - - - - - - 4 0.0% 31 INFINITI - - - - - - - - - - - - - 0.0% 32 PROTON - - - - - - - - - - - - - 0.0% 33 RENAULT AUTO EURO - - - - - - - - - - - - - 0.0% 81,063 77,847 60,448 24,276 - - - - - - - - 81,063 158,910 219,358 243,634 243,634 243,634 243,634 243,634 243,634 243,634 243,634 243,634 C. PRODUCTION PROD SHARE JAN FEB MAR APR MAY JUN JUL AUG SEP OCT NOV DEC 2020 % 1 TOYOTA 41,262 38,730 43,222 8,590 - - - - - - - - 131,804 37.7% 2 DAIHATSU 14,162 15,699 17,972 1,330 - - - - - - - - 49,163 14.0% 3 MITSUBISHI MOTORS 15,853 13,110 14,065 2,845 - - - - - - - - 45,873 13.1% 4 SUZUKI 14,361 13,634 12,644 2,946 - - - - - - - - 43,585 12.5% 5 HONDA 12,902 12,309 12,306 3,689 - - - - - - - - 41,206 11.8% 6 MITSUBISHI FUSO 5,037 2,856 3,648 20 - - - - - - - - 11,561 3.3% 7 HINO 3,104 2,696 2,587 990 - - - - - - - - 9,377 2.7% 8 ISUZU 2,975 2,944 2,346 438 - - - - - - - - 8,703 2.5% 9 WULING 1,583 1,282 2,049 374 - - - - - - - - 5,288 1.5% 10 DFSK 406 347 217 55 - - - - - - - - 1,025 0.3% 11 B M W 219 200 145 52 - - - - - - - - 616 0.2% 12 HYUNDAI (PC) 197 163 45 77 - - - - - - - - 482 0.1% 13 MERCEDES-BENZ PC 176 119 117 - - - - - - - - - 412 0.1% 14 MERCEDES-BENZ CV 151 72 69 6 - - - - - - - - 298 0.1% 15 DATSUN 272 10 - - - - - - - - - - 282 0.1% 16 UD TRUCK 31 60 63 22 - - - - - - - - 176 0.1% 17 MINI 1 20 70 - - - - - - - - - 91 0.0% 18 NISSAN - - - - - - - - - - - - - 0.0% 19 RENAULT - - - - - - - - - - - - - 0.0% 112,692 104,251 111,565 21,434 - - - - - - - - 112,692 216,943 328,508 349,942 349,942 349,942 349,942 349,942 349,942 349,942 349,942 349,942 D. EXPORTS EXPORT SHARE JAN FEB MAR APR MAY JUN JUL AUG SEP OCT NOV DEC 2020 % 1 DAIHATSU 6,423 11,010 8,026 4,800 - - - - - - - - 30,259 34.2% 2 TOYOTA 6,099 7,717 6,472 2,878 - - - - - - - - 23,166 26.2% 3 MITSUBISHI MOTORS 1,811 6,814 8,441 1,595 - - - - - - - - 18,661 21.1% 4 SUZUKI 3,919 4,440 4,214 1,438 - - - - - - - - 14,011 15.8% 5 HONDA - - 570 388 - - - - - - - - 958 1.1% 6 WULING 285 141 - 56 - - - - - - - - 482 0.5% 7 HYUNDAI (PC) 240 60 120 40 - - - - - - - - 460 0.5% 8 HINO 125 95 173 47 - - - - - - - - 440 0.5% 9 DFSK 8 109 3 - - - - - - - - - 120 0.1% 18,910 30,386 28,019 11,242 - - - - - - - - 88,557 100% 1 HONDA 19,590 26,190 26,760 13,754 - - - - - - - - 86,294 82.8% 2 TOYOTA 3,170 3,580 4,980 2,790 - - - - - - - - 14,520 13.9% 3 SUZUKI 696 1,308 828 180 - - - - - - - - 3,012 2.9% 4 MITSUBISHI MOTORS - 60 210 60 - - - - - - - - 330 0.3% 5 DFSK 25 13 1 - - - - - - - - - 39 0.0% 23,481 31,151 32,779 16,784 - - - - - - - - 104,195 100% 1 TOYOTA 4,564,357 5,216,856 6,203,141 2,647,680 - - - - - - - - 18,632,034 91.9% 2 HONDA 361,758 452,091 278,182 237,934 - - - - - - - - 1,329,965 6.6% 3 HINO 97,108 54,606 57,400 66,785 - - - - - - - - 275,899 1.4% 4 SUZUKI 8,543 8,649 9,179 4,217 - - - - - - - - 30,588 0.2% 5,031,766 5,732,202 6,547,902 2,956,616 - - - - - - - - 20,268,486 100% E. IMPORTS IMPORT SHARE JAN FEB MAR APR MAY JUN JUL AUG SEP OCT NOV DEC 2020 % 1 TOYOTA 1,400 1,335 2,422 1,233 - - - - - - - - 6,390 42.3% 2 SUZUKI 244 326 1,104 723 - - - - - - - - 2,397 15.9% 3 MITSUBISHI MOTORS 346 1,168 256 330 - - - - - - - - 2,100 13.9% 4 HONDA 179 305 383 161 - - - - - - - - 1,028 6.8% 5 MAZDA 297 437 208 43 - - - - - - - - 985 6.5% 6 LEXUS 29 75 186 86 - - - - - - - - 376 2.5% 7 DAIHATSU 20 70 190 - - - - - - - - - 280 1.9% 8 KIA 54 128 73 19 - - - - - - - - 274 1.8% 9 TATA 101 54 14 44 - - - - - - - - 213 1.4% 10 PEUGEOT 48 - 120 24 - - - - - - - - 192 1.3% 11 MINI - - 135 18 - - - - - - - - 153 1.0% 12 HYUNDAI (PC) 88 39 14 5 - - - - - - - - 146 1.0% 13 FAW 40 - 101 - - - - - - - - - 141 0.9% 14 BMW - 2 58 48 - - - - - - - - 108 0.7% 15 MERCEDES-BENZ CV 36 - 6 38 - - - - - - - - 80 0.5% 16 ISUZU 27 11 34 2 - - - - - - - - 74 0.5% 17 CHEVROLET 11 5 34 4 - - - - - - - - 54 0.4% 18 RENAULT MAXINDO 15 14 17 2 - - - - - - - - 48 0.3% 19 VOLKSWAGEN 11 20 12 4 - - - - - - - - 47 0.3% 20 UD TRUCK 16 - 5 - - - - - - - - - 21 0.1% 21 AUDI 3 1 1 4 - - - - - - - - 9 0.1% 22 MAN TRUCK 1 1 2 - - - - - - - - - 4 0.0% 23 MITSUBISHI FUSO - - - - - - - - - - - - - 0.0% 24 HINO - - - - - - - - - - - - - 0.0% 25 MERCEDES-BENZ PC - - - - - - - - - - - - - 0.0% 26 NISSAN - - - - - - - - - - - - - 0.0% 27 SCANIA - - - - - - - - - - - - - 0.0% 2,966 3,991 5,375 2,788 - - - - - - - - 15,120 100% PC : Passenger Cars 100%349,942 ©GAIKINDO-20 WHOLESALES - RETAIL SALES - PRODUCTION - EXPORT IMPORT NO. BRAND MONTH TOTAL CBU (UNIT) CUMULATIVE NO. BRAND MONTH GRAND TOTAL MONTH GRAND TOTAL MONTH BY BRAND JAN-APR 2020 TOTAL CBU (UNIT) 100% 100%243,634 244,762 CUMULATIVE CUMULATIVE NO. GRAND TOTAL TOTAL CKD (SET) TOTAL COMPONENT (PCS) NO. BRAND BRAND NO. BRAND MONTH
2.
A. WHOLESALES APR MAR
2020 2019 2020 2019 2019 2020 1 TOYOTA 2,056 26,191 -24,135 -92.1% 2,056 29,408 -27,352 -93.0% 77,419 106,664 -29,245 -27.4% 31.4% 31.6% 2 DAIHATSU 1,330 18,162 -16,832 -92.7% 1,330 16,126 -14,796 -91.8% 49,443 66,825 -17,382 -26.0% 19.7% 20.2% 3 HONDA 1,183 12,068 -10,885 -90.2% 1,183 11,631 -10,448 -89.8% 37,401 40,475 -3,074 -7.6% 11.9% 15.3% 4 MITSUBISHI MOTORS 808 7,582 -6,774 -89.3% 808 7,832 -7,024 -89.7% 25,380 43,412 -18,032 -41.5% 12.8% 10.4% 5 SUZUKI 1,042 5,085 -4,043 -79.5% 1,042 7,677 -6,635 -86.4% 25,252 30,546 -5,294 -17.3% 9.0% 10.3% 6 MITSUBISHI FUSO 305 2,777 -2,472 -89.0% 305 2,244 -1,939 -86.4% 9,290 13,788 -4,498 -32.6% 4.1% 3.8% 7 ISUZU 335 1,325 -990 -74.7% 335 1,817 -1,482 -81.6% 6,035 7,777 -1,742 -22.4% 2.3% 2.5% 8 HINO 339 1,168 -829 -71.0% 339 2,198 -1,859 -84.6% 4,976 10,347 -5,371 -51.9% 3.0% 2.0% 9 NISSAN 58 600 -542 -90.3% 58 902 -844 -93.6% 2,088 4,804 -2,716 -56.5% 1.4% 0.9% 10 WULING 29 384 -355 -92.4% 29 1,533 -1,504 -98.1% 1,777 4,286 -2,509 -58.5% 1.3% 0.7% 11 MAZDA 43 208 -165 -79.3% 43 434 -391 -90.1% 985 1,725 -740 -42.9% 0.5% 0.4% 12 B M W 78 253 -175 -69.2% 78 148 -70 -47.3% 701 698 3 0.4% 0.2% 0.3% 13 DFSK 25 101 -76 -75.2% 25 152 -127 -83.6% 673 572 101 17.7% 0.2% 0.3% 14 MERCEDES-BENZ PC 57 221 -164 -74.2% 57 203 -146 -71.9% 624 1,063 -439 -41.3% 0.3% 0.3% 15 LEXUS 37 155 -118 -76.1% 37 131 -94 -71.8% 351 422 -71 -16.8% 0.1% 0.1% 16 MERCEDES-BENZ CV - 103 -103 -100.0% - 207 -207 -100.0% 337 745 -408 -54.8% 0.2% 0.1% 17 DATSUN - 27 -27 -100.0% - 885 -885 -100.0% 300 2,449 -2,149 -87.8% 0.7% 0.1% 18 VOLKSWAGEN 9 48 -39 -81.3% 9 4 5 125.0% 294 77 217 281.8% 0.0% 0.1% 19 K I A 19 73 -54 -74.0% 19 - 19 0.0% 274 - 274 0.0% 0.0% 0.1% 20 HYUNDAI 21 33 -12 -36.4% 21 157 -136 -86.6% 254 430 -176 -40.9% 0.1% 0.1% 21 UD TRUCKS 27 63 -36 -57.1% 27 228 -201 -88.2% 197 889 -692 -77.8% 0.3% 0.1% 22 TATA 1 7 -6 -85.7% 1 42 -41 -97.6% 163 281 -118 -42.0% 0.1% 0.1% 23 FAW 17 44 -27 -61.4% 17 30 -13 -43.3% 127 72 55 76.4% 0.0% 0.1% 24 MINI 8 35 -27 -77.1% 8 50 -42 -84.0% 125 175 -50 -28.6% 0.1% 0.1% 25 PEUGEOT 22 35 -13 -37.1% 22 9 13 144.4% 105 32 73 228.1% 0.0% 0.0% 26 SCANIA 12 9 3 33.3% 12 43 -31 -72.1% 76 191 -115 -60.2% 0.1% 0.0% 27 CHEVROLET 4 34 -30 -88.2% 4 153 -149 -97.4% 54 662 -608 -91.8% 0.2% 0.0% 28 RENAULT MAXINDO 2 17 -15 -88.2% 2 - 2 0.0% 48 - 48 0.0% 0.0% 0.0% 29 AUDI 4 1 3 300.0% 4 4 0 0.0% 9 12 -3 -25.0% 0.0% 0.0% 30 MAN TRUCK - 2 -2 -100.0% - 3 -3 -100.0% 4 17 -13 -76.5% 0.0% 0.0% 31 INFINITI - - 0 0.0% - - 0 0.0% - - 0 0.0% 0.0% 0.0% 32 RENAULT AUTO EURO - - 0 0.0% - 8 -8 -100.0% - 14 -14 -100.0% 0.0% 0.0% 33 PROTON - - 0 0.0% - - 0 0.0% - - 0 0.0% 0.0% 0.0% 7,871 76,811 -68,940 -89.8% 7,871 84,259 -76,388 -90.7% 244,762 339,450 -94,688 -27.9% 100% 100% B. RETAIL SALES APR MAR 2020 2019 2020 2019 2019 2020 1 TOYOTA 8,443 17,787 -9,344 -52.5% 8,443 26,611 -18,168 -68.3% 75,042 102,693 -27,651 -26.9% 30.1% 30.8% 2 DAIHATSU 5,160 10,946 -5,786 -52.9% 5,160 13,216 -8,056 -61.0% 44,346 60,706 -16,360 -26.9% 17.8% 18.2% 3 HONDA 1,855 10,657 -8,802 -82.6% 1,855 10,260 -8,405 -81.9% 37,033 50,457 -13,424 -26.6% 14.8% 15.2% 4 SUZUKI 2,700 7,161 -4,461 -62.3% 2,700 8,145 -5,445 -66.9% 28,125 31,712 -3,587 -11.3% 9.3% 11.5% 5 MITSUBISHI MOTORS 2,703 5,450 -2,747 -50.4% 2,703 10,558 -7,855 -74.4% 24,776 44,658 -19,882 -44.5% 13.1% 10.2% 6 MITSUBISHI FUSO 1,119 2,473 -1,354 -54.8% 1,119 3,116 -1,997 -64.1% 9,628 13,432 -3,804 -28.3% 3.9% 4.0% 7 ISUZU 756 1,528 -772 -50.5% 756 1,799 -1,043 -58.0% 6,011 7,649 -1,638 -21.4% 2.2% 2.5% 8 HINO 481 1,245 -764 -61.4% 481 2,096 -1,615 -77.1% 5,363 10,528 -5,165 -49.1% 3.1% 2.2% 9 WULING 263 838 -575 -68.6% 263 1,479 -1,216 -82.2% 4,152 5,423 -1,271 -23.4% 1.6% 1.7% 10 NISSAN 165 602 -437 -72.6% 165 964 -799 -82.9% 2,413 3,653 -1,240 -33.9% 1.1% 1.0% 11 DFSK 101 255 -154 -60.4% 101 145 -44 -30.3% 1,057 477 580 121.6% 0.1% 0.4% 12 MAZDA 53 224 -171 -76.3% 53 363 -310 -85.4% 933 1,689 -756 0.0% 0.5% 0.4% 13 DATSUN 26 192 -166 -86.5% 26 838 -812 -96.9% 751 2,790 -2,039 -73.1% 0.8% 0.3% 14 B M W 55 191 -136 -71.2% 55 148 -93 -62.8% 621 698 -77 -11.0% 0.2% 0.3% 15 MERCEDES-BENZ PC 68 202 -134 -66.3% 68 199 -131 -65.8% 611 1,040 -429 -41.3% 0.3% 0.3% 16 MERCEDES-BENZ CV 62 95 -33 -34.7% 62 161 -99 -61.5% 424 667 -243 -36.4% 0.2% 0.2% 17 UD TRUCKS 33 80 -47 -58.8% 33 178 -145 -81.5% 398 829 -431 -52.0% 0.2% 0.2% 18 LEXUS 43 137 -94 -68.6% 43 123 -80 -65.0% 314 387 -73 -18.9% 0.1% 0.1% 19 HYUNDAI 33 45 -12 -26.7% 33 100 -67 -67.0% 295 408 -113 -27.7% 0.1% 0.1% 20 VOLKSWAGEN 9 48 -39 -81.3% 9 4 5 125.0% 294 77 217 281.8% 0.0% 0.1% 21 K I A 61 62 -1 -1.6% 61 - 61 0.0% 204 - 204 0.0% 0.0% 0.1% 22 TATA 6 19 -13 -68.4% 6 41 -35 -85.4% 166 312 -146 -46.8% 0.1% 0.1% 23 MINI 20 50 -30 -60.0% 20 50 -30 -60.0% 165 175 -10 -5.7% 0.1% 0.1% 24 CHEVROLET 4 53 -49 -92.5% 4 127 -123 -96.9% 143 772 -629 -81.5% 0.2% 0.1% 25 FAW 17 44 -27 -61.4% 17 30 -13 -43.3% 127 72 55 76.4% 0.0% 0.1% 26 PEUGEOT 22 35 -13 -37.1% 22 9 13 144.4% 105 32 73 228.1% 0.0% 0.0% 27 SCANIA 12 9 3 33.3% 12 43 -31 -72.1% 76 191 -115 -60.2% 0.1% 0.0% 28 RENAULT MAXINDO 2 17 -15 -88.2% 2 - 2 0.0% 48 - 48 0.0% 0.0% 0.0% 29 AUDI 4 1 3 300.0% 4 4 0 0.0% 9 12 -3 -25.0% 0.0% 0.0% 30 MAN TRUCK - 2 -2 -100.0% - 3 -3 -100.0% 4 17 -13 -76.5% 0.0% 0.0% 31 INFINITI - - 0 0.0% - - 0 0.0% - - 0 0.0% 0.0% 0.0% 32 PROTON - - 0 0.0% - 3 -3 -100.0% - 20 -20 -100.0% 0.0% 0.0% 33 RENAULT AUTO EURO - - 0 0.0% - 8 -8 -100.0% - 49 -49 -100.0% 0.0% 0.0% 24,276 60,448 -36,172 -59.8% 24,276 80,821 -56,545 -70.0% 243,634 341,625 -97,991 -28.7% 100% 100% C. PRODUCTION APR MAR 2020 2019 2020 2019 2019 2020 1 TOYOTA 8,590 43,222 -34,632 -80.1% 8,590 44,078 -35,488 -80.5% 131,804 162,088 -30,284 -18.7% 38.5% 37.7% 2 DAIHATSU 1,330 17,972 -16,642 -92.6% 1,330 15,943 -14,613 -91.7% 49,163 66,222 -17,059 -25.8% 15.7% 14.0% 3 MITSUBISHI MOTORS 2,845 14,065 -11,220 -79.8% 2,845 15,637 -12,792 -81.8% 45,873 67,094 -21,221 -31.6% 15.9% 13.1% 4 SUZUKI 2,946 12,644 -9,698 -76.7% 2,946 9,002 -6,056 -67.3% 43,585 34,725 8,860 25.5% 8.2% 12.5% 5 HONDA 3,689 12,306 -8,617 -70.0% 3,689 9,245 -5,556 -60.1% 41,206 39,482 1,724 4.4% 9.4% 11.8% 6 MITSUBISHI FUSO 20 3,648 -3,628 -99.5% 20 3,359 -3,339 -99.4% 11,561 17,312 -5,751 -33.2% 4.1% 3.3% 7 HINO 990 2,587 -1,597 -61.7% 990 2,531 -1,541 -60.9% 9,377 12,887 -3,510 -27.2% 3.1% 2.7% 8 ISUZU 438 2,346 -1,908 -81.3% 438 1,802 -1,364 -75.7% 8,703 8,918 -215 -2.4% 2.1% 2.5% 9 WULING 374 2,049 -1,675 -81.7% 374 2,099 -1,725 -82.2% 5,288 5,816 -528 -9.1% 1.4% 1.5% 10 DFSK 55 217 -162 -74.7% 55 134 -79 -59.0% 1,025 471 554 117.6% 0.1% 0.3% 11 B M W 52 145 -93 -64.1% 52 143 -91 -63.6% 616 534 82 15.4% 0.1% 0.2% 12 HYUNDAI (PC) 77 45 32 71.1% 77 280 -203 -72.5% 482 1,406 -924 -65.7% 0.3% 0.1% 13 MERCEDES-BENZ PC - 117 -117 -100.0% - 150 -150 -100.0% 412 752 -340 -45.2% 0.2% 0.1% 14 MERCEDES-BENZ CV 6 69 -63 -91.3% 6 54 -48 -88.9% 298 430 -132 -30.7% 0.1% 0.1% 15 DATSUN - - 0 0.0% - 252 -252 -100.0% 282 1,960 -1,678 -85.6% 0.5% 0.1% 16 UD TRUCK 22 63 -41 -65.1% 22 137 -115 -83.9% 176 674 -498 -73.9% 0.2% 0.1% 17 MINI - 70 -70 -100.0% - 1 -1 -100.0% 91 72 19 26.4% 0.0% 0.0% 18 NISSAN - - 0 0.0% - - 0 0.0% - 180 -180 -100.0% 0.0% 0.0% 19 RENAULT - - 0 0.0% - - 0 0.0% - - 0 0.0% 0.0% 0.0% 21,434 111,565 -90,131 -80.8% 21,434 104,847 -83,413 -79.6% 349,942 421,023 -71,081 -16.9% 100% 100% D. EXPORT APR MAR 2020 2019 2020 2019 2019 2020 1 DAIHATSU 4,800 8,026 -3,226 -40.2% 4,800 9,133 -4,333 -47.4% 30,259 35,249 -4,990 -14.2% 38.3% 34.2% 2 TOYOTA 2,878 6,472 -3,594 -55.5% 2,878 5,518 -2,640 -47.8% 23,166 25,311 -2,145 -8.5% 27.5% 26.2% 3 MITSUBISHI MOTORS 1,595 8,441 -6,846 -81.1% 1,595 2,865 -1,270 -44.3% 18,661 17,640 1,021 5.8% 19.2% 21.1% 4 SUZUKI 1,438 4,214 -2,776 -65.9% 1,438 1,641 -203 -12.4% 14,011 10,080 3,931 39.0% 11.0% 15.8% 5 HONDA 388 570 -182 -31.9% 388 1,620 -1,232 -76.0% 958 1,776 -818 -46.1% 1.9% 1.1% 6 WULING 56 - 56 0.0% 56 - 56 0.0% 482 - 482 0.0% 0.0% 0.5% 7 HYUNDAI (PC) 40 120 -80 -66.7% 40 300 -260 -86.7% 460 1,291 -831 -64.4% 1.4% 0.5% 8 HINO 47 173 -126 -72.8% 47 160 -113 -70.6% 440 665 -225 -33.8% 0.7% 0.5% 9 DFSK - 3 -3 -100.0% - 3 -3 -100.0% 120 7 113 1614.3% 0.0% 0.1% 11,242 28,019 -16,777 -59.9% 11,242 21,240 -9,998 -47.1% 88,557 92,019 (3,462) -3.8% 100% 100% 1 HONDA 13,754 26,760 -13,006 -48.6% 13,754 39,060 -25,306 -64.8% 86,294 154,770 -68,476 -44.2% 86.4% 82.8% 2 TOYOTA 2,790 4,980 -2,190 -44.0% 2,790 3,600 -810 -22.5% 14,520 12,910 1,610 12.5% 7.2% 13.9% 3 SUZUKI 180 828 -648 -78.3% 180 2,472 -2,292 -92.7% 3,012 11,244 -8,232 -73.2% 6.3% 2.9% 4 MITSUBISHI MOTORS 60 210 -150 -71.4% 60 - 60 0.0% 330 - 330 0.0% 0.0% 0.3% 5 DFSK - 1 -1 -100.0% - 51 -51 -100.0% 39 132 -93 -70.5% 0.1% 0.0% 16,784 32,779 -15,995 -48.8% 16,784 45,183 -28,399 -62.9% 104,195 179,056 (74,861) -41.8% 100% 100% 1 TOYOTA 2,647,680 6,203,141 -3,555,461 -57.3% 2,647,680 7,484,357 -4,836,677 -64.6% 18,632,034 28,538,165 -9,906,131 -34.7% 95.2% 91.9% 2 HONDA 237,934 278,182 -40,248 -14.5% 237,934 193,590 44,344 22.9% 1,329,965 642,210 687,755 107.1% 2.1% 6.6% 3 HINO 66,785 57,400 9,385 16.4% 66,785 98,361 -31,576 -32.1% 275,899 373,309 -97,410 -26.1% 1.2% 1.4% 4 SUZUKI 4,217 9,179 (4,962) -54.1% 4,217 48,555 -44,338 -91.3% 30,588 415,459 -384,871 -92.6% 1.4% 0.2% 2,956,616 6,547,902 -3,591,286 -54.8% 2,956,616 7,824,863 -4,868,247 -62.2% 20,268,486 29,969,143 -9,700,657 -32.4% 100% 100% E. IMPORT APR MAR 2020 2019 2020 2019 2019 2020 1 TOYOTA 1,233 2,422 -1,189 -49.1% 1,233 2,248 -1,015 -45.2% 6,390 8,594 -2,204 -25.6% 36.7% 42.3% 2 SUZUKI 723 1,104 -381 -34.5% 723 761 -38 -5.0% 2,397 5,060 -2,663 -52.6% 21.6% 15.9% 3 MITSUBISHI MOTORS 330 256 74 28.9% 330 442 -112 -25.3% 2,100 3,424 -1,324 -38.7% 14.6% 13.9% 4 HONDA 161 383 -222 -58.0% 161 80 81 101.3% 1,028 658 370 56.2% 2.8% 6.8% 5 MAZDA 43 208 -165 -79.3% 43 434 -391 -90.1% 985 1,725 -740 -42.9% 7.4% 6.5% 6 LEXUS 86 186 -100 -53.8% 86 214 -128 -59.8% 376 553 -177 -32.0% 2.4% 2.5% 7 DAIHATSU - 190 -190 0.0% - 160 -160 -100.0% 280 610 -330 -54.1% 2.6% 1.9% 8 KIA 19 73 -54 -74.0% 19 - 19 0.0% 274 - 274 0.0% 0.0% 1.8% 9 TATA 44 14 30 214.3% 44 44 0 0.0% 213 300 -87 -29.0% 1.3% 1.4% 10 PEUGEOT 24 120 -96 -80.0% 24 4 20 500.0% 192 48 144 300.0% 0.2% 1.3% 11 MINI 18 135 -117 -86.7% 18 42 -24 -57.1% 153 146 7 4.8% 0.6% 1.0% 12 HYUNDAI (PC) 5 14 -9 -64.3% 5 113 -108 -95.6% 146 284 -138 -48.6% 1.2% 1.0% 13 FAW - 101 -101 -100.0% - 10 -10 -100.0% 141 88 53 60.2% 0.4% 0.9% 14 BMW 48 58 -10 -17.2% 48 17 31 182.4% 108 31 77 248.4% 0.1% 0.7% 15 MERCEDES-BENZ CV 38 6 32 533.3% 38 229 -191 -83.4% 80 859 -779 -90.7% 3.7% 0.5% 16 ISUZU 2 34 -32 -94.1% 2 115 -113 -98.3% 74 217 -143 -65.9% 0.9% 0.5% 17 CHEVROLET 4 34 -30 -88.2% 4 115 -111 -96.5% 54 401 -347 -86.5% 1.7% 0.4% 18 RENAULT MAXINDO 2 17 -15 -88.2% 2 - 2 0.0% 48 - 48 0.0% 0.0% 0.3% 19 VOLKSWAGEN 4 12 -8 -66.7% 4 4 0 0.0% 47 77 -30 -39.0% 0.3% 0.3% 20 UD TRUCK - 5 -5 -100.0% - - 0 0.0% 21 70 -49 -70.0% 0.3% 0.1% 21 AUDI 4 1 3 300.0% 4 4 0 0.0% 9 12 -3 -25.0% 0.1% 0.1% 22 MAN TRUCK - 2 -2 -100.0% - 3 -3 -100.0% 4 17 -13 -76.5% 0.1% 0.0% 23 MITSUBISHI FUSO - - 0 0.0% - - 0 0.0% - 14 -14 -100.0% 0.1% 0.0% 24 HINO - - 0 0.0% - - 0 0.0% - 8 -8 -100.0% 0.0% 0.0% 25 MERCEDES-BENZ PC - - 0 0.0% - - 0 0.0% - - 0 0.0% 0.0% 0.0% 26 NISSAN - - 0 0.0% - - 0 0.0% - - 0 0.0% 0.0% 0.0% 27 SCANIA - - 0 0.0% - 43 -43 0.0% - 191 -191 0.0% 0.8% 0.0% 2,788 5,375 -2,587 -48.1% 2,788 5,082 -2,294 -45.1% 15,120 23,387 -8,267 -35.3% 100% 100% PC : Passenger Car APR +/- % M/S M/S JAN APR +/- % ©GAIKINDO-20 BY BRAND JAN-APR 2020 / 2019 WHOLESALES - RETAIL SALES - PRODUCTION - EXPORT IMPORT BRAND +/- APR 2020 NO. APR +/- % GRAND TOTAL NO. BRAND +/- % +/- % % APR +/- % GRAND TOTAL NO. GRAND TOTAL BRAND +/- 2020 % TOTAL CBU (UNIT) TOTAL COMPONENT (PCS) NO. BRAND TOTAL CKD (SET) 2020 % JAN APR +/- % 2020 JAN APR +/- % SHARE JAN APR TOTAL CBU (UNIT) +/- % APR +/- JAN APR +/- % SHARE NO. BRAND +/- % 2020 +/- % SHARE
Download