ACL2015 Poster: Twitter User Geolocation Using a Unified Text and Network Prediction Model
•
0 likes•388 views

Twitter User Geolocation Using a Unified Text and Network Prediction Model
Recommended

Recommended
More Related Content
What's hot
What's hot (12)
Similar to ACL2015 Poster: Twitter User Geolocation Using a Unified Text and Network Prediction Model
Similar to ACL2015 Poster: Twitter User Geolocation Using a Unified Text and Network Prediction Model (20)
Recently uploaded
Recently uploaded (20)
ACL2015 Poster: Twitter User Geolocation Using a Unified Text and Network Prediction Model
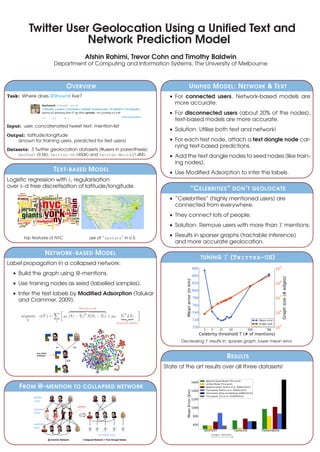
- 1. Twitter User Geolocation Using a Unified Text and Network Prediction Model Afshin Rahimi, Trevor Cohn and Timothy Baldwin Department of Computing and Information Systems, The University of Melbourne OVERVIEW Task: Where does @ShvwnK live? Input: user, concatenated tweet text, mention-list Output: latitude/longitude (known for training users, predicted for test users) Datasets: 3 Twitter geolocation datasets (#users in parenthesis) GeoText (9.5K), Twitter-US (450K) and Twitter-World (1.4M). TEXT-BASED MODEL Logistic regression with l1 regularisation over k-d tree discretisation of latitude/longitude. top features of NYC use of “upstate” in U.S. NETWORK-BASED MODEL Label propagation in a collapsed network: • Build the graph using @-mentions. • Use training nodes as seed (labelled samples). • Infer the test labels by Modified Adsorption (Talukar and Crammer, 2009). argmin ˆY c( ˆY ) = l µ1 Match seed (Yl − ˆYl)T S(Yl − ˆYl) + µ2 ˆY T l L ˆYl Smooth labels 0.7 0.5 0.01 new label estimate FROM @-MENTION TO COLLAPSED NETWORK @-mention Network Collapsed Network + Text Dongle Nodes labelled nodes unlabelled nodes mentioned nodes text dongle nodes celebrity UNIFIED MODEL: NETWORK & TEXT • For connected users, Network-based models are more accurate. • For disconnected users (about 20% of the nodes), text-based models are more accurate. • Solution: Utilise both text and network! • For each test node, attach a text dongle node car- rying text-based predictions. • Add the text dongle nodes to seed nodes (like train- ing nodes). • Use Modified Adsorption to infer the labels. “CELEBRITIES” DON’T GEOLOCATE • “Celebrities” (highly mentioned users) are connected from everywhere. • They connect lots of people. • Solution: Remove users with more than T mentions. • Results in sparser graphs (tractable inference) and more accurate geolocation. TUNING T (TWITTER-US) 2 5 15 50 500 5k Celebrity threshold T (# of mentions) 700 720 740 760 780 800 820 840 860 Meanerror(inkm) Mean error Graph size 105 106 107 108 109 Graphsize(#edges) Decreasing T results in: sparser graph, lower mean error. RESULTS State of the art results over all three datasets! GEOTEXT TwitterUS TwitterWorld 600 800 1000 1200 1400 1600 MeanError(km) Network-based Model (This work) Unified Model (This work) Network-based: Rahimi et al. (NAACL2015) Text-based: Rahimi et al. (NAACL2015) Text-based: Wing and Baldrige (EMNLP2014) Text-based: Cha et al. (ICWSM2015) larger dataset −−−−−−−−−→