Recommended

Recommended
More Related Content
What's hot
What's hot (20)
Similar to Poster 2
Similar to Poster 2 (20)
Poster 2
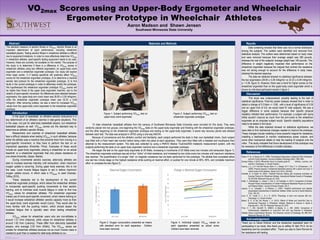
- 1. POSTER TEMPLATE BY: www.PosterPresentations.com Glaser, R. M., & Sawka, M. N. (1980). Physiological Responses to Maximal Effort Wheelchair and Arm Crank Ergometry. Journal of Applied Physiology, 48(6), 1060-1064. Goosey-Tolfrey, V. (2010). Wheelchair Sport; A complete guide for athletes, coaches, and teachers. Champaign, IL: Human Kinetics. Haisma, J. A., L H V Van Der Woude, Stam, H. J., Bergen, M. P., Sluis, T. A., & Bussmann, J. B. (2006). Physical capacity in wheelchair-dependent persons with a spinal cord injury: A critical review of the literature. Spinal Cord, 44(11), 642-652. Knechtle, B., & Kopfli, W. (2001). Treadmill Exercise Testing with Increasing Inclination as Exercise Protocol for Wheelchair Athletes. International Medical Society of Paraplegia, 39, 633-636. Retrieved February 22, 2016. Köklü, Y., Alemdaroğlu, U., Koçak, F., Erol, A., & Fındıkoğlu, G. (2011). Comparison of Chosen Physical Fitness Characteristics of Turkish Professional Basketball Players by Division and Playing Position. Journal of Human Kinetics, 30(-1). Lakomy, H. K., Campbell, I., & Williams, C. (1987). Treadmill performance and selected physiological characteristics of wheelchair athletes. British Journal of Sports Medicine, 21(3), 130-133. Larry, K. W., Costill, D. L., & J. H. (2015). Physiology of sport and exercise (6th ed.). Champaign, IL: Human Kinetics. Mason, B. S., & Van Der Woude, L. H. (2012). Effects of Wheel and Hand-Rim Size on Submaximal Propulsion in Wheelchair Athletes. Medicine & Science in Sports & Exercise,44(1), 126-134. Retrieved February 20, 2016. Price, D. T., MD, Davidoff, R., MBBCh, & Balady, G. J., MD. (2000). Comparison of Cardiovascular Adaptations to Long-Term Arm and Leg Exercise in Wheelchair Athletes Versus Long-Distance Runners. The American Journal of Cardiology, 85, 996-1001. Retrieved February 20, 2016. SOUTHWESTM I N N E S O T A S T A T E U N I V E R S I T Y VO2max Scores using an Upper-Body Ergometer and Wheelchair Ergometer Prototype in Wheelchair Athletes Aaron Madson and Shawn Jensen Southwest Minnesota State University Discussion References Abstract Introduction Acknowledgement The standard measure of aerobic fitness is VO2max. Aerobic fitness is an important determinant of sport performance, including wheelchair basketball players. Testing aerobic fitness in wheelchair athletes is difficult due to equipment limitations. In order to more effectively determine VO2max in wheelchair athletes, sport-specific testing equipment needs to be used. However, these are currently not available on the market. The purpose of this study is to determine if there is a difference in VO2max scores in wheelchair athletes using two different ergometers: an upper-body crank ergometer and a wheelchair ergometer prototype. Our study will explore three major points: 1) if testing specificity will positively affect VO2max scores for the wheelchair ergometer prototype, 2) to determine a maximal aerobic test protocol for the wheelchair ergometer prototype, 3) to find faults in the current prototype in order to effectively modify the prototype. We hypothesized the wheelchair ergometer prototype VO2max scores will be higher than those of the upper body ergometer machine, due to the relation of sport-specific movement. No differences were detected between ergometers, the upper-body arm crank mean was 28.09 ± 5.39 ml/kg/min, while the wheelchair ergometer prototype mean was 32.33 ± 6.49 ml/kg/min. After removing outliers, we saw a trend for increased VO2max values from the upper-body crank ergometer to the wheelchair ergometer prototype. 10 male wheelchair basketball athletes from the campus of Southwest Minnesota State University were recruited for this study. They were randomly placed into two groups, one beginning the VO2max tests on the upper-body ergometer and finishing with the wheelchair ergometer prototype, and the other beginning on the wheelchair ergometer prototype and ending on the upper-body ergometer. A seven day recovery period was allowed between each test. The data was analyzed in SPSS using a one-way ANOVA. Because of convenience and the athlete’s comfort and familiarity, each subject performed the tests in their own basketball chairs. Each subject was fitted with a Polar heart rate monitor before being rolled into place at each apparatus. They were then fitted with a headset and mouthpiece then attached to the measurement system. The data was collected by using a PARVO Medics TrueOne2400 metabolic measurement system, with the subjects performing the tests on an upper body ergometer machine and a wheelchair ergometer prototype. We began the test on the upper-body ergometer at 25 Watts, increasing in increments of 25 Watts every two minutes until exhaustion (figure 1). The wheelchair ergometer prototype was set at four “clicks” of initial resistance, and increased by two clicks every two minutes until maximum resistance was reached. The quantification of a single “click” on magnetic resistance has not been performed for this prototype. The athlete then completed either one last two minute stage on the highest resistance while pushing at maximal effort, or pushed for one minute at 90%, 95%, and complete maximum effort to complete the test (figure 2). In the sport of basketball, an athlete’s aerobic endurance is a key determinant of an athlete’s stamina in late-game situations. This is the case, not just for able-body basketball players, but wheelchair basketball players as well. VO2max scores are the standard way to determine an athlete’s aerobic fitness. Researchers and coaches of wheelchair basketball athletes face a difficult obstacle when testing VO2max in such athletes, because either the athlete uses a machine that prevents them from moving in a sport-specific movement, or they have to perform the test on an impractical apparatus (Knechtle, Price). Examples of these would include an upper-body ergometer, placing a wheelchair on an actual treadmill, or a wheelchair ergometer that only places resistance on one wheel (Knechtle, Glaser, Martel). During incremental aerobic exercise, able-body athletes are able to increase exercise intensity until exhaustion, when maximum oxygen uptake is occurring. During upper body exercise, this is not the case. Local muscle fatigue begins to set in before maximum oxygen uptake occurs, in which case a VO2peak is used (Goosey- Tolfrey 2010). These obstacles led to the development of the current wheelchair ergometer prototype, which allows the wheelchair athletes to incorporate sport-specific pushing movements to their aerobic training, and to minimize local muscle fatigue in order to find true VO2max values for wheelchair athletes. The wheelchair ergometer makes use of more sport-specific movement, which means training on it would increase wheelchair athletes’ aerobic capacity more so than the upper-body crank ergometer would (Larry). They would also be more familiar with the pushing motion, which should lessen the localized fatigue that is typically seen when testing wheelchair athletes. VO2max values for wheelchair users who are non-athletes is around 1.51 l/min (Haisma), while values for wheelchair athletes is around 1.82 l/min (Lakomy). These differ from able-body basketball players, who average 2.55 l/min (Köklü). The VO2max values are smaller for wheelchair athletes because not as much muscle mass is needed to push than is needed for able-body athletes to run. Thank you to Derek Klinkner and the wheelchair basketball team for participating in our study. Also thank you to Jeffrey W. Bell, Ph.D. for his leadership and his consistent effort. Thank you also to Demi Rorvick for her assistance with testing. Materials and Methods Data screening showed that there was not a normal distribution among the subjects. The outliers were identified and removed from statistical analysis. The outliers were determined based on body mass and were removed because their average weight was 290 pounds, whereas the rest of the subjects’ average weight was 149 pounds. This difference in weight negatively impacted their performance on the wheelchair ergometer because the magnet that controls the resistance was not strong enough to account for the difference in body mass. obtained the desired response. The data we obtained showed no statistical significance between the two ergometers (28.09 ± 5.39 ml/kg/min vs 32.33 ± 6.49 ml/kg/min, p = 0.39, figure 3). However, there was a trend for higher scores on the wheelchair ergometer than on the upper-body crank ergometer which is shown by individual participant results in figure 4. Results Figure 1. Subject performing VO2max test on upper-body crank ergometer. Figure 2. Subject performing VO2max test on wheelchair ergometer prototype. This study was underpowered, possibly leading to the lack of statistical significance. Post-hoc power analysis showed that in order to detect a change of 0.3 liters +/- 0.68 , with a level of significance of 0.05 and an upper limit of 0.8, we would need 81 total subjects. We saw a bigger difference in some subjects because their specific physical disability inhibited their performance. For example, a subject with spina bifida wouldn’t improve as much from the arm-crank to the wheelchair ergometer as an amputee subject would. Specific disability populations need to be tested in the future. While the data obtained showed no statistical significance, we were able to find mechanical changes needed to improve the prototype. These changes include installing a more powerful magnet for resistance, installing a dashboard to monitor instantaneous power outputs, and some other mechanical details to help the loading of subjects onto the roller. This study indicated that future development of the prototype may be necessary to find differences in smaller samples. Figure 4. Individual subject VO2max values on each apparatus presented as actual score. Outliers have been removed. Figure 3. Oxygen consumption presented as means with standard error for each apparatus. Outliers have been removed.