Procedure
Take advantage ofthe SmartArt
feature to easily display your text in
a visually appealing way.
Under the Insert tab, look for the
SmartArt button or simply click an
empty placeholder text box and
choose the display style that suits
your needs.
1 2 3
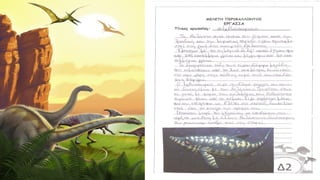
Δ2 τάξη
Εκπαιδευτικός Χρύσα ΚοκορίκουΣχολικό έτος 2018-2019
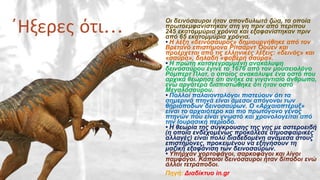
ΔΕΙΝΟΣΑΥΡΟΙ
΄Ηξερες ότι… Οιδεινόσαυροι ήταν σπονδυλωτά ζώα, τα οποία
πρωτοεμφανίστηκαν στη γη πριν από περίπου
245 εκατομμύρια χρόνια και εξαφανίστηκαν πριν
από 65 εκατομμύρια χρόνια.
• Η λέξη «δεινόσαυρος» δημιουργήθηκε από τον
Βρετανό επιστήμονα Ρίτσαρντ Όουεν και
προέρχεται από τις ελληνικές λέξεις: «δεινός» και
«σαύρα», δηλαδή «φοβερή σαύρα».
• Η πρώτη καταγεγραμμένη ανακάλυψη
δεινοσαύρου έγινε το 1676 από τον μουσειολόγο
Ρόμπερτ Πλοτ, ο οποίος ανακάλυψε ένα οστό που
αρχικά θεώρησε ότι ανήκε σε γιγαντιαίο άνθρωπο,
ενώ αργότερα διαπιστώθηκε ότι ήταν οστό
Μεγαλόσαυρου.
• Πολλοί παλαιοντολόγοι πιστεύουν ότι τα
σημερινά πτηνά είναι άμεσοι απόγονοι των
θηριόποδων δεινοσαύρων. Ο «Αρχαιοπτέρυξ»
είναι το αρχαιότερο και πιο πρωτόγονο γένος
πτηνών που είναι γνωστό και χρονολογείται από
την Ιουρασική περίοδο.
• Η θεωρία της σύγκρουσης της γης με αστεροειδή
(η οποία ενδεχομένως προκάλεσε ατμοσφαιρικές
αλλαγές) είναι πολύ διαδεδομένη ανάμεσα στους
επιστήμονες, προκειμένου να εξηγήσουν τη
μαζική εξαφάνιση των δεινοσαύρων.
• Υπήρχαν χορτοφάγοι, σαρκοφάγοι και λίγοι
παμφάγοι. Κάποιοι δεινόσαυροι ήταν δίποδοι ενώ
άλλοι τετράποδοι.
Πηγή: Διαδίκτυο in.gr
Data / Observations
4,3
2,4
2
Subject1 Subject 2 Subject 3
Use the Chart feature to quickly
show differences between results.
Under the Insert tab, look for the
Chart button or simply click an
empty placeholder text box and
choose the display style that suits
your needs.
Data / Observations
4,3
2,4
2
Subject1 Subject 2 Subject 3
Use the Chart feature to quickly
show differences between results.
Under the Insert tab, look for the
Chart button or simply click an
empty placeholder text box and
choose the display style that suits
your needs.
Data / Observations
4,3
2,4
2
Subject1 Subject 2 Subject 3
Use the Chart feature to quickly
show differences between results.
Under the Insert tab, look for the
Chart button or simply click an
empty placeholder text box and
choose the display style that suits
your needs.
Data / Observations
4,3
2,4
2
Subject1 Subject 2 Subject 3
Use the Chart feature to quickly
show differences between results.
Under the Insert tab, look for the
Chart button or simply click an
empty placeholder text box and
choose the display style that suits
your needs.
Data / Observations
4,3
2,4
2
Subject1 Subject 2 Subject 3
Use the Chart feature to quickly
show differences between results.
Under the Insert tab, look for the
Chart button or simply click an
empty placeholder text box and
choose the display style that suits
your needs.
Data / Observations
4,3
2,4
2
Subject1 Subject 2 Subject 3
Use the Chart feature to quickly
show differences between results.
Under the Insert tab, look for the
Chart button or simply click an
empty placeholder text box and
choose the display style that suits
your needs.
Data / Observations
4,3
2,4
2
Subject1 Subject 2 Subject 3
Use the Chart feature to quickly
show differences between results.
Under the Insert tab, look for the
Chart button or simply click an
empty placeholder text box and
choose the display style that suits
your needs.
Data / Observations
4,3
2,4
2
Subject1 Subject 2 Subject 3
Use the Chart feature to quickly
show differences between results.
Under the Insert tab, look for the
Chart button or simply click an
empty placeholder text box and
choose the display style that suits
your needs.
Data / Observations
4,3
2,4
2
Subject1 Subject 2 Subject 3
Use the Chart feature to quickly
show differences between results.
Under the Insert tab, look for the
Chart button or simply click an
empty placeholder text box and
choose the display style that suits
your needs.
Data / Observations
4,3
2,4
2
Subject1 Subject 2 Subject 3
Use the Chart feature to quickly
show differences between results.
Under the Insert tab, look for the
Chart button or simply click an
empty placeholder text box and
choose the display style that suits
your needs.
Data / Observations
4,3
2,4
2
Subject1 Subject 2 Subject 3
Use the Chart feature to quickly
show differences between results.
Under the Insert tab, look for the
Chart button or simply click an
empty placeholder text box and
choose the display style that suits
your needs.
Data / Observations
4,3
2,4
2
Subject1 Subject 2 Subject 3
Use the Chart feature to quickly
show differences between results.
Under the Insert tab, look for the
Chart button or simply click an
empty placeholder text box and
choose the display style that suits
your needs.
Data / Observations
4,3
2,4
2
Subject1 Subject 2 Subject 3
Use the Chart feature to quickly
show differences between results.
Under the Insert tab, look for the
Chart button or simply click an
empty placeholder text box and
choose the display style that suits
your needs.
Data / Observations
4,3
2,4
2
Subject1 Subject 2 Subject 3
Use the Chart feature to quickly
show differences between results.
Under the Insert tab, look for the
Chart button or simply click an
empty placeholder text box and
choose the display style that suits
your needs.
Data / Observations
4,3
2,4
2
Subject1 Subject 2 Subject 3
Use the Chart feature to quickly
show differences between results.
Under the Insert tab, look for the
Chart button or simply click an
empty placeholder text box and
choose the display style that suits
your needs.
Data / Observations
4,3
2,4
2
Subject1 Subject 2 Subject 3
Use the Chart feature to quickly
show differences between results.
Under the Insert tab, look for the
Chart button or simply click an
empty placeholder text box and
choose the display style that suits
your needs.
36.
Data / Observations
4,3
2,4
2
Subject1 Subject 2 Subject 3
Use the Chart feature to quickly
show differences between results.
Under the Insert tab, look for the
Chart button or simply click an
empty placeholder text box and
choose the display style that suits
your needs.
Πηγή-εικόνες και
πληροφορίες: Διαδίκτυο
Εργασία στη Μελέτη
Περιβάλλοντος
Σχολικό έτος 2018-2019
Δ2 τάξη
Εκπαιδευτικός Χρύσα Κοκορίκου
37.
Conclusions
You can alsomanually insert shapes into the presentation.
Conclusion 1 Conclusion 2 Conclusion 3
ΤΕΛΟΣ