1. R-trade, ymartemianov@gmail.com
Marginal Trading Robotic Kit (MTRkit) application trading robot SAGE
The trading robot SAGE provides with the completely automatic carry out of established set of strategy on the trading
account at the FXCM broker by the means of the corresponding broker API.
There are 44 trading strategies in EURUSD and GBPUSD in the suggested SAGE version.
SAGE needs to be installed on the client standard PC with internet connection; required space is 3-4 MB. FXCM API
tool FX2GO needs to be installed additionally only.
SAGE establishes connection with particular FXCM account.
SAGE trades periodically.
It does the following actions every time:
- Receives actual price data from FXCM data feed;
- Processes it using powerful Data Mining tools, generates trading orders;
- Executes orders through broker API.
The main criterion of a correct current of process of trade is the affinity of 2 curves - settlement and actual account
values of cumulated profit/loss within any time span.
The user has possibility to supervise trade process analyzing:
- A current market position;
- Reports on each currency pair and the total;
- Reports on any combination of strategy from available 44 including particular one.
The results of real trading in the connection with FXCM account represented below.
SAGE executes 3230 trades within the time span of 422 trading days since 1/12/2009 till 15/07/2011.
SAGE executes approx 8 trades daily in average.
Average gross profit/trade is 8.5 pips what is $8.5 for mini and $85 for standard contract.
Average net profit/trade is near 5.5 pips what is $5.5 for mini and $55 for standard contract.
Cumulative net profit since 1/12/2009 is 5.5pips*3230=17 765 pips what is $17 765 for mini and $177 650 for
standard contract.
ROI for 19.5 months is approx 177%. Year ROI is approx 112%. PF is equal 1.44
Max DD is near 5000pips in Feb-March at the time of North Africa and Fucusima events. It has been compensated in
the subsequent.
On graphs below 2 curves of cumulated PL values are presented. The first curve is settled by the robot at the prices.
The second - the report on perfected transactions on the account directly. Their coincidence convincingly confirms
efficiency of an automatic management system with the account which SAGE as a matter of fact is.
X-axis is time span of 422 trading days since 1/12/2009 till 15/07/2011 for settlement and 1/12/2009 till 2/03/2011
for account values. Account reporting after March, 2-nd stopped by any tech reasons of the reporting system.
Y-axis is cumulative profits-losses values in points (pips). 1 point is equal $1. Contract size is equal $10 000 (mini).
Initial deposit is equal $10 000.
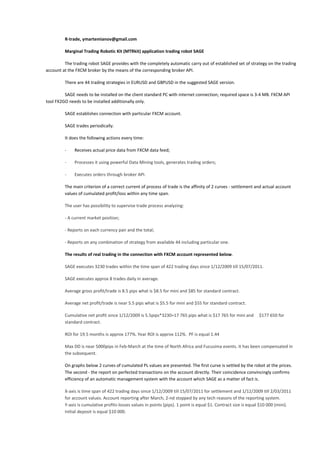
3. 25/03/2003 – 15/07/2011 settled PL curve, 2133 trading days, approx 9 years
16505 trades, net PL/trade = 13.3pips, net PL=219 517 pips
PF=2.22
approx Year ROI=220%
The marked point on the graph corresponds to 01/12/2009. This date starts the trading at the account. The left side from
marked point is so called learnig area where model parameters estimated and completed. The combined trading strategy was
designed there, another words. The right side from marked point is the life area where Robot realized this trading strategy in
the real conditions, circumstances in the connection with account.
How does correlate design performance figures with the real ones?
By PF 1.6/2.3=0.73
By ROI 112%/220%=0.51
We see that real performance is approx 50-75% of designed value what is enough good for that kind of automatic controlling
systems.
SageTuner
Compulsory condition of SAGE experimental testing is the invariance of initially established parameters of system. This
circumstance is connected with obvious properties of robotic systems which SAGE is. During tests the analysis of efficiency of
diverse predictive algorithms ensuring generation of trading orders is led. The module was compiled in the July 2009, since then
any changes was not introduced. The hand control was not supposed and it is not supposed.
Not all users are imposed by such cybernetic radicalism. Special tool SageTuner does internal structure SAGE transparent and
ensures the performance control of each of 44 strategies entering into it. Possibility of drawing up optimum by some criteria of
a combination of strategy automatically and in a manual mode is provided.
For example, the exception of three stably unprofitable since December of 2009 strategy from 44 increases gross profit/trade
to 11.5 pips, net profit/trade to 8.5 pips. Net profit/loss increases from 17 765 pips up to 25 055 pips, Year ROI from 112 % up
to 158 %. North African and Fucusima DD in February - March decreases almost on 2000 pips. The losses which have appeared
in July, connected with unusual volatility because of discussion of a possible USA default and euro zone crisis, unfortunately, do
not decrease. Such actions contradict logic of strict research experiment, but quite correspond with common sense in a custom
of trade.
4. SAGE 41 Cumulative PL curve settled by SAGE, 1/12/2009 – 15/07/2011
SAGE41 25/03/2003 – 15/07/2011 settled PL curve, 2133 trading days, approx 9 years
PL curves of the excluded strategy 12/01/2009 – 15/07/201
s48 eurusd