VIP Independent Call Girls in Taloja 🌹 9920725232 ( Call Me ) Mumbai Escorts ...
Nirma Limited Capital Expenditure Plans
1. Nirma Limited-Capital Expenditure Plans
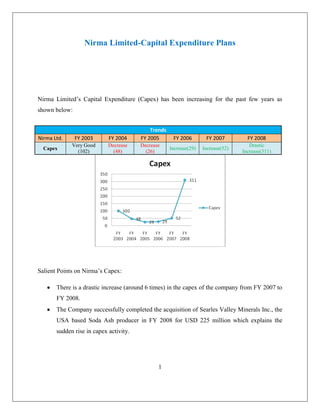
Nirma Limited’s Capital Expenditure (Capex) has been increasing for the past few years as
shown below:
Trends
Nirma Ltd. FY 2003 FY 2004 FY 2005 FY 2006 FY 2007 FY 2008
Very Good Decrease Decrease Drastic
Capex Increase(29) Increase(52)
(102) (48) (26) Increase(311)
Salient Points on Nirma’s Capex:
There is a drastic increase (around 6 times) in the capex of the company from FY 2007 to
FY 2008.
The Company successfully completed the acquisition of Searles Valley Minerals Inc., the
USA based Soda Ash producer in FY 2008 for USD 225 million which explains the
sudden rise in capex activity.
1
2. With this acquisition, the Company has become one of the largest producers of soda ash
in the world, with a combined soda ash capacity of nearly 2 million tpa. and has started
establishing a strong presence in the international market.
The Company has six plants, mostly located in backward areas of Gujarat.
The company has investments in Government Securities, Equity Shares, Debentures and
in shares of subsidiary companies- Karnavati Holdings Inc. and Nirma Consumer Care,
which forms around 87% of the total investments of worth Rs. 45.85 Crores in FY 2008.
The Company has multiple product lines with principal products as Detergents, Soaps and Edible
Salt. As a part of the integration strategy the Company has, in stages, set up facilities to
manufacture the required key raw materials. Its strong backward-integrated operations are a
source of a strong competitive advantage. Accordingly, the plants have already been set up to
manufacture N-Paraffin, Linear Alkyl Benzene, Linear Alkyl Benzene Sulphonate, Sulfuric
Acid, Alpha Olefin sulphonate, Glycerine, Fatty Acid and printing and packing facilities for
Detergents, Soaps and Salt. Soda Ash and Industrial Salt are other key products of the Company.
The products being manufactured at Healthcare division include I.V. fluid, Injectable, Medical
devises and I.V. sets.
The various Capex projects by Nirma (on-hand) are tabulated below:
Nirma Ltd. Capacity
Cost (Rs.
Project Name Location Product Tonnes/day Tonnes/annum Status
Crore)
Sodium
Soda Ash Under
Porbandar GUJ 300 carbonate (Soda 1200 438,000
Project Implementation
Ash)
Caustic Soda Kalatalav Sodium hydroxide Under
170 40 14,600
Project Bhavnagar GUJ (Caustic Soda) Implementation
Pure Water Kalatalav Under
80 Waters 80 29,200
Project Bhavnagar GUJ Implementation
Mahua Bhavnagar
Coke Project 100 Electricity Unit 1 30 Mw - Announcement
GUJ
Out of the above projects, let us consider the case of the Soda Ash Project for analysis of Capex
Plans of Nirma.
2
3. Nirma’s Soda Ash Project
Type of project:
Expansion of capacity of the existing plant in Porbandar of 650,000 tpa by approx. 450,000 tpa
to a total capacity of 1,100,000 tpa.
Soda Ash Industry in India:
The performance of India's Rs.22-billion Soda Ash industry depends heavily on end user
segments, such as glass and detergents. Driven by the high growth in the construction industry
(key consumers of glass), Soda Ash demand in India is estimated to have registered a
compounded annual growth rate (CAGR) of 4 to 5 percent during the past five years. Indian
Soda Ash prices will continue to be linked to international prices, which were depressed until
2004. However, due to growing demand and limited capacity additions, prices are picking up
steadily. The Company is second largest producer of Soda Ash in India.
Soda Ash is a basic input for glass, detergent and other chemicals. With the strong economic
development and growth in automobile and housing sector, the demand for Soda Ash likely to
grow at a CAGR of 5% in the coming years. During the financial year 2007-08, the Detergent,
Soaps, Soda Ash and LAB continued to be leading products for the company.
Nirma’s Soda Ash Projects- A Snapshot:
Nirma Ltd.
Project Name Soda Ash Project 1 Soda Ash Project 2 Soda Ash Project 3
Project Status Completed Completed Under Implementation
Project Cost (Rs. Crore) 1037 95.73 300
Event (1) Date of announcement Date of announcement Date of announcement
Date (1) 1995.06.01 2001.09.01 2007.01.13
Event (2) Expenses incurred till Expenses incurred till MoU signed
Date (2) 1997.06.10 2002.03.31 2007.01.13
Event (3) Completed Completed Completion by
Date (3) 2000.09.30 2002.09.30 2009.04.30
Event (4) Commercial Prod Commercial Prod
Date (4) 2000.09.30 2002.09.30
* The current capacity of the Soda Ash Plant is 650,000 TPA.
3
4. The past trends in Soda Ash Production and Turnover by Nirma are tabulated below:
Soda Ash 2004-2005 2005-2006 2006-2007 2007-2008
Capacity (tpa) 650,000 650,000 650,000 650,000
Production (Tonnes) 542,378 527,912 465,364 358,742
Turnover (Tonnes) 545,459 519,206 474,864 351,958
Turnover (Rs.) 270.81 323.19 395.65 341.62
Observations:
Both the production and the turnover (in tonnes) have been falling for the past few
years for Soda Ash.
Turnover (in Rs.) has been rising, with a slight fall in FY 2008 clearly indicating
that company’s operational efficiency is improving.
Assumptions for analysis of the project:
The life of the project is assumed to be around 6 years (considering the fact
the company increased its capacity by nearly 70 % after 7 years from 2002).
After 7 years, either a new project to increase the capacity will have to be
introduced (depending on the status of the demand for Soda Ash) or the plant
will have to be scrapped off.
4
5. The demand for Soda Ash likely to grow at a CAGR of 5% in the coming
years. The turnover is expected to grow @ 10% pa in the first few coming
years (considering the fact that now Nirma has become a global player);
however, with the increased competition, the turnover increase would reduce
towards the last few years.
The operating margin is assumed to be 20% considering the fact that with the
acquisition of SVM, Nirma is expected to improve its operations by in-
sourcing the advanced technology.
Depreciation on fixed assets is provided on Straight Line method.
Tax rate is assumed to be @ 33 %.
Total Capex cost = Rs. 300 Crore (Including Working Capital)
Nirma Limited Capex (All Fig. in Rs. Crores) 2009 2010 2011 2012 2013 2014 2015
Nirma Limited Additional Sales 300 330 363 399.3 359.37 323.433
Estimated operating margins 20% 20% 20% 20% 20% 20%
Initial Investment
Fixed Asset Investment -240
Working Capital Investment -60
Periodic Cash Flows
Depreciation -40 -40 -40 -40 -40 -40
Change in Operating Profit before Tax Due
to Capex 60.00 66.00 72.60 79.86 71.87 64.69
Tax @ 33% 19.80 21.78 23.96 26.35 23.72 21.35
Profit after Tax 40.20 44.22 48.64 53.51 48.16 43.34
Operating Free Cash Flow 80.20 84.22 88.64 93.51 88.16 83.34
Terminal Value 60
5
6. FY 2009 2010 2011 2012 2013 2014 2015
Free Cash Flow -300 80.20 84.22 88.64 93.51 88.16 143.34
Thus, we have:
Payback period= Around 3.5 years
NPV @ 15.5 %= Rs.45.91 Crores
IRR = 21%
PI= 1.15
Comments:
The NPV of the project is positive.
The IRR is greater than the discount rate (assumed to be around 15%)
PI > 1
Hence, Nirma should go ahead with the project
References:
1. Nirma’s Annual Reports
2. CMIE-PROWESS
3. www.nirma.co.in
6