Got a Unique Sales and Operations Planning (S&OP) Process? There's an App For That [Part 1]

Steelwedge Agility Webinar Series Featured Presenters - Blake Johnson, Ph.D, Management Science & Engineering Department, Stanford University and Ed Lewis, Vice President, Product Management, Steelwedge Is part of your company’s competitive advantage captured in unique processes and KPIs that you can’t manage in your planning systems? Like your iPhone, your business’ planning system should allow business planners, partners, and others to build simple ‘apps’ on top of it. Apps that enable you to embed and scale your unique capabilities and processes, and rapidly evolve them as your business and its needs change. During this webinar, hear from Stanford educator and supply chain innovator, Dr. Blake Johnson, about the growing imperative to implement and scale differentiating planning capabilities. Discuss the benefits of an S&OP foundation that can be easily augmented –and automated-- with emerging best practice processes and your company’s otherwise unique “off-line” processes. Join us to learn: • How to identify opportunities to leverage a planning system to accommodate inevitable changes in your business • How to connect and scale your company’s ‘secret sauce’ processes with your planning system • Examples of emerging best practice planning apps: range forecasting, segmentation, demand policy and stocking strategy • How to implement an iPhone-like apps on your S&OP planning platform to not only support, but flex with your company’s processes. For more information about S&OP and how Steelwedge can help your business, please visit: http://www.steelwedge.com/resources/sales-and-operations-planning-intro/

Recommended
Recommended
More Related Content
More from Steelwedge
More from Steelwedge (20)
Recently uploaded
Recently uploaded (20)
Got a Unique Sales and Operations Planning (S&OP) Process? There's an App For That [Part 1]
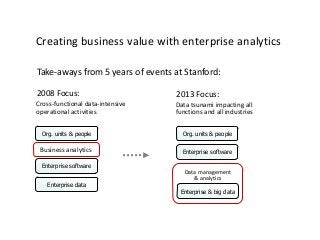
- 1. Take-aways from 5 years of events at Stanford: 2008 Focus: 2013 Focus: Enterprise software Enterprise data Org. units & people Enterprise software Enterprise & big data Org. units & people Data management & analytics Cross-functional data-intensive operational activities Data tsunami impacting all functions and all industries Creating business value with enterprise analytics Business analytics
- 2. 1. Enable direct business user access to enterprise data 2. Central analytics team for critical mass + members in each business function 3. Blur boundary between business and IT Enterprise & Big data Org. units & people Enterprise software Creating business value with enterprise analytics 2013 best practice: Focus on data Three critical enablers: What’s missing? - Data-centric: Data access is foundational, but not a solution in itself - Still need to enable collaboration, business processes & integration with enterprise software Evolve paradigm to encompass all three solution elements
- 3. Expensive, inflexible functionality and data access Standardized – not a source of competitive differentiation Enabling analytic “apps” at the organization and enterprise software layers Current status and challenges: Enabler #1: Connect Excel and enterprise software “data islands” Steelwedge “Enterprise Excel” interface Enterprise software Enterprise data Org. units & people EXCEL! Valuable, but “non-enterprise” data and analytics - Pros: Familiar, flexible, customizable - Cons: Non-scalable, non-integrated, non-collaborative Enabler #2: Open enterprise software data and “process enablement” to analytics Steelwedge “Open Apps” architecture “Enterprise Excel” interface “Open Apps” architecture
- 4. Mobile phone analogy Carrier software Texts Enterprise software Excel Apple iOS Apps explosion Role and value of phone transformed Open Apps S&OP transformed? Will other enterprise software providers follow suit? “Enterprise Excel” interface
- 5. - Shortages - Inventory and liability - Poorly utilized capacity - Expediting and overtime Profits Revenues Costs Material cost Write-downs / write-offs Inventory holding costs Income statement Profits Revenues Costs Material cost Write-downs / write-offs Inventory holding costs Income statement Assets Inventory Balance sheet Liabilities Material liabilities Capacity Assets Inventory Balance sheet Liabilities Material liabilities Capacity Too muchCost Too little - Ours - Customers - Suppliers - Commitments - Coordination Plan Reality Operating performance - Re-planning - Re-coordinating - Constraints - Fire-fighting - Cost and conflict - Damaged relationships - Income statement and balance sheet impact - Lack of control - Lack of accountability It’s an Uncertain World Financial performance Plans and performance management based on “best guess” forecasts create risk and lost opportunity AZTRAL
- 6. Range Forecasts and Planning: What is the right type and amount of flexibility? “Bucket” at end of “supply chain pipe” Inventory “Supply chain pipe” Capacity Materials Production Finished goods Forecast accuracy lower further in future Planning flexibility should be sized to match forecast uncertainty - Unless forecast accuracy = 100%, flexibility is required to match supply and demand 90th 75th 25th 10th Forecast error percentile Benefits of proactively planning for forecast uncertainty: AZTRAL - Ability to capture opportunity - Reduced risk and liability
- 7. Range Forecasts and Performance Management 1. Create “menu” of performance alternatives for key stakeholders 2. Agree on best choice and establish alignment and accountability Demand Demand Vs. “Risk aware” S&OP process: “Range” performance management Plan Demand Today: Flying blind Service level 98% Inventory $2M Cost $11M Gross margin $3M Liability $1.2M Low Plan High ? ? ? ? ? ? Service level 98% Inventory $2M Cost $11M Gross margin $3M Liability $1.2M Low Plan High ? ? ? ? ? ? Service level 100% 99% 97% Inventory $2.2M $1.8M $0.3M Cost $8.3M $11.3M $13.7M Gross margin $2.5M $2.9M $4.1M Liability $2.1M $0.8M $0.3M Low Base High Service level 100% 99% 97% Inventory $2.2M $1.8M $0.3M Cost $8.3M $11.3M $13.7M Gross margin $2.5M $2.9M $4.1M Liability $2.1M $0.8M $0.3M Low Base High Service level 100% 99% 95% Inventory $3.1M $2.0M $0.1M Cost $8.0M $11.0M $13.4M Gross margin $2.6M $3.0M $3.8M Liability $2.5M $0.8M $0.3M Low Base High Service level 100% 99% 95% Inventory $3.1M $2.0M $0.1M Cost $8.0M $11.0M $13.4M Gross margin $2.6M $3.0M $3.8M Liability $2.5M $0.8M $0.3M Low Base High Benefits of including forecast uncertainty in performance management: - Quantify and manage performance risks and trade-offs - Ensure “no surprises, no excuses” alignment and accountability AZTRAL