VisualOptions: software for option traders
•
3 likes•1,789 views

Software for option traders Risk curves Daily historical volatility Implied volatility extremes and skews Unusual volume reports Expected returns And other drivers of option dynamics

Recommended
Recommended
More Related Content
Recently uploaded
Recently uploaded (20)
Featured
Featured (20)
VisualOptions: software for option traders
- 1. Spot and analyze unusual option activity • Spot unusual option activity. • Scans the entire market looking for unusual volume (every hour), analyzing the last prices, volume, open int, theoretical price, and all greeks. • With a simple way, the system allows to analyzes any unusual activity. VisualOptions 1
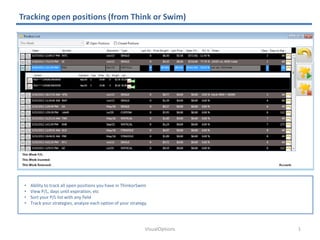
- 2. Tracking open positions (from Think or Swim) • Ability to track all open positions you have in ThinkorSwim • View P/L, days until expiration, etc • Sort your P/L list with any field • Track your strategies, analyze each option of your strategy. VisualOptions 2
- 3. Risk Profile charts • Analyze any strategy with risk profile chart. • Evaluates different environments of the strategy (stock change, IV change, etc) VisualOptions 3
- 4. Option Chain • Analyze the option chain. • Get information from different sources • Able to analyze each particular contract VisualOptions 4
- 5. Option Contract analysis • Analyze an specific option contract. • Historical prices • Historical Volume & Open Interest • Historical Volatilities: HV and IV • Historical Geeks • Historical quote list VisualOptions 5
- 6. Put/Call ratio • View Put/Call ratio of any symbol. • OI Put/Call ratio • Volume Put/Call ratio VisualOptions 6
- 7. Historical Volume & OI of the entire chain • View historical data of Volume and OI of the entire option chain • This chart allows to identify unusual activity VisualOptions 7
- 8. Analysis of different variables (IV skew, Greeks, etc) • Analyze IV skew and other variables VisualOptions 8
- 9. News of any symbol • Get news from different sources • Google news • Yahoo news • Twitter • Yahoo Communities • Hear what they are saying about a stock VisualOptions 9