1. STEEL INDUSTRY ANALYSIS
1. Industry trends: Indian and Global perspectives, recent happenings.
Steel is the back bone of human civilization, it is very crucial in development of a modern economy. The
per capita consumption of steel shows the living standard of people in any country.
Global Perspective: The industry directly employs about more than two million people worldwide, with a
further two million contractors and four million people in the supporting industries. Considering steel’s
position as the key product supplier to industries such as automotive, construction, transport, power and
machine goods, and using a multiplier of 25:1, the steel industry is at the source of employment for more
than 50 million people.
World crude steel production has increased from 851 mega tonnes (Mt) in 2001 to 1,527 Mt in 2011. (It
was 28.3 Mt in 1900).World average steel use per capita has steadily increased from 150 kg in 2001 to
215 kg in 2011. India, Brazil, South Korea and Turkey have all entered the top 10 steel producers list in
the last 40 years.
World Steel in Figures 2012
The World Steel Association (world steel) has published the 2012 edition of World Steel in Figures.
World Steel in Figures provides essential facts and statistics about the global steel industry. The book
contains comprehensive information on crude steel production, apparent steel use, pig iron production,
steel trade, iron ore production and trade, and scrap trade.
World Steel in Figures lists major steel-producing countries, top steel-producing companies, and top
steel-consuming countries.
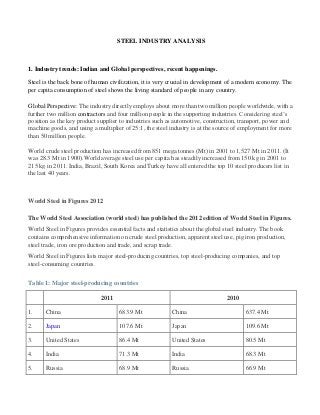
Table 1: Major steel-producing countries
2011 2010
1. China 683.9 Mt China 637.4 Mt
2. Japan 107.6 Mt Japan 109.6 Mt
3. United States 86.4 Mt United States 80.5 Mt
4. India 71.3 Mt India 68.3 Mt
5. Russia 68.9 Mt Russia 66.9 Mt
2. Table 2: Top steel-producing companies
2011
1. Arcelor Mittal 97.2 Mt 6 Nippon Steel 33.4 Mt
2. Hebei Group 44.4 Mt 7 Shagang Group 31.9 Mt
3. Baosteel Group 43.3 Mt 8 Shougang Group 30.0 Mt
4. POSCO 39.1 Mt 9 JFE 29.9 Mt
5. Wuhan Group 37.7 Mt 10 Ansteel Group 29.8 Mt
Table 3: Countries with the highest apparent steel use per capita
2011
1. South Korea 1,156.6 kg 6 Austria 473.1 kg
2. Taiwan, China 784.4 kg 7 China 459.8 kg
3. Czech Republic 595.7 kg 8 Italy 459.5 kg
4. Japan 506.7 kg 9 Sweden 424.5 kg
5. Germany 479.6 kg 10 Belgium-Luxembourg 422.5 kg
Indian Perspective:
At the time of independence, India had a small Iron and Steel industry with production of about a Million
tonnes (mt). In due course, the government was mainly focusing on developing basic steel industry,
where crude steel constituted a major part of the total steel production. Many public sector units were
established and thus public sector had a dominant share in the steel production till early 1990s. Mostly
private players were in downstream production, which was mainly producing finished steel using crude
steel products. Capacity ceiling measures were introduced. Basically, the steel industry was developing
under a controlled regime, which established more public sector steel companies in various segments.
Till early 1990s, when economic
liberalizationreforms were introduced, the steel industry continued to be under the control of IndianGover
nment, regulation were constituted such as large plant capacities were reserved only for public sector
under capacity control measures; price regulation; for additional capacity creation producers had to take
license from the government; foreign investment was restricted; and there were restrictions on imports as
3. well as exports. But after liberalization many reforms and regulation were changed which brought the
new era for development in steel industry. Some of the major developments were :
1. Large plant capacities that were reserved for public sector were removed;
2. Export restrictions were eliminated;
3. Import tariffs were reduced from 100 percent to 5 percent;
4. Decontrol of domestic steel prices;
5. Foreign investments was encouraged, and the steel industry was part of the high priority
industries for foreign investments implying automatic foreign equity participation up to 100
percent; and
6. System of freight ceiling was introduced in place of freight equalization scheme. Due to this,
the domestic steel industry has since then, become market oriented and integrated with the global
steel industry. This has helped private players to expand their operations and bring in new cost
effective technologies to improve competitiveness not only in the domestic but also in the global
market.
The Indian steel industry comprises of the producers of finished steel, semi-finished steel, stainless steel
and pig iron. Indian steel industry, having participation from both public sector and private sector
enterprises, is one of the fastest growing markets for steel and is also increasingly looking towards
exports as driving the growth of the industry.
Indian steel Industry Structure:
Indian iron and steel industry can be divided into two main sectors: Public sector and Private sector.
Further on routes of production it can be classified as: Integrated producer which convert iron ore into
steel e.g. SAIL, TISCO, etc and Secondary producer which make steel from sponge iron or scrap e.g.
ISPAT Industries, Essar.
Key Drivers of Steel Industry
India accounts for around 5 per cent of the global steel consumption. Almost 70 per cent of the total steel
used is for kitchenware. However, its use in railway coaches, wagons, airports, hotels and retail stores is
growing immensely.
Construction:
The construction industry has been witnessing a growth rate of 12%-14% in recent times. Steel
construction is now identified with speed and since India is in need of speedy project implementation,
steel is the best alternative for fast track construction. With economy surging ahead and expected increase
in income levels of population, it is believed that demand for steel from this sector will continue to grow
at current rates if not improve
4. Automobile:
The domestic automobile industry has also grown at more than double-digit rates in the past five years.
The Indian automobile sector is the second fastest growing market after
Chinaand has emerged as a prime demand driver for alloy steel. Automobile sector which isexperiencing
growth and competition is likely to be one of the major drivers for steelconsumption in the coming years
and most likely, its contribution in the overall demand pie is likely to improve from the current levels.
Auto components Industry:
During the last five years, auto components market has grown at19% CAGR, led by both robust domestic
demand as well as exports. India is fast emerging
ashub for auto components. International companies such as General Motors, Ford, Daimler Chrysler,
Toyota and Volkswagen are outsourcing auto parts from India as it has cost advantage with regard to
forgings and castings. Also, the growing domestic automobile industry, which relies on steel industry for
its parts manufacturing, will enhance the demand for steel in India.
Infrastructure:
Infrastructure sector comprises of roads, railways, airports and power. The 11thFive-year plan has lined
up huge investments in all the above related sectors of infrastructure. The sector wise anticipated
investment are $200bn in power, $80bn in railways, $48bn in roads,$13bn in ports and $9bn in airports.
Because of surge in the above activities, the demand for long products of steel will be increasing in years
ahead.
Consumer Durables:
The consumer durables sector has also been witnessing robust growth. It has grown at an average of 10%
per annum and is expected to grow at double-digit rates for coming years. The share of white goods and
utensils is predominant in India. The domestic appliances market which includes spin driers of washing
machine, thermo ware, water filters, dishwashers, microwave ovens, catering equipments, cutlery,
furniture etc have opened new opportunities for steel consumption, thus ensuring a steadily growing
trend of steel off take.
Oil & Gas Industry:
Oil & gas sector is the major consumer of steel tubes and pipes. The pipe consumption in oil & gas sector
is expected to grow at a rate of 25% CAGR as this sector is set to witness massive capital investment.
Apart from laying cross-country pipelines, exploration and production activities are also
experiencing strong growth in both international as well as domestic markets.
5. 2. PEST Analysis
Political Factors: It includes a lot of policies given by the Indian steel ministry; it includes industrial
policies, electricity policies, national mineral policies, foreign trade policies, environmental policies, etc.
there are also other factors including government ownership at local and national levels and other
legislations and licenses involved.
The Government has approved the National Steel Policy (NSP) in November 2005.The long-term goal of
the NSP is for India to have a modern and efficient steel industry of world standards. The focus of the
policy is to achieve global competitiveness not only in terms of cost, quality and product-mix but also in
terms of global benchmarks of efficiency and productivity. The policy targets to increase steel production
at a compounded annual growth rate of 7.3% to 110 mt by 2019-2020. It projects domestic consumption
to grow at annual growth rate of 6.9% to 90 mt during this period. The policy envisages the share of
exports to increase to 25% from present share of 10%
100% FDI is allowed under the automatic route for metallurgy and processing of all metals.
Economic Factors:
Inflation: the inflation has grown to about 7.25 percent so there is rise in price of all the goods, and also
production efficiency has decreased.
Currency fluctuation and exchange rates: With increase in the value of dollar, the industry needs to give a
large amount in exchange rates. Moreover there is a rise in price of crude oil and has cost transportation
charges to increase
Economic Crisis: due to economic crisis in Europe led to decrease in demand of finished goods in the
foreign market and has led to a trade deficit.
Consumer expenditure: Due to high inflation rate the prices of product has increased leading to more
expenditure of the customer.
Social Factors: shift in value and culture of people, a positive attitude towards work, green environment
issue, product safety issue, employment and safety laws
Technological Factors: There is a need for new government investment policies. New patents and
products for extracting ores, manufacturing purpose should be implemented where ever necessary to
rapid the pace and improve quality of the products. The current level of investment in R&D in the Indian
Steel Plants is less than 0.24% of their total turnover. In order to encourage R&D activities in Iron and
Steel sector, Ministry of Steel is providing financial assistance.
3. Competitor Analysis:
The Major competitors to steel industry are plastic industry, alluminium industry and cement industry.
Though their cheap prices they cannot replace steel in essential products like automobile, machineries
6. and in construction of bridges and other infrastructure. Although a small sector of steel is affected by
plastic industry as steel is replaced by plastic in some kitchenware articles, and furnitures.
4. SWOT Analysis
Strengths
Availability of iron ore and coal: India has abundance of iron ore, coal & other rawmaterials required for
iron & steel making. It has 4th largest iron ore reserves (13 bn tons)in the world.
Low labor wage rates: India has low unit labor cost, this gets reflected in low cost of production
Abundance of quality manpower: It has 3rd largest pool of technical manpower, next
toUnited States & erstwhile USSR, capable of understanding and assimilating newtechnologies.
Mature production base
Weakness
Unscientific mining: India is deficient in raw materials required by the steel industry. Iron ore deposits
are finite and there are problems in mining sufficient amounts of it. India's hard coal deposits are of low
quality
Low productivity: According to an estimate crude steel output at the biggest Indian steel maker is
roughly 150 tonnes per worker per year, whereas in Western Europe the figure is around 600 tonnes.
Power shortages: Steel production in India is also hampered by power shortages.
Inadequate infrastructure: Insufficient freight capacity and transport infrastructure hamper the growth of
Indian steel industry
Low R&D investments: There are inadequate investments in infrastructure.
Lack of best quality and trained professionals has been a major drawback.
High cost of debt: Since huge capital investment is required therefore cost of these debts is very high.
Opportunities
Unexplored rural market: The Indian rural market remains fairly unexposed to the multi-faceted use of
steel.
Growing domestic demand: There is enormous scope for increasing consumption of steel in almost all
sectors in India.
7. Export Market Penetration: It is estimated that world steel consumption will double in next 25yrs.
Quality improvement of Indian steel combined with low cost advantages will definitely help in
substantial gain in export market
Consolidation: As global companies have realized the threat of excess supply, they are looking at M&A
(mergers and acquisitions) option to retain market share and improve margins.
Threats
Technological change: Technological changes force the industry structure to change. In India where
capital itself is costly, technological obsolescence is a major threat.
Price sensitivity & Demand volatility: The demand for steel is derived demand and the purchase quantity
depends on end-use requirements. The traders are price sensitive and buy when there are discounts.
Dumping of steel by developed countries: High quality products for developed countries available for
imports at competitive prices.
Slow Industry Growth
8. JSW ISPAT STEEL LTD. COMPANY ANALYSIS
1. About:
Ispat Industries Limited (IIL) is one of the leading integrated steel makers and the largest private sector
producer of hot rolled coils in India. Set up as Nippon Denro Ispat Limited in May 1984 by founding
Chairman Mr. M L Mittal, IIL has steadily grown into a Rs 9,400-crore company, assuming its position
as flagship of the reputed Ispat Group. A corporate powerhouse with operations in iron, steel, mining,
energy and infrastructure, the Group today figures among the top 20 business houses in the country.
On 21 December 2010 JSW Steel bought interest in Ispat Industries at an enterprise value of $3 billion to
emerge as India's largest producer of the commodity with an annual capacity of 14.3 million tonnes. The
company’s name thus changed to JSW Ispat Steel Ltd.
2. Headquarter: Mumbai.
3. Total number of Employees: 3000
4. Top Management and H.O.D
Mr. Sajjan Jindal: Chairman
Mr. Vinod Mittal: Vice Chairman
Mr. B K Singh Chief Executive Officer
Mr. Ashok Aggarwal Joint Chief Executive Officer
Mr. Rajesh Asher Executive Director (Corporate)
Mr. Ashok V Bharadwaj Director (Marketing)
Mr. Alok Chandra Chief Operating Officer
Mr. T P Subramanian President & Company Secretary
Mr. Nilesh Dattani President (SCM)
Mr. B K Das Senior Vice President (Projects)
5. The company is listed on Bombay Stock Exchange and National Stock Exchange of India
BSE:500305 | NSE:JSWISPAT | ISIN 136A01022
Market Cap: Rs 2824 crore
Industry: Steel(Large)
9. 6. Share Holding Pattern (in %):
CATEGORY OF NO. OF TOTAL TOTAL NO. OF TOTAL SHARES
SHAREHOLDER SHARE- NO. SHARES HELD IN SHAREHOLDING PLEDGED O
HOLDERS OF DEMATERIALIZED AS A % OF OTHERWISE
SHARES FORM TOTAL NO. OF ENCUMBER
SHARES NUMBER OF
AS A % OF SHARES
(A+B) AS A % OF
AS A % OF TOTAL
(A+B+C) NO. OF SHAR
(A) Shareholding of Promoter and Promoter Group
(1) Indian
Individuals / 3 6,441,236 6,441,236 0.27 0.27 1,329,236
Hindu
Undivided
Family
Bodies 29 1,394,274,230 1,394,274,230 58.42 58.42 210,831,738
Corporate
Sub Total 32 1,400,715,466 1,400,715,466 58.69 58.69 212,160,974
(2) Foreign
Individuals 1 677,576 677,576 0.03 0.03 -
(Non-Residents
Individuals /
Foreign
Individuals)
Bodies 8 269,071,893 265,731,093 11.27 11.27 265,569,489
Corporate
Sub Total 9 269,749,469 266,408,669 11.30 11.30 265,569,489
Total 41 1,670,464,935 1,667,124,135 69.99 69.99 477,730,463
shareholding of
Promoter and
Promoter
10. Group (A)
(B) Public Shareholding
(1) Institutions
Mutual Funds / 17 2,302,464 1,334,151 0.10 0.10 -
UTI
Financial 43 105,128,167 105,123,214 4.40 4.40 -
Institutions /
Banks
Central 1 12,768 12,768 - - -
Government /
State
Government(s)
Insurance 8 48,308,107 48,297,989 2.02 2.02 -
Companies
Foreign 46 51,232,966 51,225,826 2.15 2.15 -
Institutional
Investors
Sub Total 115 206,984,472 205,993,948 8.67 8.67 -
(2) Non-
Institutions
Bodies 2,841 105,515,534 105,427,985 4.42 4.42 -
Corporate
Individuals - - - - -
Individual 291,782,891 281,836,889 12.22 12.22 -
shareholders
holding nominal 709,605
share capital up
to Rs. 1 lakh
12. Total Public 721,184 716,334,195 703,106,501 30.01 30.01 -
shareholding
(B)
721,225 2,386,799,130 2,370,230,636 100.00 100.00 477,730,463
Total (A)+(B)
(C) Shares held - - - - - -
by Custodians
and against
which Depository
Receipts have
been issued-m
(1) - - - - -
(2) - - - - -
Sub Total - - - - -
Total 721,225 2,386,799,130 2,370,230,636 - 100.00 477,730,463
(A)+(B)+(C)
7. Major units
1. Integrated Steel Plant at Dolvi, Maharashtra. The Dolvi complex has a captive port located close to it
on the Amba River, which opens into the Arabian Sea. This port can handle barges and mini-bulk carriers
up to 4000 dry weight tonnage (DWT). Moreover, a jetty adjoining the complex is capable of handling
cargo of up to 10 million tonnes per annum.
Manufacturing Facilities:
DRI - Sponge Iron Plant
Blast Furnace
Compact Strip Production
2. Integrated Steel Plant at Kalmeshwar, Maharashtra The integrated steel plant at Kalmeshwar uses the
latest steel manufacturing technology to produce galvanized sheets and products, apart from cold rolled
coils. The Kalmeshwar complex houses a total of three advanced plants - a 0.325 million tonnes
13. Galvanized Plain/Galvanized Corrugated plant, a 0.33 million tonne Cold Rolled Coils plant and a 60,000
tonne Color Coated Sheets plant.
Manufacturing Facilities
Cold rolling mill
Galvanizing line
Color coating line
BALANCE SHEET
Balance Sheet of JSW ISPAT Steel ------------------- in Rs. Cr. -------------------
Jun '11 Jun '10 Mar '09 Mar '08 Mar '07
12 mths 15 mths 12 mths 12 mths 12 mths
Sources Of Funds
Total Share Capital 3,354.92 2,225.09 2,272.51 2,294.03 2,288.74
Equity Share Capital 2,386.09 1,221.71 1,221.65 1,221.58 1,218.40
Share Application Money 150.96 18.00 51.98 0.00 0.00
Preference Share Capital 968.83 1,003.38 1,050.86 1,072.45 1,070.34
Reserves -2,363.82 -1,630.42 -1,363.05 -544.34 -587.07
Revaluation Reserves 884.34 965.94 1,070.44 1,151.92 1,240.00
Networth 2,026.40 1,578.61 2,031.88 2,901.61 2,941.67
Secured Loans 5,911.10 7,156.90 7,150.81 6,940.05 7,849.07
Unsecured Loans 1,021.66 24.85 200.24 284.99 466.43
Total Debt 6,932.76 7,181.75 7,351.05 7,225.04 8,315.50
Total Liabilities 8,959.16 8,760.36 9,382.93 10,126.65 11,257.17
Jun '11 Jun '10 Mar '09 Mar '08 Mar '07
12 mths 15 mths 12 mths 12 mths 12 mths
Application Of Funds
Gross Block 13,438.70 13,456.02 13,557.39 13,167.93 13,067.37
Less: Accum. Depreciation 6,193.56 5,528.67 4,669.58 3,961.92 3,244.04
Net Block 7,245.14 7,927.35 8,887.81 9,206.01 9,823.33
Capital Work in Progress 61.86 63.73 102.71 108.25 54.68
14. Investments 163.42 229.37 232.89 118.04 113.59
Inventories 2,040.56 1,934.17 1,382.93 1,368.38 1,056.19
Sundry Debtors 394.57 758.97 560.09 579.83 645.02
Cash and Bank Balance 1.64 23.27 3.03 3.30 252.43
Total Current Assets 2,436.77 2,716.41 1,946.05 1,951.51 1,953.64
Loans and Advances 2,390.42 1,761.15 1,881.55 1,457.67 1,402.46
Fixed Deposits 594.24 179.79 75.89 89.22 75.22
Total CA, Loans & Advances 5,421.43 4,657.35 3,903.49 3,498.40 3,431.32
Deffered Credit 0.00 0.00 0.00 0.00 0.00
Current Liabilities 3,351.80 4,080.93 3,708.97 2,770.71 2,136.94
Provisions 580.89 36.51 35.00 33.34 28.81
Total CL & Provisions 3,932.69 4,117.44 3,743.97 2,804.05 2,165.75
Net Current Assets 1,488.74 539.91 159.52 694.35 1,265.57
Miscellaneous Expenses 0.00 0.00 0.00 0.00 0.00
Total Assets 8,959.16 8,760.36 9,382.93 10,126.65 11,257.17
Contingent Liabilities 393.92 613.75 717.08 639.31 598.41
Book Value (Rs) 0.09 -3.34 -1.16 5.54 5.16
Source : Dion Global Solutions Limited
PROFIT AND LOSS ANALYSIS:
Profit & Loss account of JSW ISPAT
------------------- in Rs. Cr. -------------------
Steel
Jun '11 Jun '10 Mar '09 Mar '08 Mar '07
12 mths 15 mths 12 mths 12 mths 12 mths
Income
Sales Turnover 9,100.50 11,079.40 9,181.29 9,478.75 8,417.56
Excise Duty 770.14 879.95 917.28 1,116.56 889.80
Net Sales 8,330.36 10,199.45 8,264.01 8,362.19 7,527.76
Other Income -1,095.88 180.91 -391.74 580.29 79.25
16. Book Value (Rs) 0.09 -3.34 -1.16 5.54 5.16
Source : Dion Global Solutions Limited
SWOT Analysis
Strsngth
1. JSW has good reputation in steel market. It is the result of long experience of around 3 decades in the
steel industry.
2. JSW ISPAT Steel Limited (JISL) has consistently placed an added emphasis on quality processes
within the organization. Its strict adherence to standards of excellence in quality has seen the
company attain the QS 9000 and ISO 14001 certifications.
3. Dual technology allows Ispat the freedom to choose its raw material feed, like pig iron, sponge iron,
iron ore, scrap or any combination of various feeds.
Weakness
1. High Transportation cost, due to increase in the price of fuel.
2. Due to increase in exchange rates i.e. the price of rupee depreciating against the dollar, essential
raw materials for the production have become costly.
3. Lack of skilled manpower and workers.
4. There are problems faced with Infrastructure, due to location of the plant away from the market.
Opportunities
1. Development of captive mining facilities and upstream integration which can result in lower cost
of production and higher productivity and can also reduce incidence of price volatility of raw
materials.
2. It is situated very close to India's commercial capital - Mumbai,
3. Dolvi plant has easy access to major markets in Western India.
4. The demand of infrastructure and automobile sector can lead to demand of steel.
5. Large unexplored market in southern part of the country.
Threats:
1. Threats from other materials like cement, plastic and alluminium.
2. Increase in Power Tariffs.
3. There is intense competition from major companies like Tata Steel, POSCO.
17. Strategies Employed:
JSW Steel acquired a majority stake in Ispat Industries in December 2010 for Rs 2,156 crore and
renamed it JSW Ispat Steel
Ispat is undertaking iron ore mining operations in Brazil, and coal mining operations in Columbia and
Mozambique, through subsidiaries, in joint ventures. In India, Ispat has been awarded prospecting iron
ore leases in Damkodwadvi, Maharashtra and work has thus commenced.
JSW Steel has finalized a Rs 2,140-crore investment plan in its subsidiary JSW Ispat Steel Ltd to set up a
coke oven, a pellet plant and a cold rolling mill - Jan 25, 2012
JSW ISPAT Steel allotted 13 crore equity shares of Rs 10 each of the company, on preferential basis, at a
premium of Rs 4.74 a share, to its CDR lenders. – May 22,2012
The Business of JSW Ispat steel is divided as
1. An Integrated Steel Plant at Dolvi, Maharashtra. It has a captive port located close to it on the Amba
River, that opens into the Arabian Sea. This port can handle barges and mini-bulk carriers up to 4000 dry
weight tonnage (DWT). Moreover there is a jetty adjoining the complex which is capable of handling
cargo of up to 10 million tonnes per annum.
It provides with the Manufacturing of the following products:
DRI - Sponge Iron Plant
Blast Furnace
Compact Strip Production
2. An Integrated Steel Plant at Kalmeshwar, Maharashtra This plant uses the latest steel manufacturing
technology to produce galvanized sheets and products, apart from cold rolled coils. The Kalmeshwar
complex has a total of three advanced plants - a 0.325 million tonnes Galvanized Plain/Galvanized
Corrugated plant, a 0.33 million tonne Cold Rolled Coils plant and a 60,000 tonne Color Coated Sheets
plant.
It provides with the Manufacturing of the following products:
Cold rolling mill
Galvanizing line
Color coating line