SlideShare una empresa de Scribd logo
1 de 7
Descargar para leer sin conexión
INFORME ESPECIAL
                                        Censo General 2005
                                   COLOMBIA – EDUCACIÓN*
                                                                                                       1 de 7


PRINCIPALES INDICADORES DE EDUCACIÓN

1. ALFABETISMO
Se conoce como tasa de alfabetismo la relación que existe entre las personas a
partir de cierta edad que declararon saber leer y escribir y el total de la población
que contestó esta pregunta. “Naciones Unidas recomienda que la información
acerca de alfabetismo debe ser recogida para todas las personas de 10 años y
más. Los censos colombianos recogen esta información a partir de edades
menores. En los censos de 1973, 1985 y 1993, la pregunta para medir alfabetismo
se aplicó a todas las personas de 5 años y más. En 1964 esta pregunta se le hizo
a todas las personas” 1 . Si bien en el Censo 2005 se preguntó a partir de 3 años,
dicha tasa se calcula a partir de 5 años para guardar comparabilidad con otros
censos.
No obstante lo anterior, se procesa la información para los rangos de edad donde
se puedan focalizar las políticas educativas para disminuir el analfabetismo de la
población.
                                  Países de la Comunidad Andina.
                                       Alfabetismo ≥15 años
                                                                                               88.6
             Perú (2005)                                                                   83.4
                                                                                                   94.1

                                                                                                 92.5
         Ecuador (2003)                                                                         91.0
                                                                                                  94.0

                                                                                           87.2
           Bolivia (2003)                                                              81.6
                                                                                                  93.1

                                                                                                  93.4
       Venezuela (2003)                                                                           93.1
                                                                                                   93.8

                                                                                                91.6
         Colombia (2005)                                                                        91.8
                                                                                                91.3

                            0.0        20.0          40.0            60.0           80.0           100.0
                                                               Porcentaje
                                                     Hombres     Mujeres    Total

Fuente: Population Reference Bureau y Censos de Población


1
     WARTENBERG, L. Centro de Investigaciones sobre dinámica social CIDS. Memorias del taller Col (ip’-ums) marzo 23
     y 24 de 2001. P.66.
* Actualizada con los últimos datos censales
INFORME ESPECIAL
                                                          Censo General 2005
                                                   COLOMBIA – EDUCACIÓN*
                                                                                                                                               2 de 7

1.1. ALFABETISMO - Población de 15 y más años
                              COLOMBIA. Alfabetismo - población de 15 y más años
                      100.0
                                                          90.6 91.3                             90.6 91.8                               90.6 91.6
                                                88.1                                    87.3                                     87.7
                       90.0            83.1                                     81.1                                    82.0
                       80.0   75.0                                                                             72.9
                                                                         71.1
                       70.0

                       60.0
         Porcentaje


                       50.0

                       40.0

                       30.0

                       20.0

                       10.0

                        0.0
                               1964

                                        1973

                                                   1985

                                                          1993

                                                                  2005

                                                                         1964

                                                                                1973

                                                                                         1985

                                                                                                 1993

                                                                                                        2005

                                                                                                                1964

                                                                                                                         1973

                                                                                                                                 1985

                                                                                                                                        1993

                                                                                                                                               2005
                                               Hombre                                  Mujeres                                  Total

       Fuente: Censos de población y vivienda

     Los niveles de analfabetismo han disminuido en los últimos 41 años en la
     población de 15 años y más. De una tasa de 27,1% en 1964 disminuye a
     una tasa de 8,4% en el 2005, según los resultados del Censo General.
                              COLOMBIA. Alfabetismo - Población de 15 y más años
                                                                                                                                91.6
                                      Total                                                                                     91.8
                                                                                                                                91.3

                                                                                                                                 94.5
                              Cabecera                                                                                           94.4
                                                                                                                                 94.6

                                                                                                                       81.5
                                      Resto                                                                            81.8
                                                                                                                       81.1

                                               0                 20             40               60             80                100
                                                                                       Porcentaje
                                                                          Hombres               Mujeres         Total

                                      Fuente: Censo General 2005

     El 91,6% de la población de 15 y más años sabe leer y escribir. Para las
     cabeceras municipales este porcentaje es 94,5% y en el resto es de 81,5%.
INFORME ESPECIAL
                                                 Censo General 2005
                                             COLOMBIA – EDUCACIÓN*
                                                                                                                                         3 de 7

1.2. ALFABETISMO - Población de 15 a 24 años
                             COLOMBIA. Alfabetismo - población de 15 a 24 años
                     100.0           93.4     94.7        96.2            94.8     96.3      97.5              94.2          95.5     96.9
                             88.0                                 89.6                               88.9
                      90.0

                      80.0

                      70.0

                      60.0
        Porcentaje


                      50.0

                      40.0

                      30.0

                      20.0

                      10.0

                       0.0
                              1973


                                      1985


                                               1993


                                                           2005


                                                                   1973


                                                                           1985


                                                                                    1993


                                                                                              2005


                                                                                                        1973


                                                                                                                1985


                                                                                                                              1993


                                                                                                                                       2005
                                       Hombre                               Mujeres                                    Total

                         Fuente: Censos de población y vivienda

     Los niveles de analfabetismo han disminuido en los últimos 32 años en la
     población de 15 a 24 años. De una tasa de 11,1% en 1973 disminuye a una
     tasa de 3,1% en el 2005, según los resultados del Censo General.
                             COLOMBIA. Alfabetismo - Población de 15 a 24 años
                                                                                                                       96.9
                                              Total                                                                    97.5
                                                                                                                       96.2

                                                                                                                        98.3
                                       Cabecera                                                                         98.7
                                                                                                                        97.9

                                                                                                                 92.2
                                             Resto                                                                93.1
                                                                                                                 91.4

                                                      0           20          40            60          80             100           120
                                                                                           Porcentaje
                                                                          Hombres            Mujeres           Total

                              Fuente: Censo General 2005

     El 96,9% de la población de 15 a 24 años sabe leer y escribir. Para las
     cabeceras municipales este porcentaje es 98,3% y en el resto es de 92,2%.
INFORME ESPECIAL
                                                                 Censo General 2005
                                                     COLOMBIA – EDUCACIÓN*
                                                                                                                                                                          4 de 7

2. ASISTENCIA ESCOLAR – Para diferentes grupos de edad de la población

                          COLOMBIA. Asistencia escolar por grupos de edad
                                           1973-2005
                    100
                                                                             92.0
                    90                                                   85.2                                                               83.3
                                                                 81.4
                                                  78.0                                                       77.8
                    80                                                                                                           73.4
                                                                                                   68.0                      67.8
                    70                                                                         64.9
                                          58.8           58.5                          57.4
                    60
                                                                                                                     50.8
       Porcentaje


                    50            45.1

                    40
                                                                                                                                                                 27.1
                    30                                                                                                                                  24.7 26.1
                                                                                                                                                    19.1
                    20
                          11.1
                    10

                     0
                           1973
                                   1985

                                           1993
                                                  2005
                                                          1973

                                                                  1985
                                                                         1993

                                                                                2005
                                                                                        1973
                                                                                               1985

                                                                                                      1993
                                                                                                              2005

                                                                                                                      1973
                                                                                                                              1985
                                                                                                                                     1993

                                                                                                                                             2005
                                                                                                                                                     1973

                                                                                                                                                            1985
                                                                                                                                                                   1993
                                                                                                                                                                           2005
                                  5 y 6 años                 7 a 11 años                  12 a 17 años                   5 a 17 años                   18 a 24 años

                Fuente: Censos de población y vivienda


     Los primeros resultados del Censo General evidencian un incremento en
     los niveles de asistencia escolar en establecimientos formales:

     En efecto, mientras en 1973 la tasa de asistencia para el rango de edad de
     5 a 6 años fue de 11,1%, en el 2005 esta tasa se ubica en 78,0%.

     Para el rango de edad de 7 a 11 años la tasa de asistencia pasó de 58,5%
     en 1973 a 92,0% en el 2005.

     Para la población entre los 12 y 17 años la tasa de asistencia en 1973 fue
     57,4%, y en el 2005 registró 77,8%.

     Para el rango de edad de 5 a 17 años la tasa de asistencia pasó de 50,8%
     en 1973 a 83,3% en el 2005.

     Para la población entre los 18 a 24 años, la tasa de asistencia en 1973 fue
     19,1%, mientras en el 2005 es de 27,1%.
INFORME ESPECIAL
                           Censo General 2005
                       COLOMBIA – EDUCACIÓN*
                                                                                           5 de 7

               COLOMBIA. Asistencia escolar de 5 a 6 años

                                                                      78.0
               Total                                                  78.7
                                                                     77.2


                                                                           82.8
           Cabecera                                                        83.4
                                                                           82.3


                                                            65.3
              Resto                                          66.5
                                                            64.3

                       0       20         40         60              80              100
                                               Porcentaje

                                     Hombres     Mujeres     Total

             Fuente: Censo General 2005


El 78,0% de la población de 5 a 6 años asiste a un establecimiento
educativo formal.

              COLOMBIA. Asistencia escolar de 7 a 11 años

                                                                                  92.0
               Total                                                              92.7
                                                                                  91.3


                                                                                    93.9
           Cabecera                                                                 94.5
                                                                                    93.4


                                                                             86.6
              Resto                                                           87.7
                                                                             85.6

                       0       20         40         60              80              100
                                               Porcentaje

                                          Hombres   Mujeres        Total

       Fuente: Censo General 2005


El 92,0% de la población de 7 a 11 años asiste a un establecimiento
educativo formal.
INFORME ESPECIAL
                            Censo General 2005
                        COLOMBIA – EDUCACIÓN*
                                                                                               6 de 7

              COLOMBIA. Asistencia escolar de 12 a 17 años

                                                                             77.8
                Total                                                         79.2
                                                                         76.4


                                                                                82.8
           Cabecera                                                             83.5
                                                                                82.0


                                                               63.2
               Resto                                            65.8
                                                           60.9

                        0         20        40            60             80              100
                                                 Porcentaje

                                        Hombres       Mujeres          Total

         Fuente: Censo General 2005


El 77,8% de la población de 12 a 17 años asiste a un establecimiento
educativo formal.
     COLOMBIA. Asistencia escolar de la población entre 5 y 17 años

                                                                              83.3
            Total                                                              84.4
                                                                              82.3


                                                                                 87.1
        Cabecera                                                                 87.7
                                                                                86.5


                                                                  72.9
           Resto                                                      74.7
                                                                 71.2

                    0        20        40            60                80               100
                                             Porcentaje
                                        Hombres       Mujeres         Total

         Fuente: Censo General 2005


El 83,3% de la población de 5 a 17 años asiste a un establecimiento
educativo formal. Para las cabeceras este porcentaje es de 87,1% y para el
resto es de 72,9%.
INFORME ESPECIAL
                                                             Censo General 2005
                                                     COLOMBIA – EDUCACIÓN*
                                                                                                                                            7 de 7


                                       COLOMBIA. Asistencia escolar de 18 a 24 años

                                                                         27.1
                                         Total                               28.2
                                                                        26.0


                                                                              31.1
                                Cabecera                                       31.9
                                                                              30.2


                                                              13.1
                                        Resto                 13.6
                                                             12.8


                                                 0              20                  40          60          80         100
                                                                                         Porcentaje
                                                                                      Hombres    Mujeres   Total

                              Fuente: Censo General 2005


                    El 27,1% de la población de 18 a 24 años asiste a un establecimiento
                    educativo formal. Para las cabeceras este porcentaje es de 31,1% y para el
                    resto es de 13,1%.

                                                                                             COLOMBIA. Asistencia escolar para la
                        COLOMBIA. 1973-2005                                                      población entre 5 y 24 años

             70.0                                                    65.5                                                                  65.5
                                                     58.6                                    Total                                         66.1
             60.0             53.5
                                                                                                                                           64.9
             50.0     42.5
             40.0                                                                                                                            68.7
Porcentaje


                                                                                         Cabecera                                            68.7
             30.0
                                                                                                                                             68.6
             20.0
                                                                                                                                   56.2
             10.0
                                                                                            Resto                                   57.9
              0.0
                                                                                                                                  54.7
                       1973


                               1985


                                                      1993


                                                                      2005


                                                                                                     0     20        40             60              80   100
                                      5 a 24 años                                                                            Porcentaje
                                                                                                                   Hombres     Mujeres     Total
Fuente: Censo General 2005
                                                                                         Fuente: Censo General 2005


                    La tasa de asistencia para el rango de edad de 5 a 24 años fue de 42,5%
                    en 1973, en el 2005 esta tasa se ubica en 65,5%.

                    El 65,5% de la población de 5 a 24 años asiste a un establecimiento
                    educativo formal. Para las cabeceras este porcentaje es de 68,7% y para el
                    resto es de 56,2%.

Más contenido relacionado

Destacado

2024 State of Marketing Report – by Hubspot
2024 State of Marketing Report – by Hubspot2024 State of Marketing Report – by Hubspot
2024 State of Marketing Report – by HubspotMarius Sescu
 
Everything You Need To Know About ChatGPT
Everything You Need To Know About ChatGPTEverything You Need To Know About ChatGPT
Everything You Need To Know About ChatGPTExpeed Software
 
Product Design Trends in 2024 | Teenage Engineerings
Product Design Trends in 2024 | Teenage EngineeringsProduct Design Trends in 2024 | Teenage Engineerings
Product Design Trends in 2024 | Teenage EngineeringsPixeldarts
 
How Race, Age and Gender Shape Attitudes Towards Mental Health
How Race, Age and Gender Shape Attitudes Towards Mental HealthHow Race, Age and Gender Shape Attitudes Towards Mental Health
How Race, Age and Gender Shape Attitudes Towards Mental HealthThinkNow
 
AI Trends in Creative Operations 2024 by Artwork Flow.pdf
AI Trends in Creative Operations 2024 by Artwork Flow.pdfAI Trends in Creative Operations 2024 by Artwork Flow.pdf
AI Trends in Creative Operations 2024 by Artwork Flow.pdfmarketingartwork
 
PEPSICO Presentation to CAGNY Conference Feb 2024
PEPSICO Presentation to CAGNY Conference Feb 2024PEPSICO Presentation to CAGNY Conference Feb 2024
PEPSICO Presentation to CAGNY Conference Feb 2024Neil Kimberley
 
Content Methodology: A Best Practices Report (Webinar)
Content Methodology: A Best Practices Report (Webinar)Content Methodology: A Best Practices Report (Webinar)
Content Methodology: A Best Practices Report (Webinar)contently
 
How to Prepare For a Successful Job Search for 2024
How to Prepare For a Successful Job Search for 2024How to Prepare For a Successful Job Search for 2024
How to Prepare For a Successful Job Search for 2024Albert Qian
 
Social Media Marketing Trends 2024 // The Global Indie Insights
Social Media Marketing Trends 2024 // The Global Indie InsightsSocial Media Marketing Trends 2024 // The Global Indie Insights
Social Media Marketing Trends 2024 // The Global Indie InsightsKurio // The Social Media Age(ncy)
 
Trends In Paid Search: Navigating The Digital Landscape In 2024
Trends In Paid Search: Navigating The Digital Landscape In 2024Trends In Paid Search: Navigating The Digital Landscape In 2024
Trends In Paid Search: Navigating The Digital Landscape In 2024Search Engine Journal
 
5 Public speaking tips from TED - Visualized summary
5 Public speaking tips from TED - Visualized summary5 Public speaking tips from TED - Visualized summary
5 Public speaking tips from TED - Visualized summarySpeakerHub
 
ChatGPT and the Future of Work - Clark Boyd
ChatGPT and the Future of Work - Clark Boyd ChatGPT and the Future of Work - Clark Boyd
ChatGPT and the Future of Work - Clark Boyd Clark Boyd
 
Getting into the tech field. what next
Getting into the tech field. what next Getting into the tech field. what next
Getting into the tech field. what next Tessa Mero
 
Google's Just Not That Into You: Understanding Core Updates & Search Intent
Google's Just Not That Into You: Understanding Core Updates & Search IntentGoogle's Just Not That Into You: Understanding Core Updates & Search Intent
Google's Just Not That Into You: Understanding Core Updates & Search IntentLily Ray
 
Time Management & Productivity - Best Practices
Time Management & Productivity -  Best PracticesTime Management & Productivity -  Best Practices
Time Management & Productivity - Best PracticesVit Horky
 
The six step guide to practical project management
The six step guide to practical project managementThe six step guide to practical project management
The six step guide to practical project managementMindGenius
 
Beginners Guide to TikTok for Search - Rachel Pearson - We are Tilt __ Bright...
Beginners Guide to TikTok for Search - Rachel Pearson - We are Tilt __ Bright...Beginners Guide to TikTok for Search - Rachel Pearson - We are Tilt __ Bright...
Beginners Guide to TikTok for Search - Rachel Pearson - We are Tilt __ Bright...RachelPearson36
 

Destacado (20)

2024 State of Marketing Report – by Hubspot
2024 State of Marketing Report – by Hubspot2024 State of Marketing Report – by Hubspot
2024 State of Marketing Report – by Hubspot
 
Everything You Need To Know About ChatGPT
Everything You Need To Know About ChatGPTEverything You Need To Know About ChatGPT
Everything You Need To Know About ChatGPT
 
Product Design Trends in 2024 | Teenage Engineerings
Product Design Trends in 2024 | Teenage EngineeringsProduct Design Trends in 2024 | Teenage Engineerings
Product Design Trends in 2024 | Teenage Engineerings
 
How Race, Age and Gender Shape Attitudes Towards Mental Health
How Race, Age and Gender Shape Attitudes Towards Mental HealthHow Race, Age and Gender Shape Attitudes Towards Mental Health
How Race, Age and Gender Shape Attitudes Towards Mental Health
 
AI Trends in Creative Operations 2024 by Artwork Flow.pdf
AI Trends in Creative Operations 2024 by Artwork Flow.pdfAI Trends in Creative Operations 2024 by Artwork Flow.pdf
AI Trends in Creative Operations 2024 by Artwork Flow.pdf
 
Skeleton Culture Code
Skeleton Culture CodeSkeleton Culture Code
Skeleton Culture Code
 
PEPSICO Presentation to CAGNY Conference Feb 2024
PEPSICO Presentation to CAGNY Conference Feb 2024PEPSICO Presentation to CAGNY Conference Feb 2024
PEPSICO Presentation to CAGNY Conference Feb 2024
 
Content Methodology: A Best Practices Report (Webinar)
Content Methodology: A Best Practices Report (Webinar)Content Methodology: A Best Practices Report (Webinar)
Content Methodology: A Best Practices Report (Webinar)
 
How to Prepare For a Successful Job Search for 2024
How to Prepare For a Successful Job Search for 2024How to Prepare For a Successful Job Search for 2024
How to Prepare For a Successful Job Search for 2024
 
Social Media Marketing Trends 2024 // The Global Indie Insights
Social Media Marketing Trends 2024 // The Global Indie InsightsSocial Media Marketing Trends 2024 // The Global Indie Insights
Social Media Marketing Trends 2024 // The Global Indie Insights
 
Trends In Paid Search: Navigating The Digital Landscape In 2024
Trends In Paid Search: Navigating The Digital Landscape In 2024Trends In Paid Search: Navigating The Digital Landscape In 2024
Trends In Paid Search: Navigating The Digital Landscape In 2024
 
5 Public speaking tips from TED - Visualized summary
5 Public speaking tips from TED - Visualized summary5 Public speaking tips from TED - Visualized summary
5 Public speaking tips from TED - Visualized summary
 
ChatGPT and the Future of Work - Clark Boyd
ChatGPT and the Future of Work - Clark Boyd ChatGPT and the Future of Work - Clark Boyd
ChatGPT and the Future of Work - Clark Boyd
 
Getting into the tech field. what next
Getting into the tech field. what next Getting into the tech field. what next
Getting into the tech field. what next
 
Google's Just Not That Into You: Understanding Core Updates & Search Intent
Google's Just Not That Into You: Understanding Core Updates & Search IntentGoogle's Just Not That Into You: Understanding Core Updates & Search Intent
Google's Just Not That Into You: Understanding Core Updates & Search Intent
 
How to have difficult conversations
How to have difficult conversations How to have difficult conversations
How to have difficult conversations
 
Introduction to Data Science
Introduction to Data ScienceIntroduction to Data Science
Introduction to Data Science
 
Time Management & Productivity - Best Practices
Time Management & Productivity -  Best PracticesTime Management & Productivity -  Best Practices
Time Management & Productivity - Best Practices
 
The six step guide to practical project management
The six step guide to practical project managementThe six step guide to practical project management
The six step guide to practical project management
 
Beginners Guide to TikTok for Search - Rachel Pearson - We are Tilt __ Bright...
Beginners Guide to TikTok for Search - Rachel Pearson - We are Tilt __ Bright...Beginners Guide to TikTok for Search - Rachel Pearson - We are Tilt __ Bright...
Beginners Guide to TikTok for Search - Rachel Pearson - We are Tilt __ Bright...
 

Bol educacion

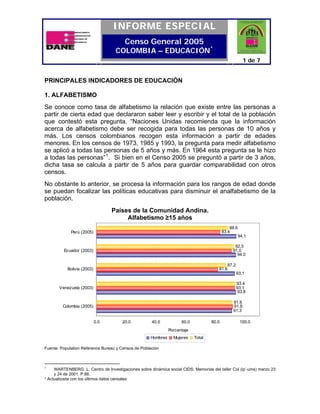
  • 1. INFORME ESPECIAL Censo General 2005 COLOMBIA – EDUCACIÓN* 1 de 7 PRINCIPALES INDICADORES DE EDUCACIÓN 1. ALFABETISMO Se conoce como tasa de alfabetismo la relación que existe entre las personas a partir de cierta edad que declararon saber leer y escribir y el total de la población que contestó esta pregunta. “Naciones Unidas recomienda que la información acerca de alfabetismo debe ser recogida para todas las personas de 10 años y más. Los censos colombianos recogen esta información a partir de edades menores. En los censos de 1973, 1985 y 1993, la pregunta para medir alfabetismo se aplicó a todas las personas de 5 años y más. En 1964 esta pregunta se le hizo a todas las personas” 1 . Si bien en el Censo 2005 se preguntó a partir de 3 años, dicha tasa se calcula a partir de 5 años para guardar comparabilidad con otros censos. No obstante lo anterior, se procesa la información para los rangos de edad donde se puedan focalizar las políticas educativas para disminuir el analfabetismo de la población. Países de la Comunidad Andina. Alfabetismo ≥15 años 88.6 Perú (2005) 83.4 94.1 92.5 Ecuador (2003) 91.0 94.0 87.2 Bolivia (2003) 81.6 93.1 93.4 Venezuela (2003) 93.1 93.8 91.6 Colombia (2005) 91.8 91.3 0.0 20.0 40.0 60.0 80.0 100.0 Porcentaje Hombres Mujeres Total Fuente: Population Reference Bureau y Censos de Población 1 WARTENBERG, L. Centro de Investigaciones sobre dinámica social CIDS. Memorias del taller Col (ip’-ums) marzo 23 y 24 de 2001. P.66. * Actualizada con los últimos datos censales
  • 2. INFORME ESPECIAL Censo General 2005 COLOMBIA – EDUCACIÓN* 2 de 7 1.1. ALFABETISMO - Población de 15 y más años COLOMBIA. Alfabetismo - población de 15 y más años 100.0 90.6 91.3 90.6 91.8 90.6 91.6 88.1 87.3 87.7 90.0 83.1 81.1 82.0 80.0 75.0 72.9 71.1 70.0 60.0 Porcentaje 50.0 40.0 30.0 20.0 10.0 0.0 1964 1973 1985 1993 2005 1964 1973 1985 1993 2005 1964 1973 1985 1993 2005 Hombre Mujeres Total Fuente: Censos de población y vivienda Los niveles de analfabetismo han disminuido en los últimos 41 años en la población de 15 años y más. De una tasa de 27,1% en 1964 disminuye a una tasa de 8,4% en el 2005, según los resultados del Censo General. COLOMBIA. Alfabetismo - Población de 15 y más años 91.6 Total 91.8 91.3 94.5 Cabecera 94.4 94.6 81.5 Resto 81.8 81.1 0 20 40 60 80 100 Porcentaje Hombres Mujeres Total Fuente: Censo General 2005 El 91,6% de la población de 15 y más años sabe leer y escribir. Para las cabeceras municipales este porcentaje es 94,5% y en el resto es de 81,5%.
  • 3. INFORME ESPECIAL Censo General 2005 COLOMBIA – EDUCACIÓN* 3 de 7 1.2. ALFABETISMO - Población de 15 a 24 años COLOMBIA. Alfabetismo - población de 15 a 24 años 100.0 93.4 94.7 96.2 94.8 96.3 97.5 94.2 95.5 96.9 88.0 89.6 88.9 90.0 80.0 70.0 60.0 Porcentaje 50.0 40.0 30.0 20.0 10.0 0.0 1973 1985 1993 2005 1973 1985 1993 2005 1973 1985 1993 2005 Hombre Mujeres Total Fuente: Censos de población y vivienda Los niveles de analfabetismo han disminuido en los últimos 32 años en la población de 15 a 24 años. De una tasa de 11,1% en 1973 disminuye a una tasa de 3,1% en el 2005, según los resultados del Censo General. COLOMBIA. Alfabetismo - Población de 15 a 24 años 96.9 Total 97.5 96.2 98.3 Cabecera 98.7 97.9 92.2 Resto 93.1 91.4 0 20 40 60 80 100 120 Porcentaje Hombres Mujeres Total Fuente: Censo General 2005 El 96,9% de la población de 15 a 24 años sabe leer y escribir. Para las cabeceras municipales este porcentaje es 98,3% y en el resto es de 92,2%.
  • 4. INFORME ESPECIAL Censo General 2005 COLOMBIA – EDUCACIÓN* 4 de 7 2. ASISTENCIA ESCOLAR – Para diferentes grupos de edad de la población COLOMBIA. Asistencia escolar por grupos de edad 1973-2005 100 92.0 90 85.2 83.3 81.4 78.0 77.8 80 73.4 68.0 67.8 70 64.9 58.8 58.5 57.4 60 50.8 Porcentaje 50 45.1 40 27.1 30 24.7 26.1 19.1 20 11.1 10 0 1973 1985 1993 2005 1973 1985 1993 2005 1973 1985 1993 2005 1973 1985 1993 2005 1973 1985 1993 2005 5 y 6 años 7 a 11 años 12 a 17 años 5 a 17 años 18 a 24 años Fuente: Censos de población y vivienda Los primeros resultados del Censo General evidencian un incremento en los niveles de asistencia escolar en establecimientos formales: En efecto, mientras en 1973 la tasa de asistencia para el rango de edad de 5 a 6 años fue de 11,1%, en el 2005 esta tasa se ubica en 78,0%. Para el rango de edad de 7 a 11 años la tasa de asistencia pasó de 58,5% en 1973 a 92,0% en el 2005. Para la población entre los 12 y 17 años la tasa de asistencia en 1973 fue 57,4%, y en el 2005 registró 77,8%. Para el rango de edad de 5 a 17 años la tasa de asistencia pasó de 50,8% en 1973 a 83,3% en el 2005. Para la población entre los 18 a 24 años, la tasa de asistencia en 1973 fue 19,1%, mientras en el 2005 es de 27,1%.
  • 5. INFORME ESPECIAL Censo General 2005 COLOMBIA – EDUCACIÓN* 5 de 7 COLOMBIA. Asistencia escolar de 5 a 6 años 78.0 Total 78.7 77.2 82.8 Cabecera 83.4 82.3 65.3 Resto 66.5 64.3 0 20 40 60 80 100 Porcentaje Hombres Mujeres Total Fuente: Censo General 2005 El 78,0% de la población de 5 a 6 años asiste a un establecimiento educativo formal. COLOMBIA. Asistencia escolar de 7 a 11 años 92.0 Total 92.7 91.3 93.9 Cabecera 94.5 93.4 86.6 Resto 87.7 85.6 0 20 40 60 80 100 Porcentaje Hombres Mujeres Total Fuente: Censo General 2005 El 92,0% de la población de 7 a 11 años asiste a un establecimiento educativo formal.
  • 6. INFORME ESPECIAL Censo General 2005 COLOMBIA – EDUCACIÓN* 6 de 7 COLOMBIA. Asistencia escolar de 12 a 17 años 77.8 Total 79.2 76.4 82.8 Cabecera 83.5 82.0 63.2 Resto 65.8 60.9 0 20 40 60 80 100 Porcentaje Hombres Mujeres Total Fuente: Censo General 2005 El 77,8% de la población de 12 a 17 años asiste a un establecimiento educativo formal. COLOMBIA. Asistencia escolar de la población entre 5 y 17 años 83.3 Total 84.4 82.3 87.1 Cabecera 87.7 86.5 72.9 Resto 74.7 71.2 0 20 40 60 80 100 Porcentaje Hombres Mujeres Total Fuente: Censo General 2005 El 83,3% de la población de 5 a 17 años asiste a un establecimiento educativo formal. Para las cabeceras este porcentaje es de 87,1% y para el resto es de 72,9%.
  • 7. INFORME ESPECIAL Censo General 2005 COLOMBIA – EDUCACIÓN* 7 de 7 COLOMBIA. Asistencia escolar de 18 a 24 años 27.1 Total 28.2 26.0 31.1 Cabecera 31.9 30.2 13.1 Resto 13.6 12.8 0 20 40 60 80 100 Porcentaje Hombres Mujeres Total Fuente: Censo General 2005 El 27,1% de la población de 18 a 24 años asiste a un establecimiento educativo formal. Para las cabeceras este porcentaje es de 31,1% y para el resto es de 13,1%. COLOMBIA. Asistencia escolar para la COLOMBIA. 1973-2005 población entre 5 y 24 años 70.0 65.5 65.5 58.6 Total 66.1 60.0 53.5 64.9 50.0 42.5 40.0 68.7 Porcentaje Cabecera 68.7 30.0 68.6 20.0 56.2 10.0 Resto 57.9 0.0 54.7 1973 1985 1993 2005 0 20 40 60 80 100 5 a 24 años Porcentaje Hombres Mujeres Total Fuente: Censo General 2005 Fuente: Censo General 2005 La tasa de asistencia para el rango de edad de 5 a 24 años fue de 42,5% en 1973, en el 2005 esta tasa se ubica en 65,5%. El 65,5% de la población de 5 a 24 años asiste a un establecimiento educativo formal. Para las cabeceras este porcentaje es de 68,7% y para el resto es de 56,2%.