http://dstk.tech/
Data Science is a very hot trend now. Data Mining, Text Mining, Social Network Analysis, Big Data are words in Data Science. What are the tools and softwares used in Data Science? This article will explore some of them.
1. Data Science Softwares and Tools
Introduction
Data Science is a very hot trend now. You may read that there are many data science projects
existed and you may heard that there are many data available. You have also heard about data
mining, text mining, social network analysis, and Big Data. So, what are they?
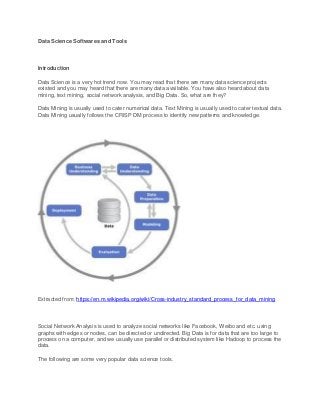
Data Mining is usually used to cater numerical data. Text Mining is usually used to cater textual data.
Data Mining usually follows the CRISP DM process to identify new patterns and knowledge.
Extracted from: https://en.m.wikipedia.org/wiki/Cross-industry_standard_process_for_data_mining
Social Network Analysis is used to analyze social networks like Facebook, Weibo and etc. using
graphs with edges or nodes, can be directed or undirected. Big Data is for data that are too large to
process on a computer, and we usually use parallel or distributed system like Hadoop to process the
data.
The following are some very popular data science tools.
2. R Programming
R Programming is very famous for statistics, visualizing, and statistical learning. R Programming is open
source, and is known in the research community. R has many extensions that allow data scientists and
statisticians to do data mining, text analysis, data visualizations, and Big Data Analysis. R is the
programming language and RStudio is the Integrated Development Environment. There are packages
like Rattle and ggplot for predictive analysis and data visualization.
Extracted from: http://rprogramming.net/download-and-install-rstudio/
3. Python Programming
Python is a high-level language, that has object oriented features in it. This meant that developers can
write scripts and codes with reference to real world objects. Python has many libraries for Statistics
using Scipy and numpy, predictive analytics with Scikit Learn, data visualizations using Matplotlib. While
R is initially developed for statistics, Python is a real programming language that can develop real
applications.
Extracted from: https://deparkes.co.uk/2012/10/29/winpython-a-matlab-alternative/
4. Excel
Excel can actually do a lot of data analysis, including data visualization using charts. Excel can be used to
conduct statistical analysis, including descriptives statistics. Inferential statistics and regressions can be
implemented with Excel data analysis addins. You can expand Excel with Excel VBA. For prediction using
machine learning, you will have to use R or Python.
Extracted from: https://chrome.google.com/webstore/detail/excel-
online/iljnkagajgfdmfnnidjijobijlfjfgnb
5. SAS
SAS is for advanced analytics, data management, and social media analytics, offering advanced
robust data science suite. SAS is very famous for business intelligence analysis on large data sets.
SAS topped the Gartner Magic Quadrant list and has integration with Python, R, Hadoop. SAS
Enterprise Guide offers GUI for SAS Programming to use in data analysis, and SAS Enterprise
Miner offers predictive analytics.
Extracted from:
http://support.sas.com/documentation/cdl/en/gridref/63292/HTML/default/viewer.htm#p0l098ovcs9xt
bn1f4cv3eexy0d0.htm
6. SPSS
SPSS is another competitor of SAS, and is the Industrial standard for data mining and offers
advanced analytics. Statistics offers advanced statistical analysis, which includes descriptive
statistics, inferential statistics, Regressions, and data visualization. SPSS Modeler offers predictive
analytics with statistical learning and machine learning algorithms. SPSS Modeler offers text
analysis plugins to analyze textual data.
Extracted from: https://developer.ibm.com/predictiveanalytics/2015/05/14/solving-business-problems-
ibm-spss-modeler-churn-model/
7. DSTK – Data Science Toolkit 3
DSTK - Data Science Toolkit 3 is a set of data and text mining softwares, following the CRISP DM
model. DSTK offers data understanding using statistical and text analysis, data preparation using
normalization and text processing, modeling and evaluation for machine learning and statistical
learning algorithms. ChartPlotter is a New Addition to the DSTK softwares, and it allows you to build
interactive Plotly JS charts and dashboards in minutes, using only mouse clicks. DSTK
Studio allows you to build recommendation and prediction data products.
DSTK 3 consists of DSTK Engine, DSTK ScriptWriter, DSTK Studio, DSTK Text Explorer,
and DSTK ChartPlotter. DSTK Engine is R simplified, focusing on Data Mining. DSTK ScriptWriter
offers GUI to write script for DSTK Engine. DSTK Studio offers SPSS Statistics like GUI for data
mining, DSTK Text Explorer offers GUI for Text Mining, and DSTK Chart Plotter offers GUI for data
visualizations. DSTK does not have the level of advanced analytics in SPSS and SAS, but it is more
cost effective aiming at smaller companies that need analytics, but does not need advanced
analytics.
DSTK Engine and DSTK ScriptWriter are free of charge and have been uploaded to
Sourceforge.net They are under GNU GPL License. DSTK Studio, Text Explorer, and Chart
Plotter, however, requires a small fee of $59 usd to help support us. A demo version of DSTK
Studio and DSTK Text Explorer is included in DSTK 3 package, but you can only use them 10
times.
Visit: http://dstk.tech for more information.
Text Link Analysis using DSTK Text Explorer. You do not have to read all the customers’ opinions.