1. Page 1
Q1 (a) What do you understand by word “Statistics”, give out its definitions (minimum
by 4 Authors) as explained by various distinguished authors.
The word statistics has it origination from german “statistic” meaning political state. It also
has a root relation to Italian “statistica” meaning statesman. It is a branch of mathematics
applied to real situations and used for resolving problems, essentially it means the use of data
to help the decision maker reach better decisions in forecasting, controlling and exploring.
The evolution of social system led to the emergence of a working class, administrators and
rulers. Industrial revolution gave rise to machines and managers. Businesses grew to such a
magnitude that they could not be run by families alone, thus leading to the emergence of
corporate bodies. Such bodies acquired the legal status of a person with a credibility and
image in the society that motivated other individuals to invest money in them and share
profits or losses that could accrue to such businesses, thus leading to the emergence of
professionals and managers who were running such businesses. Managers and management
thinkers over centuries evolved, also the tools and techniques adapted by them, which were
used to make decisions at various stages and in different situations. Statistical techniques
were one such set of tools used by the managers or administrators.
Statistics can be defined by various people to mean the following:
1) Professor Horace Secristdefines statistics as – an aggregate of facts affected to
marked extent by multiplicity of causes, numerically expressed, enumerated or
estimated according to reasonable standard of accuracy, collected in a systematic
manner for a pre determined purpose and placed in relation to each other
2) Croxton and Cowden defines statistics as - the science of collection, organization,
presentation, analysis and interpretation of numerical data
3) Professor YaLun Chou defines statistics as – a method of decision making in the
fact of uncertainty on the basis of numerical data and calculated risks
4) Wallis and Roberts define statistics as – a body of methods for obtaining knowledge
and not a body of substantive knowledge
If the science is knowledge then art is action. Thus statistics may be regarded an art. It
involves the application of given methods to obtain facts, derive results and finally to use
them for appropriate action/decision making. Statistical methods are those methods by which
the statistical data is analysed.
Q1 (b) Enumerate some important development of statistical theory, also explain merits
and limitations of statistics.
Some landmarks in history of development of statistical theory
1) The theory of probability was initially developed by James Bernoulli, Daniel
Bernoulli, La Place and Karl Gauss, who discovered and developed the theory of
probability while estimating a chance of winning or losing in gambling in the 17th
century
2. Page 2
2) Abraham De Moivre discovered the Normal Curve. La Place and Karl Gauss
independently arrived at the same results as De Moivre
3) Jacques Quelet discovered the fundamental principle “the constancy of great
numbers” which became the basis of sampling
4) Sir Francis Galton developed the concept of Regression
5) Karl Pearson developed the Chi-Square Goodness of Fit Test
6) Sir Ronald Fischer made a major contribution in the field of experimental design
turning it to science. Since 1935, Design of Experiments has made rapid progress
making collection and analysis of statistics prompter and more economical
Merits of Statistics
1) Presenting facts in a definite form
2) Simplifying mass of figures, condensation into few significant numbers
3) Facilitating comparison
4) Helping in formulating and resting of hypothesis and developing new theories
5) Helping in predictions
6) Helping in formulating suitable policies
Statistical methods are all prevailing but must be tailored to fit each field scope of problem
Limitations of Statistics
1) Does not deal with individual measurement
2) Deals only with quantitative characteristics
3) Results are true only on an average
4) It is only one of the methods of studying a problem
5) Statistics can be measured, it requires skills to use it effectively, otherwise
misinterpretation is possible
6) It is only a tool or a means to an end and not the end itself which has to be
intelligently identified using this tool
Q2 (a) Define elementary theory of sets, also explain various methods by giving suitable
examples, Narrate the utility of “Set Theory” in an organization.
A set is a collection of items, objects and elements which are governed by a rule indicating
whether an object belongs to the set or not
In conventional notation of sets,
1) Alphabets like A, B, C, X, U, S etc. are used to denote „sets‟
2) Braces like {} are used as a notation for collection of objects or elements in the „set‟
3) In the context of definition of different sets the sign = is uses to depict word „is‟
4) Greek letter epsilon E is used to denote „belongs to‟
5) A vertical line „I‟ is used to denote expressions „such that‟
6) Alphabet “I” is used to denote an „integer‟
Using above notations a set called A consisting of elements 0, 1, 2, 3, 4 and 5 may be
mathematically denoted in any of the following manners
3. Page 3
i. List or Roster Method – in which all elements are actually listed
A = {0, 1, 2, 3, 4, 5} read as
A is (a set with) elements 0, 1, 2, 3, 4, 5
ii. Set Builder or Rule Method – in which mathematical rules, equality or inequality
etc are specified to generate the elements of intended set
A = {x I0 < x < 5}, x Ei} (I = 1, 2,… 5) read as
A is (a set of) (variable x) (such that) (x lies between 0 and 5, both inclusive),
where variable x belongs to integers
Universal set is a set consisting of all objects or elements of a type or of a given interest and
is normally depicted by alphabets X, U and S.
Eg. A set of all digits may be expressed as X = {0, 1, 2, 3, 4, 5, 6, 7, 8, 9}
Finite set is a set in which the number of elements can be counted
Eg. A = {1, 2, 3…. 15} having 15 elements Or a set of employees in an organization
Infinite set is a set in which the number of elements cannot be counted
Eg. A set of integers or real numbers
Subset A is called a subset of B if every element of A is also an element of B, represented as
A C B and is read as “A is a subset of B”
Eg. Each of sets A ={0, 1, 2, 3, 4, 5} or the set B = {1, 3, 5} are subsets of set C,
whereC = {0, 1, 2, 3, 4, 5}
Supersets A is a superset of B if every element of B is an element of B, represented as A B
and is read as “A is a superset of B”
Equal sets if A is a subset of B and B is a subset of A, then A & B are called equal sets. This
can be denoted as - If AC B and B C A, then A = B
Utility of set theory in business organization
A company consists of sets of resources like personnel, machines, material stocks and cash
reserves. The relationship between these sets and between the subsets of each set is used to
equate assets of one kind with another. The subsets of highly skilled production workers
within the set of all production workers, is critical subset that determines the productivity of
other personnel. Certain subsets of company products are highly profitable or certain material
may be subject to deterioration and must be stocked in greater quantities than others. Thus the
concept of sets is very useful in business management.
Q2 (b) Explain the meaning and type of “Data” as applicable in any business. How
would you classify and tabulate the Data, support your answer with examples.
Data is any group of observations or measurements related to the area of business interest and
to be used for decision making. Data can be of two types
4. Page 4
1) Qualitative data representing non-numeric features or qualities of objects under
reference
2) Quantitative data that represent properties of objects under reference with numeric
details
Data can also be of the following two types
1) Primary data are observed and recorded as part of an original experiment or survey.
Eg. A companys marketing research team obtaining choice of products directly from
customers
2) Secondary data are compiled by someone other than the user of the data for decision
making purpose. Eg. Professional marketing research organizations collecting data for
anyone who may need them and not for their own consumption. This class is the
major source of data
Attributes are qualitative observation on objects which are normally represented in non
numeric description. They can be represented numerically with restrictions
Surveys and experiments or research works are normal methods for collecting data. In
experiments the state of population is manipulated by experimental forces, in surveys the data
is collected in their actual state.
Classification and tabulation of data
Data can be classified by geographical areas, chronological sequence, qualitative attributes
like urban or rural, male or female, literate or non literate, undergraduate or graduate,
employed or unemployed and so on. While the most frequently used method of classification
if data is the quantitative classification.
After data is classified it is presented in tabular form. A self explanatory and comprehensive
table has a table number, title of table, captions, stubs, body containing the main data which
occupies the cells of a table after the data has been classified under various captions and
stubs. Head notes are added at the top of the table for general information regarding the
relevance of the table or for cross references or links with other literature. Foot notes are
appended for clarification, explanation or as additional comments on any of the cells in the
table.
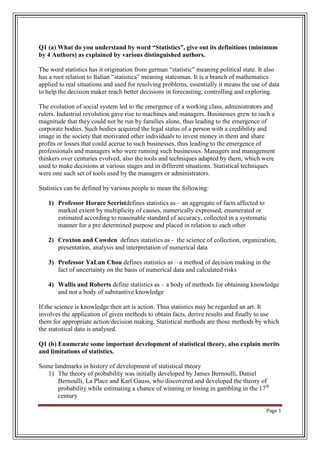
Following is an example for tabulation. The source base is from the media planning industry
where the media planner is trying to identify the top performing channel in the clients key
activity markets.
5. Page 5
In Fig 1, the data is the software output
showing the channel share of various
channels in India in alphabetical order
In Fig 2, the data is sorted on region
basis
In Fig 3, the data on a regional level is
sorted in descending order in-order to
identify the top performing channels in
the given market clusters
Basis the tabulations, the outcome of it
will be to select the idea channel to
include in the media plan.
Q3 (a) Describe Arithmetic, Geometric
and Harmonic means with suitable
examples. Explain merits and
limitations of Geometric mean.
Arithmetic Mean
The term average is widely used as a
descriptive measure for the location of a
set of values. The arithmetic mean or simply the mean is also referred to as the average.
6. Page 6
Arithmetic mean is like the centre of gravity of the given data. Basically the mean of a set of
number of values is defined as their sum divided by number of the values. The average X is
given by the formula
X = (X1 + X2 + X3…Xn)/n
*a bar over any letter denotes that it is a mean value
∑ the greek letter called sigma indicates the sum of certain observations. In above case it is
used for representing the sum of observations Xi, where I vary from 1 to n or
(X1+X2+X3…Xn). This sum is divided by n to find the mean or X as shown in the above
formula.
Given the data the calculation of the mean is routine and simple. Since every value in the set
is taken into account while calculating it, the single precise value of the mean thus obtained
can be used as a parameter for mathematical operations. It is quite obvious that being a
computed value the mean may or may not coincide with any vales of the original
observations.
For example, mean of values in the set (3, 4, 5) is (3+4+5)/3 = 12/3 = 4, which coincides with
one of the observations, the central observation 4 of the set (3, 4, 5) which is its measure of
the central tendency.
Geometric Mean
Geometric mean is defined as the Nth root of the product of the values of N items whose
geometric mean is required. To find the geometric
For example, to find the geometric mean of 4, 6, 9 we should multiply those figures to then
take their cubed root (in this case because there are 3 numbers) *cube root of 4 x 6 x 9 is 6*
An important property of Geometric mean is that the value of GM remains unchanged if all
values of the set are substituted by it. For example, the GM of 2, 4, 8 is the cube root of
2x4x8, ie. 4. If we replace the values by their GM ie 4, we will have no change in the FM.
This property is used to work out the average value of ratios, rates of changes in indices,
sales, production etc.
Merits of Geometric Mean
1) It is based on each and every item of the series
2) It is rigidly defined
3) It is useful in averaging ratios and percentages in determining rates of increase or
decrease
4) It gives less weight to large items and more to small items. Thus GM of a given set of
values is always less than their arithmetic mean
5) It is capable of algebraic manipulations like computing the grand geometric mean of
the geometric means of different set of values
Limitations of Geometric Mean
1) It is relatively difficult to comprehend, compute or interpret
7. Page 7
2) AGM with 0 value cannot be comprehended with similar other non 0 values or values
with negative sign
Harmonic Mean
It is defined as the reciprocal of the arithmetic mean of the reciprocals of individual values or
observations.
HM = N/{(1/X1) + (1/X2) + (1/X3) +…+ (1/Xn)}
This formula can be extended to data given in frequency distribution also where the terms in
the denominator of above formula have to be increased by number of times those are repeated
in the distribution according to the respective frequencies
Harmonic means are used for calculating the rate of increase in profits of a concern or the
average speed during the journey where a number of speeds were applicable for different
parts of the journey or for dinging the average process at different sets of articles have been
sold. The rates here generally indicate the relation between two different types of measuring
units involved in each ratio which can be expressed reciprocally.
For example, speed of 20 kms in 5 hours or the same thing being said as ¼ hr per km
Q3 (b) What do you understand by Concept of Probability, Explain various theories of
probabilities.
The concept of probability is important in analyzing all problems with an element of
uncertainty. A businessman about to embark on a new venture, a quality control inspector
wanting to know how many items produced will meet the specifications and a broker in share
market concerned with the future market trend are all faced with the problems of uncertainty.
Probability is a handy device which to a large extent depicts such uncertainities of the
problem, assign a number of the likelihood of an even happening and leads to a suitable
decision making process.
Probability is a number between 0 and 1, which describes how likely it is that an event will
occur. A zero probability is associated with an event that just cannot occur for example, the
sun rising in the west. On the other extreme an event which is sure to occur is said to have the
probability for example, death of a natural living being.
There are four theories of probability
i. Classical or a priori probability A priori during the course of an argument
means suggesting the probable effects of a known cause or using general
principles to suggest likely effects. This is the oldest concept evolved in the 17th
century and based on the assumptions that outcomes of random experiments. A
priori probabilities are of considerable importance in applied statistics.
8. Page 8
ii. Empirical concept This was developed in the 19th
century for insurance business
data and is based on the concept of relative theory. It is based on historical data
being used for future prediction. When we toss a coin the probability of a head
coming up is ½ because there are two equally likely events, namely appearance of
a head or that of a tail – assuming that the coin is not biased or leaded towards its
one side). This is an approach of determining a probability from deductive logic –
going from general to particular or from a wider scope to a smaller focus.
iii. Subjective or personal approach This approach was adopted by Frank Ramsey
in 1926 and developed by others. It is based on personal beliefs of the person
making the probability statement based on past information, noticeable trends and
appreciation of futuristic situations.
iv. Axiomatic approach This approach was introduced by Russian mathematician
AN Kolmogorov in 1933. His concept of probability is considered as a set of
functions, no precise definition is given but following axioms or postulates are
adopted
Q4 (a) In any business all strategic and corporate policies / decisions are based on
sampling, define sampling techniques and merits of samplings, support your answers
with relevant examples.
SthalikPulakNayay..an old adage saying in Sanskrit meaning that all the rice in a cooking
vessel is deemed to have been cooked properly if a few grains taken out of it for testing or
tasting appears to be so. In statistical parlance the few grains taken out are a sample and the
complee rice in the vessel is the population about which the cook is interested in making an
estimate. Such a population is referred to as universe.
Modern days complex business activities have resulted in development of more sophisticated
sampling techniques applicable in different fields for the purpose of understanding the
population parameters. This is done by drawing samples, taking measurements or evaluating
data of our interest, calculating their measures of central tendencies and dispersions. Such
measures are called statistics. Such statistics are carefully analysed and treated to reduce the
errors of estimation so that statistics does not become Distaelis third degree lies. A point to
note here is that the measures of central tendencies or dispersions pertaining to population are
called population parameters and similar measures on samples are called statistics.
Merits of sampling
1) Sampling is more economical than complete census because of the volume of work
involved and resources required‟
2) The desired results can be achieved more speedily resulting into expeditious decision
making
3) Sometimes it is more accurate than complete examination and evaluation of all items
because of the monotonous job inspectors have to do and the fatigue and biases
involved in it
9. Page 9
For application of statistical techniques it is essential that random samples are used. While
selecting a sample it should be ensured that each and every item of the universe or population
gets an equal chance of being included in it. In other words when the sample has been finally
selected there should be no specific reason to justify why a particular item say A was selected
in preference to another item say B. Sampling process should have offered the same chances
for selection of item B as were available for selection of item A
The selection of random sample can be made from a population by thoroughly mixing the
item and then picking them one by one like we might select a card from a deck of cards.
When items of population cannot be physicaly shuffled like computer chips or people, they
can be given a numerical identity and numbers can be selected by use of random number
tables.
Sampling techniques
Three main types of sampling strategy, within these types, you may then decide on a; point,
line, area method.
Random samplingLeast biased of all sampling techniques, there is no subjectivity - each
member of the total population has an equal chance of being selected. Can be obtained using
random number tables
Systematic samplingSamples are chosen in a systematic, or regular way.They are
evenly/regularly distributed in a spatial context, for example every two metres along a
transect line. They can be at equal/regular intervals in a temporal context, for example every
half hour or at set times of the day. They can be regularly numbered, for example every 10th
house or person
Stratified samplingThis method is used when the parent population or sampling frame is
made up of sub-sets of known size. These sub-sets make up different proportions of the total,
and therefore sampling should be stratified to ensure that results are proportional and
representative of the whole.
For example:
the make-up of different social groups in the population of a town can be obtained,
and then the number of questionnaires carried out in different parts of the town can be
stratified in line with this information. A systematic approach can still be used by
asking every fifth person
if an area of woodland was the study site, there would likely be different types of
habitat (sub-sets) within it. Random sampling may altogether „miss' one or more of
these.
Q4 (b) Define “Hypothesis” and enumerate procedure for hypothesis testing. What are
the common errors you are likely to encounter in the testing Hypothesis.
Hypothesis is an assumption or supposition made as a basis for further reasoning in terms of a
quantitative statement about the population under exploration. A hypothesis is considered as
an island in the uncharted seas of thought to be used as basis for consolidation and
recuperation as we advance into the unknown characteristics of a population.
10. Page 10
Procedure for hypothesis testing
1. Set up hypothesis is about population parameter and after taking same statistics find
the difference between hypothesized parameter and sample statistics. There are two
types of hypotheses resorted to
a. Null Hypothesis is an assumption that there is no real difference in the sample
and the population in particular matter under consideration and that the
difference found is accidental and unimportant arising due to fluctuations in
the sampling. Rejection of null hypothesis indicates that the difference have
statistical significance
b. Alternate hypothesis is the assumption that the sample data lead to
acceptance of the hypothesis as true because there is material difference
between population and sample. Normally alternate hypothesis is framed after
a statistical project which tries to identify any difference between two different
sets of data produced through different specifications in similar experiments
indicating significance of the project
2. Set up significance level The confidence with which a hypothesis is accepted or
rejected depends on the level of significance adopted for decision making. For
example 5% probability of rejecting a null hypothesis if it is true or running a risk of
5% for making a mistake. A significance level of 5% is synonymous to 95% degree of
confidence discussed
3. Set up a test criteriaor select an appropriate probability distribution for the particular
test which can properly be applied. For example, a normal distribution is generally
selected if only a small information is available but the same size is fairly large. The
characteristics of a normal distribution are extensively used, especially regarding the
percentages of areas covered under one, two or three times sigma ranges to see that
the position of sample characteristics may be located in relation to the population
parameter
4. Perform computations on the data obtained from the random sample regarding its
mean and standard error
5. Make decisions like accept of reject the full hypothesis on whether computed value
of test criterion falls with region of rejection or acceptance
Two types of errors in testing hypothesis
1) Type I error is committed when a null hypothesis Ho is true but the test rejects it.
The probability of such type of errors is denoted as P = α= Probability (rejecting Ho
when Ho is true)
2) Type II error is committed when Ho is false but the test accepts it
P = β = P (not rejecting Ho/ Ho is false)
11. Page 11
There has to be trade off between Type I & II errors. It is more dangerous to accept a false
hypothesis. Hence the probability of committing Type I error at a certain level is called level
of significance. It is also called the size of rejection region.
Q5 (a) What is “Chi - Square” (x2) test, narrate the steps for determining value of x2
with suitable examples. Explain the conditions for applying x2 and uses of Chi-Square
test.
Chi Square Test
This test was developed by Karl Pearson, analytical statistician and professor of applied
mathematics, London. Whose concept of coefficient of correlation is most widely used. This
test considers the magnitude of dependency between theory and observations and is defined
as
X2
= ∑ {(O-E)2
/E}
Where X2
= a statistic and not a parameter whose value is always positive and ranges from 0
to ∞
O = Observed frequencies
E = Expected frequencies
Steps for determining value for X2
1) When data is given in a tabulated form calculate expected frequencies for each cell
using the following formula E = (Row Total) x (Column Total)/Total No. of
Observations
2) Take difference between O and E for each cell and calculate their squares (O-E)2
3) Divide (O-E)2
by respective Expected frequencies and total up to get X2
4) Compared calculated value with table value at given degree of freedom and specified
level of significance. If at a stated level (generally 5%) the calculated value is more
than table value. The difference between theoretical and observed frequencies are
considered to be significant. It could not have arisen due to fluctuations of simple
sampling. However if the value is less than table value it is not considered as
significant, but regarded as due to fluctuations of simple sampling and therefore
ignored
Conditions for applying X2
1) N must be large, say more than 50, to ensure the similarity between theoretically
correct distribution and out sampling distribution‟
2) No theoretical cell frequency should be too small, less than 5, because that may lead
to over estimation of the value of X2
and may result into rejection of hypothesis. In
12. Page 12
case we get such frequencies, we should pool them up with the previous or
succeeding frequencies. This action is called Yates correction for continuity.
Uses of Chi Square test
1) As a test of independence Whether two or more attributes are associated or not can
be tested by framing a hypothesis and testing it against table value. For example use
of quinine is effective in control of fever or complexions of husbands or wives.
2) As a test of goodness of fit Actually this test is a test of badness, since the results of
the test lead the statistician to conclude either that the fit of a normal distribution to
the observed distribution is bad or that the evidences that it is bad is not convincing
and therefore it may be said to be good. The test enables us to ascertain how
approximately the theoretical distribution like Binominal, Poisson or Normal
distributions fit empirical distributions, that is, those obtained from sample data. A
test of concordance of the two can be made just by inspection but such test is
obviously inadequate. Precision can be secured by applying X2
test. Following steps
are taken
a. Null and alternate hypothesis are framed and a significance level is selected
for rejection of null hypothesis
b. A random sample of observation is drawn from the population‟
c. A set of expected or theoretical frequencies is derived under assumption that
null hypothesis is true. This generally takes the form of assuming that the
particular probability distribution is applicable to statistical population under
consideration
d. Observed frequencies are compared to expected theoretical frequencies
e. It calculated value of X2
is less than table value at given level of significance,
say by 5%, the fit is considered good and divergence between actual and
expected frequencies is attributed to fluctuations of simple sampling
f. If calculated value is more than table value, the fit is considered to be poor, it
cannot be attributed to fluctuations of simple sampling, rather it is due to
inadequacy of the theory to fit the observed facts
3) As a test of homogeneity It is an extension of test for independence whether two or
more independent random samples are drawn from the same population or different
populations. Here we shall have two or more samples. We are concerned with cross
classified data, whereas test of independence are concerned with problems whether
different samples come from same population. While the former involves single
samples from one population, the latter involves two or more independent samples
one from each of the possible populations in questions
13. Page 13
Q5 (b) How do you define “Index Numbers”? Narrate the nature and types of Index
numbers with adequate examples.
Croxton and Cowden defines Index numbers as – devices for measuring differences in the
magnitude of a group of related variables
Morris Hamburgdefines Index numbers as – a relative which expresses the relationship
between two figures, where one figure is used as a base
ML Nerenson and DM Levine defines Index numbers as – devices to measure the size or
magnitude of some object at a particular point in time as a percentage of some base or
reference object in the past
Richard I Levin and David S Rubin defines Index numbers as – a measure how much a
variable changes over a time. We calculate an index number by finding the ratio of the
current value to a base value. Then we multiply the resulting number by 100 to express the
index as percentage. The final value is percentage relative. Needless to say that the index
number for the base point in time is always 100
Nature of index numbers
1) Index numbers are specialized averages used for comparison in situations where two
or more series are expressed in different units or represent different items. For
example consumer price index representing prices of various items or the index of
industrial production representing various commodities produced
2) Index numbers measure the net change in a group of related variables over a period of
time
3) Index numbers measure the effect of change over a period of time, across a range of
industries, geographical regions and countries
4) The computation of the index numbers is carefully planned according to the purpose
of their computation, collection of data and application of appropriate method,
assignment of correct weightages and formulae
Types of index numbers
1) Price index numbers compares the levels of prices from one period to other. Prices
are generally represented by p in formulae. These are also expressed as price relatives,
defined as
Price Relative = (CY Price/BY Price)x100 = (p1/p0)x100
Any increase in the price index amounts to corresponding decrease in the purchasing
power of rupee or other affected currency
14. Page 14
2) Quantity index numbers measures how much the number or quantity of a variable
changes over time. Quantities are generally represented as q in formulae
3) Value index numbers measures changes in total monetary worth, that is, it measures
changes in the rupee value of a variable. It combines price and quantity changes to
present a more informative index
4) Composite index numbers A single index may reflect a composite or group of
changing variable. For instance the consumer price index measures the general price
level for specific goods and services in the economy. These are also known simply as
index numbers. In such cases the price relative with respect to a selected base are
determined separately for each and their statistical average is computed
Below given Fig 1 shows the indexing of satellite channel on their viewership in a specific
target group as against the universe of all viewers