SlideShare a Scribd company logo
1 of 2
Download to read offline
Office Market Snapshot
                                                                                                                   Washington, DC • Third Quarter • 2012


                                                                       Market Tracker                 Vacancy         Net Absorption           Deliveries           Asking Rent
                                                                       *Arrows = Current Qtr Trend    10.3%           12,000 SF                0 SF                 $50.17 FS


                                                                       Uncertainty Slows Office Market Recovery

                                                                       Uncertainty surrounding the elections, tax reform and government spending kept Washington, DC office
                                                                       market tenants cautious during the third quarter of 2012. The limited momentum of the first half of
                                                                       2012 continued into the third quarter, as only 12,000 square feet was absorbed. This mere ”drop in the
                                                                       bucket” demand brought the year-to-date total net absorption to a negative 34,000 square feet. Still,
                                                                       despite the slower pace of growth, and with new supply in check, vacancy fell slightly to 10.3% following
                                                                       three consecutive quarters at 10.4%. Average asking rents rose modestly by 58 cents, or 1.2%, over the
                                                                       quarter to $50.17 per square foot on a full service basis, and by 80 cents, or 1.6%, year over year.
WASHINGTON, DC OFFICE
                                                                       Small and mid-size tenants drove demand for office space. Those tenants– primarily private sector ones
Economic Indicators                                                    – were a diverse mix of law firms, government affairs offices, education-related entities, executive suites
                                                                       and non-profits. Gross leasing activity remained stable over the quarter, with the bulk of activity
                                                 Q3 12         Q3 11   occurring in the core submarkets of the East End and the Central Business District (CBD). Tenants
                                                                       continued to adopt cautious and defensive leasing approaches, either cutting down on their average
       DC Metro Employment                         2.5M        2.4M    square foot per employee or growing conservatively. Only a handful of transactions represented net
                                                                       growth. Aside from a couple of lease renewals, demand from the public sector remained stymied with
       DC Metro Unemployment                       5.5%        6.0%    both landlords and tenants awaiting policy decisions and greater government budget clarity. However,
                                                                       during the third quarter a few agencies downsized into already leased spaces, as total public sector net
       U.S. Unemployment                           8.2%        9.7%    absorption totaled a negative 140,000 square feet – the second lowest quarterly level in at least three
                                                                       years.
       U.S. CCI                                    65.64       50.26
                                                                       Amid the vast majority of tenants finding creative solutions to reduce space requirements, a handful
                                                                       found it advantageous to expand their real estate footprints. Georgetown University, for example, signed
                                                                       the top non-renewal lease in the District during the third quarter which accounted for approximately
  Net Absorption                                                       90,000 square feet of net growth. Offsetting that, however, was law firm Dewey & LeBoeuf’s return of
                                                                       about 125,000 square feet to the East End submarket, the result of the firm’s bankruptcy. The
                    5.0                                                non-profit United Nations Foundation signed the second largest non-renewal lease of the quarter for
                    4.0                                                85,000 square feet, accounting for over 35,000 square feet of net growth in the CBD submarket.
Square Feet (mil)


                    3.0
                                                                       In a chronic-uncertainty-plagued environment in which landlords compete for a finite set of tenants in
                    2.0
                                                                       the market, some landlords, looking to increase occupancy levels, assumed several millions of dollars of
                    1.0
                                                                       lease liability in order to secure a tenant. A few large law firms, in fact, are (as of the writing of this
                    0.0
                                                                       report) in lease negotiations for this reason, with leases likely to be signed in the next couple of
                    -1.0
                                                                       quarters.
                           2007   2008   2009   2010    2011    YTD
                                                               2012
                                                                       No new office supply was delivered to the Washington, DC office market in the third quarter of 2012.
                                                                       However, four office projects totaling 480,000 square feet are scheduled to deliver by the end of 2012,
                                                                       37% of which was available at the end of the third quarter. The remaining development pipeline will
  Vacancy Rate                                                         deliver approximately 1.5 million square feet to the District of Columbia in 2013, 32% of which was
                                                                       preleased at the end of the quarter. Look for MRP Realty to break ground on a speculative basis next
                                                                       quarter on approximately 111,000 square feet at 900 G Street, NW scheduled to deliver mid-2014.
13%
12%
11%
                                                                       Forecast
10%   Historical Average                                               •	      Potential cuts in government spending and the consolidation of multiple leased spaces into single
 9%                                                                            locations may ultimately reduce the government’s space needs.
 8%
 7%                                                                    •	      Concerns over the effects of mandated federal spending cuts in early 2013 on local businesses will
 6%                                                                            remain a factor in hiring decisions.
 5%
                                                                       •	      A lack of significant demand drivers and flat vacancy rates will keep overall asking rental rate
 4%
  2007    2008      2009                    2010       2011    2012            increases modest to flat over the next 18 months.
                                                                       •	      Growth is expected to remain subdued through 2013, with the private sector driving the bulk of
                                                                               office demand in the near term. Tenants across industry sectors will likely continue a “wait and
                                                                               see” approach to leasing decisions.


                                                                                                                                                            www.cassidyturley.com
Cassidy Turley Office Market Snapshot
Washington, DC  •   Third Quarter  •  2012

                                                                                                                                                                  UNDER
                                                                                    SUBLET            TOTAL        VACANCY    CURRENT      YTD                                     AVERAGE
                                                                                    VACANT                                   ABSORPTION ABSORPTION             CONSTRUC-
                                                    TOTAL BLDG     INVENTORY                        VACANT          RATE                                                        ASKING RENT
                                                                                                                                                                 TION

 Submarket
   CBD                                                  252       38,801,607       453,362        4,865,751         12.5%       71,523         169,224           248,697           $51.00

   East End                                             201        39,225,153      302,891        3,837,882         9.8%       (88,133)       (171,796)          539,644           $53.02

   West End/Georgetown                                    59       6,019,052        27,939         607,164          10.1%       23,950          26,653               0             $41.20

   Capitol Hill                                           42       4,272,688        20,871         174,251          4.1%        (6,218)         13,462           336,085           $55.56

   NoMa                                                   37       9,636,850        21,349        1,036,731         10.8%      (12,104)        (21,891)          623,817           $45.78
   Southwest                                              36       13,907,238        1,000         963,782          6.9%       (30,117)        (39,237)              0             $49.41
   Capitol Riverfront/Southeast                           11       3,736,758        17,200         646,748          17.3%       21,972         (25,749)              0             $46.48
   Uptown                                                 95       6,308,307        47,747         468,279          7.4%        30,686          15,541           196,013           $39.39
 TOTAL                                                  733       121,907,653      892,359       12,600,588         10.3%       11,559         (33,793)        1,944,256           $50.17

Key Lease Transactions 3Q 12
PROPERTY                                             SF             TENANT                                                   TRANSACTION                          SUBMARKET

601 New Jersey Avenue, NW                             217,300     GSA - Federal Trade Commission (FTC)                       Renewal                                Capitol Hill

650 Massachusetts Avenue, NW                           91,200     Georgetown University                                      Relet                                   East End

1750 Pennsylvania Avenue, NW                           85,000     United Nations Foundation                                  Relet                                       CBD

901 F Street, NW                                       77,000     Gallup, Inc.                                               Renewal                                 East End

1299 Pennsylvania Avenue, NW                           75,300     Cooley LLP                                                 Relet                                   East End

1331 F Street, NW                                      62,100     GSA - Department of Justice (DoJ)                          Renewal                                 East End

1100 New York Avenue, NW                               41,300     Gilbert LLP                                                Renewal                                 East End

1025 Thomas Jefferson Street, NW                       30,200     American Institutes for Research (AIR)                     Expansion                       West End/Georgetown

505 9th Street, NW                                     25,100     Solar Energy Industry Association (SEIA)                   Sublet                                  East End

Key Sales Transactions 3Q 12
PROPERTY                                             SF             SELLER/BUYER                                             PRICE                                SUBMARKET

409 3rd Street, SW                                    420,122     Vornado Realty Trust / Hobby Lobby Corporation             $200,000,000                           Southwest

607 14th Street, NW                                   270,158     DEKA Immobilien / New York Life Insurance Company          $159,359,900                            East End

975 F Street, NW                                      178,200     Akridge & Seaton Benkowski & Partners / GLL Real Estate    $121,400,000                            East End

1025 Thomas Jefferson Street, NW                      315,628     NSP Ventures / The JBG Companies                           $80,500,000                           Georgetown

300 D Street, SW                                      391,089     Vornado Realty Trust / Hobby Lobby Corporation             $50,000,000                            Southwest

1200 17th Street, NW                                   83,187     First Potomac Realty Trust / Mitsui Fudosan America        $43,700,000                                 CBD

900 2nd Street, NE                                    115,394     Potomac Development Corporation / Fluorine, LLC            $30,500,000                              NoMA


                                                                                                                                            Urmi Joshi
About Cassidy Turley                                                                                                                        Senior Research Analyst


Cassidy Turley is a leading commercial real estate services provider with more than 3,600 professionals in more than 60 offices             2101 L Street, NW
nationwide. The company represents a wide range of clients—from small businesses to Fortune 500 companies, from local non-                  Suite 700
profits to major institutions. The firm completed transactions valued at $22 billion in 2011, manages 455 million square feet on            Washington, DC 20037
behalf of institutional, corporate and private clients and supports more than 28,000 domestic corporate services locations. Cassidy         Tel: 202.463.2100
                                                                                                                                            Fax: 202.223.2989
Turley serves owners, investors and tenants with a full spectrum of integrated commercial real estate services—including capital
                                                                                                                                            Urmi.Joshi@cassidyturley.com
markets, tenant representation, corporate services, project leasing, property management, project and development services, and
research and consulting. Cassidy Turley enhances its global service delivery outside of North America through a partnership with            The information contained within this report is
                                                                                                                                            gathered from multiple sources considered to be
GVA, giving clients access to commercial real estate professionals in 65 international markets. Please visit www.cassidyturley.com          reliable. The information may contain errors or
for more information about Cassidy Turley.                                                                                                  omissions and is presented without any warranty
                                                                                                                                            or representations as to its accuracy.	

                                                                                                                                            Copyright © 2012 Cassidy Turley.
                                                                                                                                            All rights reserved.


                                                                                                                                                                 www.cassidyturley.com

More Related Content

Similar to DC 3Q12 Office Snapshot

Q4 2011 - Cincinnati Office
Q4 2011 - Cincinnati OfficeQ4 2011 - Cincinnati Office
Q4 2011 - Cincinnati Officecolliersohio
 
Downtown Chicago Report
Downtown Chicago ReportDowntown Chicago Report
Downtown Chicago Reportjonathanrutman
 
Office market trends and outlook (Q4 2015)
Office market trends and outlook (Q4 2015) Office market trends and outlook (Q4 2015)
Office market trends and outlook (Q4 2015) JLL
 
Q2 2015 Washington, DC office sector report
Q2 2015 Washington, DC office sector reportQ2 2015 Washington, DC office sector report
Q2 2015 Washington, DC office sector reportHeidi Learner
 
Washington, DC Office Sector Report (Q3 2016)
Washington, DC Office Sector Report (Q3 2016)Washington, DC Office Sector Report (Q3 2016)
Washington, DC Office Sector Report (Q3 2016)Savills Studley
 
Cbre office leasing market report 2014
Cbre office leasing market report 2014Cbre office leasing market report 2014
Cbre office leasing market report 2014Chris Fyvie
 
Atlanta Tenants Guide Q409
Atlanta Tenants Guide Q409Atlanta Tenants Guide Q409
Atlanta Tenants Guide Q409dbrowning
 
C&C San Francisco Office Q3 2009
C&C San Francisco Office Q3 2009C&C San Francisco Office Q3 2009
C&C San Francisco Office Q3 2009jonallenwgc77
 
Re-Thinking The Office Market: Office Sector Realities and Strategies (Christ...
Re-Thinking The Office Market: Office Sector Realities and Strategies (Christ...Re-Thinking The Office Market: Office Sector Realities and Strategies (Christ...
Re-Thinking The Office Market: Office Sector Realities and Strategies (Christ...Virtual ULI
 
Market View 1Q2010
Market View 1Q2010Market View 1Q2010
Market View 1Q2010elsantos
 
JLL Detroit Office Insight
JLL Detroit Office InsightJLL Detroit Office Insight
JLL Detroit Office InsightAndrew Batson
 

Similar to DC 3Q12 Office Snapshot (20)

Q4 2011 - Cincinnati Office
Q4 2011 - Cincinnati OfficeQ4 2011 - Cincinnati Office
Q4 2011 - Cincinnati Office
 
Downtown Chicago Report
Downtown Chicago ReportDowntown Chicago Report
Downtown Chicago Report
 
Cincinnati Industrial Insight - Q2 2015
Cincinnati Industrial Insight - Q2 2015Cincinnati Industrial Insight - Q2 2015
Cincinnati Industrial Insight - Q2 2015
 
Q3 2020 | Houston Office | Research & Forecast Report
Q3 2020 | Houston Office | Research & Forecast ReportQ3 2020 | Houston Office | Research & Forecast Report
Q3 2020 | Houston Office | Research & Forecast Report
 
Office market trends and outlook (Q4 2015)
Office market trends and outlook (Q4 2015) Office market trends and outlook (Q4 2015)
Office market trends and outlook (Q4 2015)
 
Q2 2015 Washington, DC office sector report
Q2 2015 Washington, DC office sector reportQ2 2015 Washington, DC office sector report
Q2 2015 Washington, DC office sector report
 
Detroit Industrial Insight Q2 2015
Detroit Industrial Insight   Q2 2015Detroit Industrial Insight   Q2 2015
Detroit Industrial Insight Q2 2015
 
Office Insight Q3 2015-Grand Rapids
Office Insight Q3 2015-Grand RapidsOffice Insight Q3 2015-Grand Rapids
Office Insight Q3 2015-Grand Rapids
 
Washington, DC Office Sector Report (Q3 2016)
Washington, DC Office Sector Report (Q3 2016)Washington, DC Office Sector Report (Q3 2016)
Washington, DC Office Sector Report (Q3 2016)
 
Cbre office leasing market report 2014
Cbre office leasing market report 2014Cbre office leasing market report 2014
Cbre office leasing market report 2014
 
JLL Detroit Office Insight - Q1 2015
JLL Detroit Office Insight - Q1 2015JLL Detroit Office Insight - Q1 2015
JLL Detroit Office Insight - Q1 2015
 
Cw12 q3
Cw12 q3Cw12 q3
Cw12 q3
 
Commercial Real Estate Market Watch for Toronto: September 2012
Commercial Real Estate Market Watch for Toronto: September 2012Commercial Real Estate Market Watch for Toronto: September 2012
Commercial Real Estate Market Watch for Toronto: September 2012
 
Atlanta Tenants Guide Q409
Atlanta Tenants Guide Q409Atlanta Tenants Guide Q409
Atlanta Tenants Guide Q409
 
C&C San Francisco Office Q3 2009
C&C San Francisco Office Q3 2009C&C San Francisco Office Q3 2009
C&C San Francisco Office Q3 2009
 
Q2 2018 Austin Office Research & Forecast Report
Q2 2018 Austin Office Research & Forecast ReportQ2 2018 Austin Office Research & Forecast Report
Q2 2018 Austin Office Research & Forecast Report
 
Re-Thinking The Office Market: Office Sector Realities and Strategies (Christ...
Re-Thinking The Office Market: Office Sector Realities and Strategies (Christ...Re-Thinking The Office Market: Office Sector Realities and Strategies (Christ...
Re-Thinking The Office Market: Office Sector Realities and Strategies (Christ...
 
Market View 1Q2010
Market View 1Q2010Market View 1Q2010
Market View 1Q2010
 
JL
JLJL
JL
 
JLL Detroit Office Insight
JLL Detroit Office InsightJLL Detroit Office Insight
JLL Detroit Office Insight
 

More from kottmeier

Employment Tracker DC Metro: March 2012
Employment Tracker DC Metro: March 2012Employment Tracker DC Metro: March 2012
Employment Tracker DC Metro: March 2012kottmeier
 
2012 State Of The Capital Markets: DC Metro
2012 State Of The Capital Markets: DC Metro2012 State Of The Capital Markets: DC Metro
2012 State Of The Capital Markets: DC Metrokottmeier
 
Why has D.C. multifamily been so hot?
Why has D.C. multifamily been so hot?Why has D.C. multifamily been so hot?
Why has D.C. multifamily been so hot?kottmeier
 
Impacts of Federal Spending Changes on DC Commercial Real Estate
Impacts of Federal Spending Changes on DC Commercial Real EstateImpacts of Federal Spending Changes on DC Commercial Real Estate
Impacts of Federal Spending Changes on DC Commercial Real Estatekottmeier
 
Procurement Spending in the DC Region
Procurement Spending in the DC RegionProcurement Spending in the DC Region
Procurement Spending in the DC Regionkottmeier
 
Implications of Tax Cuts on Commercial Real Estate
Implications of Tax Cuts on Commercial Real EstateImplications of Tax Cuts on Commercial Real Estate
Implications of Tax Cuts on Commercial Real Estatekottmeier
 
BRAC Update 2010
BRAC Update 2010BRAC Update 2010
BRAC Update 2010kottmeier
 
Home Energy Efficiency Report
Home Energy Efficiency ReportHome Energy Efficiency Report
Home Energy Efficiency Reportkottmeier
 

More from kottmeier (8)

Employment Tracker DC Metro: March 2012
Employment Tracker DC Metro: March 2012Employment Tracker DC Metro: March 2012
Employment Tracker DC Metro: March 2012
 
2012 State Of The Capital Markets: DC Metro
2012 State Of The Capital Markets: DC Metro2012 State Of The Capital Markets: DC Metro
2012 State Of The Capital Markets: DC Metro
 
Why has D.C. multifamily been so hot?
Why has D.C. multifamily been so hot?Why has D.C. multifamily been so hot?
Why has D.C. multifamily been so hot?
 
Impacts of Federal Spending Changes on DC Commercial Real Estate
Impacts of Federal Spending Changes on DC Commercial Real EstateImpacts of Federal Spending Changes on DC Commercial Real Estate
Impacts of Federal Spending Changes on DC Commercial Real Estate
 
Procurement Spending in the DC Region
Procurement Spending in the DC RegionProcurement Spending in the DC Region
Procurement Spending in the DC Region
 
Implications of Tax Cuts on Commercial Real Estate
Implications of Tax Cuts on Commercial Real EstateImplications of Tax Cuts on Commercial Real Estate
Implications of Tax Cuts on Commercial Real Estate
 
BRAC Update 2010
BRAC Update 2010BRAC Update 2010
BRAC Update 2010
 
Home Energy Efficiency Report
Home Energy Efficiency ReportHome Energy Efficiency Report
Home Energy Efficiency Report
 

DC 3Q12 Office Snapshot

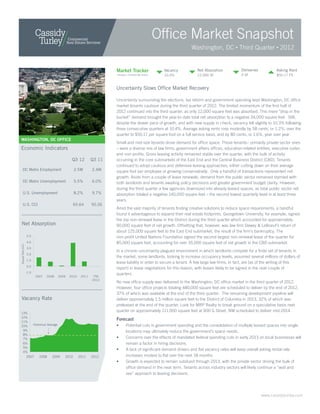
  • 1. Office Market Snapshot Washington, DC • Third Quarter • 2012 Market Tracker Vacancy Net Absorption Deliveries Asking Rent *Arrows = Current Qtr Trend 10.3% 12,000 SF 0 SF $50.17 FS Uncertainty Slows Office Market Recovery Uncertainty surrounding the elections, tax reform and government spending kept Washington, DC office market tenants cautious during the third quarter of 2012. The limited momentum of the first half of 2012 continued into the third quarter, as only 12,000 square feet was absorbed. This mere ”drop in the bucket” demand brought the year-to-date total net absorption to a negative 34,000 square feet. Still, despite the slower pace of growth, and with new supply in check, vacancy fell slightly to 10.3% following three consecutive quarters at 10.4%. Average asking rents rose modestly by 58 cents, or 1.2%, over the quarter to $50.17 per square foot on a full service basis, and by 80 cents, or 1.6%, year over year. WASHINGTON, DC OFFICE Small and mid-size tenants drove demand for office space. Those tenants– primarily private sector ones Economic Indicators – were a diverse mix of law firms, government affairs offices, education-related entities, executive suites and non-profits. Gross leasing activity remained stable over the quarter, with the bulk of activity Q3 12 Q3 11 occurring in the core submarkets of the East End and the Central Business District (CBD). Tenants continued to adopt cautious and defensive leasing approaches, either cutting down on their average DC Metro Employment 2.5M 2.4M square foot per employee or growing conservatively. Only a handful of transactions represented net growth. Aside from a couple of lease renewals, demand from the public sector remained stymied with DC Metro Unemployment 5.5% 6.0% both landlords and tenants awaiting policy decisions and greater government budget clarity. However, during the third quarter a few agencies downsized into already leased spaces, as total public sector net U.S. Unemployment 8.2% 9.7% absorption totaled a negative 140,000 square feet – the second lowest quarterly level in at least three years. U.S. CCI 65.64 50.26 Amid the vast majority of tenants finding creative solutions to reduce space requirements, a handful found it advantageous to expand their real estate footprints. Georgetown University, for example, signed the top non-renewal lease in the District during the third quarter which accounted for approximately Net Absorption 90,000 square feet of net growth. Offsetting that, however, was law firm Dewey & LeBoeuf’s return of about 125,000 square feet to the East End submarket, the result of the firm’s bankruptcy. The 5.0 non-profit United Nations Foundation signed the second largest non-renewal lease of the quarter for 4.0 85,000 square feet, accounting for over 35,000 square feet of net growth in the CBD submarket. Square Feet (mil) 3.0 In a chronic-uncertainty-plagued environment in which landlords compete for a finite set of tenants in 2.0 the market, some landlords, looking to increase occupancy levels, assumed several millions of dollars of 1.0 lease liability in order to secure a tenant. A few large law firms, in fact, are (as of the writing of this 0.0 report) in lease negotiations for this reason, with leases likely to be signed in the next couple of -1.0 quarters. 2007 2008 2009 2010 2011 YTD 2012 No new office supply was delivered to the Washington, DC office market in the third quarter of 2012. However, four office projects totaling 480,000 square feet are scheduled to deliver by the end of 2012, 37% of which was available at the end of the third quarter. The remaining development pipeline will Vacancy Rate deliver approximately 1.5 million square feet to the District of Columbia in 2013, 32% of which was preleased at the end of the quarter. Look for MRP Realty to break ground on a speculative basis next quarter on approximately 111,000 square feet at 900 G Street, NW scheduled to deliver mid-2014. 13% 12% 11% Forecast 10% Historical Average • Potential cuts in government spending and the consolidation of multiple leased spaces into single 9% locations may ultimately reduce the government’s space needs. 8% 7% • Concerns over the effects of mandated federal spending cuts in early 2013 on local businesses will 6% remain a factor in hiring decisions. 5% • A lack of significant demand drivers and flat vacancy rates will keep overall asking rental rate 4% 2007 2008 2009 2010 2011 2012 increases modest to flat over the next 18 months. • Growth is expected to remain subdued through 2013, with the private sector driving the bulk of office demand in the near term. Tenants across industry sectors will likely continue a “wait and see” approach to leasing decisions. www.cassidyturley.com
  • 2. Cassidy Turley Office Market Snapshot Washington, DC • Third Quarter • 2012 UNDER SUBLET TOTAL VACANCY CURRENT YTD AVERAGE VACANT ABSORPTION ABSORPTION CONSTRUC- TOTAL BLDG INVENTORY VACANT RATE ASKING RENT TION Submarket CBD 252 38,801,607 453,362 4,865,751 12.5% 71,523 169,224 248,697 $51.00 East End 201 39,225,153 302,891 3,837,882 9.8% (88,133) (171,796) 539,644 $53.02 West End/Georgetown 59 6,019,052 27,939 607,164 10.1% 23,950 26,653 0 $41.20 Capitol Hill 42 4,272,688 20,871 174,251 4.1% (6,218) 13,462 336,085 $55.56 NoMa 37 9,636,850 21,349 1,036,731 10.8% (12,104) (21,891) 623,817 $45.78 Southwest 36 13,907,238 1,000 963,782 6.9% (30,117) (39,237) 0 $49.41 Capitol Riverfront/Southeast 11 3,736,758 17,200 646,748 17.3% 21,972 (25,749) 0 $46.48 Uptown 95 6,308,307 47,747 468,279 7.4% 30,686 15,541 196,013 $39.39 TOTAL 733 121,907,653 892,359 12,600,588 10.3% 11,559 (33,793) 1,944,256 $50.17 Key Lease Transactions 3Q 12 PROPERTY SF TENANT TRANSACTION SUBMARKET 601 New Jersey Avenue, NW 217,300 GSA - Federal Trade Commission (FTC) Renewal Capitol Hill 650 Massachusetts Avenue, NW 91,200 Georgetown University Relet East End 1750 Pennsylvania Avenue, NW 85,000 United Nations Foundation Relet CBD 901 F Street, NW 77,000 Gallup, Inc. Renewal East End 1299 Pennsylvania Avenue, NW 75,300 Cooley LLP Relet East End 1331 F Street, NW 62,100 GSA - Department of Justice (DoJ) Renewal East End 1100 New York Avenue, NW 41,300 Gilbert LLP Renewal East End 1025 Thomas Jefferson Street, NW 30,200 American Institutes for Research (AIR) Expansion West End/Georgetown 505 9th Street, NW 25,100 Solar Energy Industry Association (SEIA) Sublet East End Key Sales Transactions 3Q 12 PROPERTY SF SELLER/BUYER PRICE SUBMARKET 409 3rd Street, SW 420,122 Vornado Realty Trust / Hobby Lobby Corporation $200,000,000 Southwest 607 14th Street, NW 270,158 DEKA Immobilien / New York Life Insurance Company $159,359,900 East End 975 F Street, NW 178,200 Akridge & Seaton Benkowski & Partners / GLL Real Estate $121,400,000 East End 1025 Thomas Jefferson Street, NW 315,628 NSP Ventures / The JBG Companies  $80,500,000 Georgetown 300 D Street, SW 391,089 Vornado Realty Trust / Hobby Lobby Corporation $50,000,000 Southwest 1200 17th Street, NW 83,187 First Potomac Realty Trust / Mitsui Fudosan America $43,700,000 CBD 900 2nd Street, NE 115,394 Potomac Development Corporation / Fluorine, LLC $30,500,000 NoMA Urmi Joshi About Cassidy Turley Senior Research Analyst Cassidy Turley is a leading commercial real estate services provider with more than 3,600 professionals in more than 60 offices 2101 L Street, NW nationwide. The company represents a wide range of clients—from small businesses to Fortune 500 companies, from local non- Suite 700 profits to major institutions. The firm completed transactions valued at $22 billion in 2011, manages 455 million square feet on Washington, DC 20037 behalf of institutional, corporate and private clients and supports more than 28,000 domestic corporate services locations. Cassidy Tel: 202.463.2100 Fax: 202.223.2989 Turley serves owners, investors and tenants with a full spectrum of integrated commercial real estate services—including capital Urmi.Joshi@cassidyturley.com markets, tenant representation, corporate services, project leasing, property management, project and development services, and research and consulting. Cassidy Turley enhances its global service delivery outside of North America through a partnership with The information contained within this report is gathered from multiple sources considered to be GVA, giving clients access to commercial real estate professionals in 65 international markets. Please visit www.cassidyturley.com reliable. The information may contain errors or for more information about Cassidy Turley. omissions and is presented without any warranty or representations as to its accuracy. Copyright © 2012 Cassidy Turley. All rights reserved. www.cassidyturley.com