EpiExplorer: live exploration and global analysis of large epigenomic datasets
http://epiexplorer.mpi-inf.mpg.de/
Publication: http://genomebiology.com/2012/13/10/r96
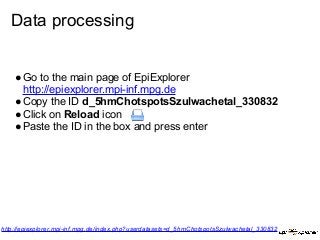
Data processing
●Go tothe main page of EpiExplorer
http://epiexplorer.mpi-inf.mpg.de
●Copy the ID d_5hmChotspotsSzulwachetal_330832
●Click on Reload icon
●Paste the ID in the box and press enter
http://epiexplorer.mpi-inf.mpg.de/index.php?userdatasets=d_5hmChotspotsSzulwachetal_330832
3.
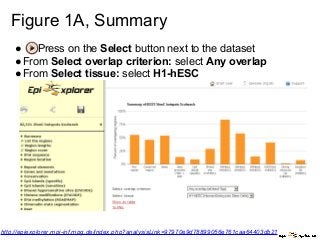
Figure 1A, Summary
●Press on the Select button next to the dataset
●From Select overlap criterion: select Any overlap
●From Select tissue: select H1-hESC
http://epiexplorer.mpi-inf.mpg.de/index.php?analysisLink=97970e9d78899056e761caa64403db21
4.
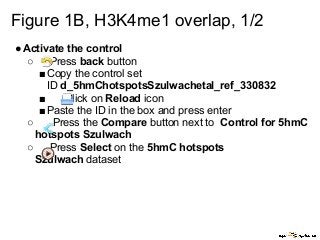
Figure 1B, H3K4me1overlap, 1/2
●Activate the control
○ Press back button
■Copy the control set
ID d_5hmChotspotsSzulwachetal_ref_330832
■ Click on Reload icon
■Paste the ID in the box and press enter
○ Press the Compare button next to Control for 5hmC
hotspots Szulwach
○ Press Select on the 5hmC hotspots
Szulwach dataset
5.
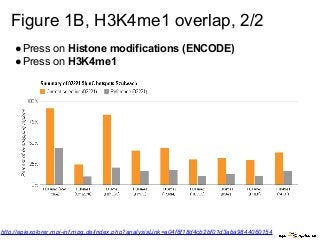
Figure 1B, H3K4me1overlap, 2/2
●Press on Histone modifications (ENCODE)
●Press on H3K4me1
http://epiexplorer.mpi-inf.mpg.de/index.php?analysisLink=a04f8f18d4cb2bf01d3aba9844060154
6.
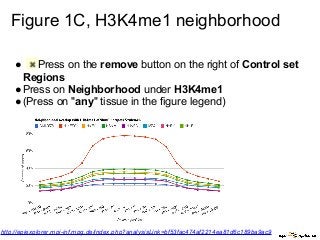
Figure 1C, H3K4me1neighborhood
● Press on the remove button on the right of Control set
Regions
●Press on Neighborhood under H3K4me1
●(Press on "any" tissue in the figure legend)
http://epiexplorer.mpi-inf.mpg.de/index.php?analysisLink=bf53fac474af2214ea81d6c189ba9ac9
7.
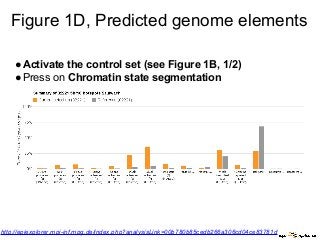
Figure 1D, Predictedgenome elements
●Activate the control set (see Figure 1B, 1/2)
●Press on Chromatin state segmentation
http://epiexplorer.mpi-inf.mpg.de/index.php?analysisLink=00b780b85cedb266a306cd04ce83781d
8.
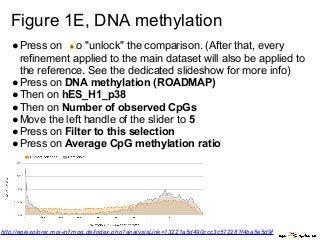
Figure 1E, DNAmethylation
●Press on to "unlock" the comparison. (After that, every
refinement applied to the main dataset will also be applied to
the reference. See the dedicated slideshow for more info)
●Press on DNA methylation (ROADMAP)
●Then on hES_H1_p38
●Then on Number of observed CpGs
●Move the left handle of the slider to 5
●Press on Filter to this selection
●Press on Average CpG methylation ratio
http://epiexplorer.mpi-inf.mpg.de/index.php?analysisLink=13221a5d490ccc3c572281f4ba5e5d9f
9.
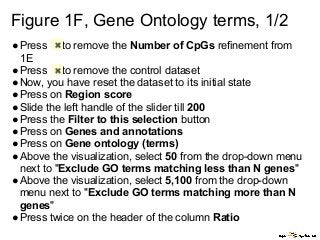
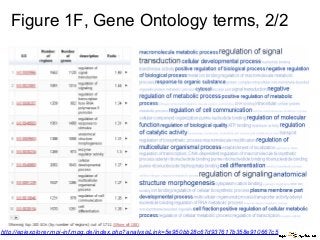
Figure 1F, GeneOntology terms, 1/2
●Press to remove the Number of CpGs refinement from
1E
●Press to remove the control dataset
●Now, you have reset the dataset to its initial state
●Press on Region score
●Slide the left handle of the slider till 200
●Press the Filter to this selection button
●Press on Genes and annotations
●Press on Gene ontology (terms)
●Above the visualization, select 50 from the drop-down menu
next to "Exclude GO terms matching less than N genes"
●Above the visualization, select 5,100 from the drop-down
menu next to "Exclude GO terms matching more than N
genes"
●Press twice on the header of the column Ratio