Downloaded 24 times
![Team Cohesion and Embedding Sailer, July 2014
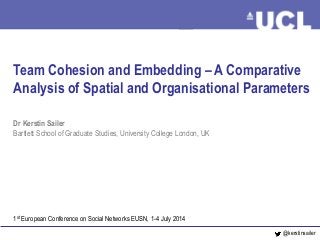
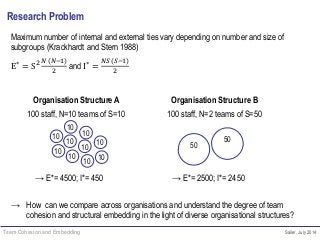
Methodology
SNA:
Online survey of each organisation; survey distributed to all staff
members; return quote: 49% (lowest) to 90% (highest);
Asked each participant to name top 25 contacts and indicate
frequency of face-to-face encounter and usefulness;
Analysis of network of strong ties (daily encounter, extremely useful);
Network attributes: team affiliation, floor where desk is
Calculating E-I index, Expected E-I index, Yule’s Q
Spatial Analysis:
Anaysis of spatial configuration: calculating levels
of spatial overall closeness centrality in the office
building using Space Syntax methods
[average mean depth of all paths];](https://image.slidesharecdn.com/sailerteamembedding2-140706085408-phpapp02/85/Spatial-and-organisatinonal-parameters-in-social-network-structures-of-teams-7-320.jpg?cb=1422402259)
![Team Cohesion and Embedding Sailer, July 2014
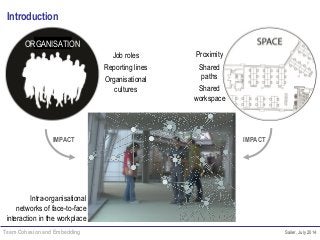
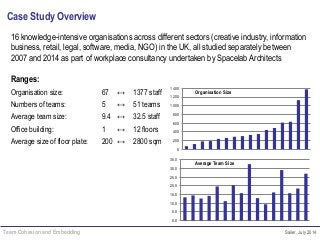
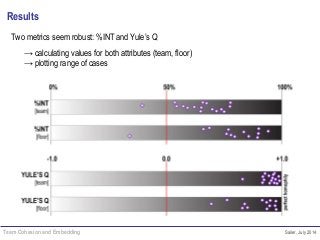
Results – Analysing
single cases
CASE 7
Post prod
house
BENCHMARK
all org.
CASE 9
large retail
organisation
Percentage of internal ties
[%INT]: depicts patterns of
interaction and degree to which
they span team boundaries and
reach across floors
Yule’s Q [team]: depicts degree
of organisational structure as a
barrier
Yule’s Q [floor]: depicts degree of
spatial structure as a barrier](https://image.slidesharecdn.com/sailerteamembedding2-140706085408-phpapp02/85/Spatial-and-organisatinonal-parameters-in-social-network-structures-of-teams-11-320.jpg?cb=1422402259)
![Team Cohesion and Embedding Sailer, July 2014
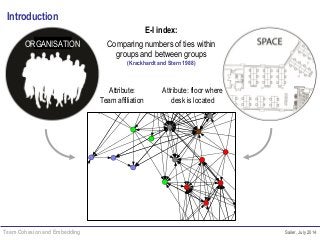
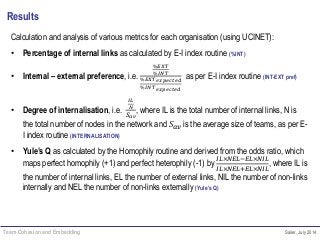
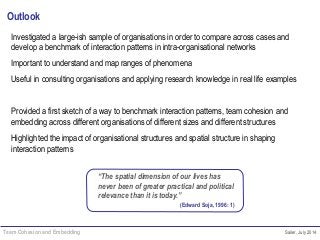
Results – Exploring the Impact of Spatial Structure
Correlation between Yule’s Q [team] and Average Mean Depth
(r=0.624*, p<0.017) (if outlier case 3 is excluded)
0.820
0.840
0.860
0.880
0.900
0.920
0.940
0.960
0.980
1.000
0.000 2.000 4.000 6.000 8.000 10.000
Yule'sQ[team]
Average MD
Case14–Strategicvisibilityinoffice(closenesscentrality)
→ Offices with higher levels of overall visibility tend to
host more heterophilous interactions, i.e. allow more
interactions between colleagues of different teams
Integrated Segregated](https://image.slidesharecdn.com/sailerteamembedding2-140706085408-phpapp02/85/Spatial-and-organisatinonal-parameters-in-social-network-structures-of-teams-12-320.jpg?cb=1422402259)


Patterns of interaction within organisations are driven by job roles, reporting lines and organisational culture. In addition to these organisational parameters, it has been shown that the design and layout of workplaces plays an important role, too. For instance, spatial proximity between colleagues has a measurable impact on the frequency of face-to-face interaction. Thus both organisational dimensions as well as spatial configuration can be argued to jointly shape the structure of intra-organisational networks. Previous research on intra-organisational networks has mostly focused on investigating single cases or small samples. A comparative analysis across cases is interesting, since it provides an opportunity to understand how one case compares against others and whether results of one case can be inferred to other cases. It also allows mapping top and bottom ranges of phenomena, and understanding the strength and consistency of a relationship between a set of variables across cases. However, this also presents a challenging methodological problem: how is it possible to compare metrics between cases and how can these metrics be normalised? For instance, the E-I index measures group embedding according to an attribute of interest (e.g. team affiliation), yet the structure of an organisation (number and size of teams) will have an influence on the outcomes, too. Using a data set of 15 cases of different knowledge-based organisations (all studied separately from 2007-2013 with the same methodology of investigating social networks of interaction through self-reported surveys), this paper presents a larger scale cross-case analysis on the relationship between spatial configuration of a workplace and the emerging network structures of interaction. With a focus on team cohesion, clustering and embedding, it will provide a first sketch of different metrics and parameters (both organisational and spatial) to compare intra-organisational networks of interaction.


