NPI Evaluation of KIPP Foundation
•
1 like•985 views

Based on NPI's analysis, the KIPP Foundation has exhibited strength in support and revenue growth and shown an ability to scale its impact commensurately. Further, the foundation’s measurable results, transparency and operating efficiency provide a high degree of confidence in the leadership team to execute on its vision.

Recommended
Recommended
More Related Content
More from Nonprofit Investor
More from Nonprofit Investor (20)
Recently uploaded
Recently uploaded (20)
NPI Evaluation of KIPP Foundation
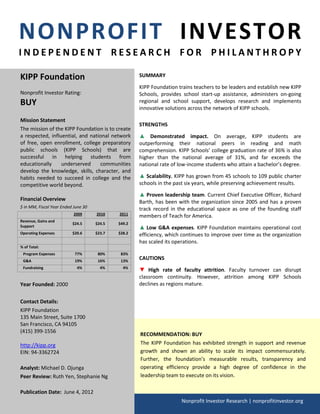
- 1. NONPROFIT INVESTOR INDEPENDENT RESEARCH FOR PHILANTHROPY KIPP Foundation SUMMARY KIPP Foundation trains teachers to be leaders and establish new KIPP Nonprofit Investor Rating: Schools, provides school start-up assistance, administers on-going BUY regional and school support, develops research and implements innovative solutions across the network of KIPP schools. Mission Statement STRENGTHS The mission of the KIPP Foundation is to create a respected, influential, and national network ▲ Demonstrated impact. On average, KIPP students are of free, open enrollment, college preparatory outperforming their national peers in reading and math public schools (KIPP Schools) that are comprehension. KIPP Schools’ college graduation rate of 36% is also successful in helping students from higher than the national average of 31%, and far exceeds the educationally underserved communities national rate of low-income students who attain a bachelor’s degree. develop the knowledge, skills, character, and habits needed to succeed in college and the ▲ Scalability. KIPP has grown from 45 schools to 109 public charter competitive world beyond. schools in the past six years, while preserving achievement results. ▲ Proven leadership team. Current Chief Executive Officer, Richard Financial Overview Barth, has been with the organization since 2005 and has a proven $ in MM, Fiscal Year Ended June 30 track record in the educational space as one of the founding staff 2009 2010 2011 members of Teach for America. Revenue, Gains and $24.5 $24.5 $49.2 Support ▲ Low G&A expenses. KIPP Foundation maintains operational cost Operating Expenses $20.6 $23.7 $28.2 efficiency, which continues to improve over time as the organization has scaled its operations. % of Total: Program Expenses 77% 80% 83% G&A 19% 16% 13% CAUTIONS Fundraising 4% 4% 4% ▼ High rate of faculty attrition. Faculty turnover can disrupt classroom continuity. However, attrition among KIPP Schools Year Founded: 2000 declines as regions mature. Contact Details: KIPP Foundation 135 Main Street, Suite 1700 San Francisco, CA 94105 (415) 399-1556 RECOMMENDATION: BUY http://kipp.org The KIPP Foundation has exhibited strength in support and revenue EIN: 94-3362724 growth and shown an ability to scale its impact commensurately. Further, the foundation’s measurable results, transparency and Analyst: Michael D. Ojunga operating efficiency provide a high degree of confidence in the Peer Review: Ruth Yen, Stephanie Ng leadership team to execute on its vision. Publication Date: June 4, 2012 Nonprofit Investor Research | nonprofitinvestor.org
- 2. OVERVIEW OF KIPP FOUNDATION’S ACTIVITIES The Knowledge is Power Program (“KIPP”) was founded in 1994 by Mike Feinberg and Dave Levin in order to create a school environment where students develop the knowledge, skills, character, and habits necessary to succeed in college and beyond. In 2000, Mike and Dave formed a partnership with Doris and Donald Fisher, co-founders of Gap Inc., to establish the KIPP Foundation in order to train leaders to replicate the success of the original KIPP middle schools. Since formation, the KIPP Foundation has supported the expansion to 109 KIPP public charter schools and development of over 1,000 leaders. Leadership Development (41% of total Program Services expenses) The KIPP Foundation trains teachers to be leaders and establishes new KIPP Schools through its year long KIPP School Leadership Program (“KSLP”). KSLP has two tracks: The Fisher Fellowship and the Leadership Pathways Program. The Fisher Fellowship focuses on opening and leading new KIPP Schools and consists of a six-week course intensive program at New York University, residencies at KIPP and other high-performing charter schools, and several training conferences held throughout the year. The Leadership Pathways Program takes place with four different cohorts and is aimed at developing staff to take over leadership roles within their current KIPP School, or at another KIPP School. School Start-Up Support Services (3% of total Program Services expenses) In order for schools to start up successfully, the KIPP Foundation recruits outstanding teachers to develop into new school leaders. It also provides school start-up assistance in the areas of programming, real estate, and community relations in the location that the school will be serving. On-Going Regional and School Support (39% of total Program Services expenses) The KIPP Foundation provides on-going assistance to existing KIPP Schools and regions in the area of professional development, curriculum, instructional support, school operations, real estate, fundraising, and marketing. Research and Evaluation (17% of total Program Services expenses) The KIPP Foundation focuses on the integration of data-informed decision making at the national, regional and KIPP School level. The KIPP Foundation is committed to the idea of data informed decisions about resource allocation, programming, instruction, operations, external messaging, and growth. To develop outstanding school leaders, the KIPP Foundation created the research-based KIPP Leadership Competency Model (“LCM”), which defines skills critical to successful school leadership. The LCM is the cornerstone of the KIPP Foundation’s national efforts to train, coach, and evaluate school leaders. Building upon the success of the LCM, in 2011, school and regional leaders developed and tested a new model called the KIPP Framework for Excellent Teaching (“KFET”) to define a vision for excellent teaching at KIPP. Leaders use the model to coach teachers, measure their performance, and help develop their skills. It also provides KIPP teachers, leaders, and coaches with a common language around the art and science of excellent instruction to aid sharing and help teachers refine their craft. This framework captures teaching competencies and behaviors—such as building relationships with students and families, creating a joyful classroom culture, and using student data to customize instruction—that lead to classroom breakthroughs. KIPP Foundation | Nonprofit Investor Research 2
- 3. FINANCIAL OVERVIEW REVENUES, GAINS AND SUPPORT In 2011, 71% of the KIPP Foundation’s support, gains and revenues were sourced through contributions, with approximately 21% funded through government grants. This composition of funding represents a stark contrast from the previous year in which 85% of the KIPP Foundation’s support, gains and revenues were supported through contributions and approximately 2% by government grants. The KIPP Foundation was awarded a two year $14.5 million federal grant from the U.S. Department of Education under the Charter School Program: Grants for Replication and Expansion of High-Quality Charter Schools, in 2011. Also in 2011, the KIPP Foundation was awarded a five year $50 million federal grant from the U.S. Department of Education under the Investing in Innovation Fund (“i3”): Scale-Up Grants. While the composition of the KIPP Foundation’s support, gains and revenues has changed with the addition of substantial government grants, the foundation remains well positioned financially as contributions increased by 67% year-over-year in 2011, as a result of the 20% funding match requirement stipulated under the i3 program. The KIPP Foundation earns significant revenue through fee based services received from KIPP Schools and Regions and unrelated parties for conferences. Fees are also generated from KIPP Schools and unrelated parties for participation in KIPP School Leadership Pathways Programs, and services provided for network hosting and email services. Additionally, the KIPP Foundation generates license fee income from each KIPP School as percentage of local revenue with a maximum of $30,000 per school. In recent years, the KIPP Foundation has recognized revenue for the donation of professional services, which NPI believes can be increased in the future to lessen the foundation’s dependence on contributions and government grants. EXPENSES 2011 Funding Mix The KIPP Foundation has historically spent an average of Contributions 18% of operating expenses 1% 2% through administrative costs. In 6% Government Grants 2011 this percentage fell to 13%, resulting in 83% of operating 21% expenses being dedicated to Fee Income program expenditures. Going forward, this cost efficiency will 71% be paramount in the KIPP Contributed Services Foundation’s efforts to focus expenditure on program Other services. The KIPP Foundation clearly delineates management compensation in the Form 990, e and it is consistent with the individuals respective experience level and industry practices. NET ASSETS As a shield against cyclical downturns, the KIPP Foundation maintains a positive liquidity profile, with an unrestricted cash balance of $13.4 million, short-term investments of $2.7 million, net working capital of $5.5 million, with $7.0 million of long-term liabilities related to the KIPP Credit Enhancement Program (“KCEP”) partially offset by $5.2 million in KIPP Foundation | Nonprofit Investor Research 3
- 4. cash and short-term investments restricted for KCEP. As of June 30, 2011, the KIPP Foundation maintained an asset to expenses ratio of 1.3x, implying that the KIPP Foundation would be able to maintain its activities for greater than a year if its revenues ceased. Detailed Financial Statement (GAAP basis)(1) Fiscal Year Ended June 30 2008 2009 2010 2011 Revenues, Gains and Support: Unrestricted Contributions $9,803,112 $10,105,510 $12,353,550 $15,529,305 Restricted Contributions 5,247,538 10,704,508 8,498,847 19,375,739 Government Grants - 9,969 85,335 4,341,456 Government Grants - School Designated Grants - 815,530 322,798 6,172,700 Private Contributions - School Designated Grants 270,100 - - - Contributed Services 159,643 743,363 944,333 750,606 Service Fee Income 474,050 897,549 838,094 1,157,739 License Fee Income 811,936 920,644 1,267,694 1,629,636 Investment Income 373,040 142,166 40,802 59,166 Rental Income 356,939 203,257 184,433 30,723 Miscellaneous Income 10,721 5,425 12,954 177,732 Loss on Sale of Fixed Assets (1,664) (22,980) (162) - Total Revenues, Gains and Support $17,505,415 $24,524,941 $24,548,678 $49,224,802 % Growth 40.1% 0.1% 100.5% Revenues, Gains and Support Sources Contributions 86.0% 84.9% 84.9% 70.9% Government Grants 0.0% 3.4% 1.7% 21.4% Contributed Services 0.9% 3.0% 3.8% 1.5% Fee Income 7.3% 7.4% 8.6% 5.7% Other 5.8% 1.3% 1.0% 0.5% Expenses: Program Services: Leadership Development $6,493,627 $8,324,810 $8,157,340 $9,568,163 School Start-Up Support Services 1,627,215 1,161,201 1,567,031 720,416 On-going School Support Services 2,953,451 4,391,275 6,527,389 8,998,758 Research and Evaluation 871,228 2,122,942 2,635,645 3,994,663 Total Program Services $11,945,521 $16,000,228 $18,887,405 $23,282,000 Program Services Allocation Leadership Development 54.4% 52.0% 43.2% 41.1% School Start-Up Support Services 13.6% 7.3% 8.3% 3.1% On-going School Support Services 24.7% 27.4% 34.6% 38.7% Research and Evaluation 7.3% 13.3% 14.0% 17.2% Support Services: Administration $3,109,032 $3,837,549 $3,908,752 $3,709,820 Fundraising 915,759 781,953 935,753 1,202,430 Total Support Services $4,024,791 $4,619,502 $4,844,505 $4,912,250 Total Operating Expenses $15,970,312 $20,619,730 $23,731,910 $28,194,250 Grants to Schools $2,730,438 $2,392,026 $1,997,945 $8,071,307 Total Expenses $18,700,750 $23,011,756 $25,729,855 $36,265,557 % of Revenues, Gains and Support 107% 94% 105% 74% Change in Assets (Revenues Less Expenses) ($1,195,335) $1,513,185 ($1,181,177) $12,959,245 Program Costs as a % of Operating Expenses 74.8% 77.6% 79.6% 82.6% G&A as a % of Operating Expenses 19.5% 18.6% 16.5% 13.2% Fundraising as a % of Operating Expenses 5.7% 3.8% 3.9% 4.3% Source: Audited Financial Statements (prepared on GAAP basis) (1) According to financial statements (prepared on GAAP basis) as audited by Hood & Strong, LLP KIPP Foundation | Nonprofit Investor Research 4
- 5. Operating Expense Breakdown Program Services Expense Breakdown $ in MM $ in MM $30 $28 100% $25 $23 83% 90% 78% 80% $25 75% $4 80% Program Expense % of Total $20 $19 $21 $24 70% $20 $3 $16 60% Expenses $16 $15 $2 $9 Expenses $15 50% $12 $7 $1 $4 40% $10 $3 $1 $10 $1 $2 30% $2 20% $5 $5 $10 10% $8 $8 $6 $0 0% 2008 2009 2010 2011 $0 2008 2009 2010 2011 Program Expenses Fundraising Leadership Development School Start-Up Support Services Management and General Program Expense % of Total On-going School Support Services Research and Evaluation PROGRAM RESULTS AND EFFECTIVENESS Operating under the umbrella of the KIPP Foundation, many KIPP Schools have been subject to studies that make a compelling case that KIPP Schools improve students’ academic performance as measured by state and national standardized math and reading exams. Additionally, the KIPP Foundation’s internal monitoring program, its annual report card, provides data consistent with the idea that KIPP Schools have a significant impact on students’ academic achievement. STUDENTS KIPP Schools serve predominantly poor and minority students at varying grade levels. While KIPP students have been found to make above-average progress compared with national levels, it has been found that KIPP Schools do not attract relatively higher performing students than its non-KIPP School counterparts. Given the rigorous demands put on students, it is not surprising that KIPP Schools have high attrition rates, and students who leave start out lower performing and benefit less from their time at KIPP Schools. FACULTY The KIPP Foundation has designed its program to give respective KIPP School leaders significant autonomy. The KIPP Foundation aims to ensure the success of its school leaders and teachers’ success by submitting them to a rigorous screening process and an intensive training program, followed by ongoing support. The KIPP Foundation places a great deal of importance on teacher and leader selection and reserves the right to remove the KIPP name from schools that feel to meet its quality standards. As a result of the demanding nature of the job and the ambitious individuals that KIPP recruits, KIPP School attrition is high. Approximately 27% of faculty leaves KIPP Schools each year. KIPP Foundation | Nonprofit Investor Research 5
- 6. CURRICULUM While each KIPP School maintains its own unique curriculum, the KIPP Foundation exerts influence in each school’s adherence to the Foundation’s overarching pillars. Students are expected to be on track to succeed in a college preparatory high school curriculum and beyond. KIPP Schools are generally in session for longer periods of the day than comparable public schools, allowing students to have extended instructional time and access to teachers. As the KIPP Foundation is continually evaluating its methods, KIPP teachers and leaders have access to a variety of learning and developmental opportunities including conferences, seminars, and training events sponsored by both KIPP and others. RESULTS The KIPP Foundation states that 94% of KIPP 8th grade classes outperform their districts in reading, while 96% do so in math. To support the mission of the Foundation, a customized program was developed to track students and continue their development through college. According to KIPP Foundation management, approximately three-quarters of KIPP students / alumni are participants in KIPP Through College programs. NPI believes that this program in concert with instruction at KIPP Schools has a demonstrative positive effect on students’ success in graduating from college. KIPP Schools maintain a college graduation rate of 36%; greater than the national average of 31% and far exceeding the rate of low income students who attain a bachelor’s degree. TRANSPARENCY The KIPP Foundation’s website provides information about the organization's programs, leadership and financial situation. Program services expenses are well documented in their audited financial statements. Additionally, the KIPP Foundation’s annual Report Card provides a detailed analysis of the results of the foundation’s efforts and efficacy of their programs on a school-by-school basis. To complement their own internal analysis, the KIPP Foundation provides numerous links on its website to third-party evaluations and analysis pertaining to KIPP School’s effectiveness. The KIPP Foundation files its Form 990 with the IRS each year and its financial statements are regularly audited by the accounting firm Hood & Strong, LLP. OTHER THIRD PARTY RATINGS • GiveWell states that “The Knowledge is Power Program (KIPP) is our top-ranked United States organization.” In addition, they adhere to the belief that “KIPP improves educational outcomes of the students it serves.” • Philanthropedia’s expert network rated the KIPP Foundation a “2010 Top Non-Profit” with 48 experts viewing the KIPP Foundation as the nonprofit with the most impact in its field, while 5 experts disagreed with that assessment. o Strengths include: They have developed highly successful charter schools and are now developing them at scale, something that has challenged so much of the charter community. KIPP has excelled in ensuring quality and consistency across its schools while growing quickly. The organization benefits from strong and focused leadership. Their leadership, tight vision, focus, and willingness to learn as an organization are strengths. o Areas for Improvement include: They should improve the retention of teachers to reduce teacher turnover. A large number of students do not graduate from the program. They need to find creative and legislative ways for districts to replicate the KIPP model. KIPP Foundation | Nonprofit Investor Research 6
- 7. GET INVOLVED • Donate: http://www.kipp.org/about-kipp/support-kipp • Support Individual Regions: http://www.kipp.org/schools/kipp-regions • Support Individual Schools: http://www.kipp.org/schools/school-directory DISCLOSURES Michael Ojunga certifies that he does not have any affiliation with KIPP Foundation and has never made a donation to the organization. Additionally, Michael has not supported directly competing organizations in a greater capacity than a nominal donation. NPI analysts and NPI as an organization do not receive any form of compensation from reviewed charities. This report is for informational purposes only and does not constitute a solicitation for donations. While the reliability of information contained in this report has been assessed by NPI, NPI makes no representation as to its accuracy or completeness, except with respect to the Disclosure Section of the report. Any opinions expressed herein reflect our judgment as of the date of the materials and are subject to change without notice. NPI has no obligation to update, modify or amend any report or to otherwise notify a reader thereof in the event that any matter stated herein, or any opinion, projection, forecast or estimate set forth herein, changes or subsequently becomes inaccurate, or if research on the subject organization is withdrawn. Opinions and recommendations in our reports do not take into account individual reader circumstances, objectives, or needs and are not intended as recommendations of particular organizations or strategies to particular individuals. The recipients of our reports must make their own independent decisions regarding any organization mentioned in our reports. KIPP Foundation | Nonprofit Investor Research 7