9 Market Reports for The Woodlands TX : July/August 2009

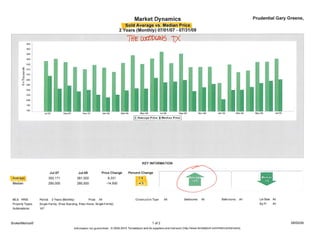
Is The Real Estate Market Improving? Yes. Below, you’ll find a collection of reports that include details for: Sold ~vs Median Price (2 year month by month comparison) In this report you’ll find that the Median Average Sold Price in July was $295,000. Down a scant 4.9% from July 2007. The July Average Sold Price for The Woodlands ( July = $361,502) , edged up 2% compared to the Average Sold Price in 2007. This is great news for Woodlands property owners. Months Supply of For Sale Listing Inventory + Average Number Of Days On Market This report shows the Average Months Supply Of For Sale Inventory is 4.5 Months. But, before we get all giddy, take a look at THIS. Months Supply Of Inventory will vary by price range and by neighborhood. Real estate economists consider 6 months of supply a balanced real estate market. The July Average Number Of Days On The Market for sold listing inventory was 70 days. Real estate agents across the country would kill to work in a market as juicy as ours. We’re fortunate. Sold Price to Original List Price Percentage by Woodlands Broker, Sold Market Share By Broker for Sold Listing Inventory A confession. This report is semi-self serving. Why? Because it’s a break of by Woodlands Broker, what their Sold Price To Original List Price % is. This is important to sellers. The higher the % the more the seller nets at closing. If you were a seller would you rather sell for 96.9% (Prudential Gary Greene, Realtors – The Woodlands Office = the highest %) or 89.9% (The lowest). With an July Average Sold Price of $361,502, every percentage point equals big bucks. Broker Market Share for Closed Listings – Year To Date, By Price Range If you want to know which real estate brokers are selling the most listings, this is the report you want to see. Prudential Gary Greene leads all brokers in homes sold over $350,000, $500,000 and $1,000,000. Listing Inventory and Contracts Written, Month by Month 2007 – 2009 This report show how written contracts and listing inventory ebbs and flows month by month. We have monthly comparison from 2007, 2008 and 2009. Written sales in July surged. Months Supply of For Sale Inventory By Price Ranges – August 2nd, 2009 This report breaks down the Months Supply Of For Sale Listing Inventory by Price Range.