Al Mizhar Dubai Escorts +971561403006 Escorts Service In Al Mizhar
World Leaders Brochure
1. NYSE WORLD LEADERS INDEX
NYSE INDEXES
S
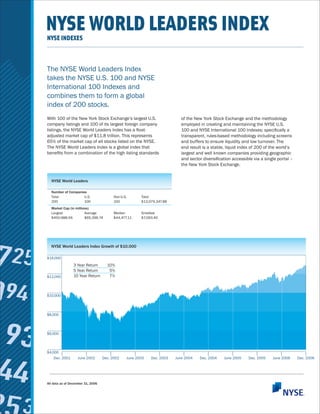
The NYSE World Leaders Index
takes the NYSE U.S. 100 and NYSE
International 100 Indexes and
combines them to form a global
index of 200 stocks.
With 100 of the New York Stock Exchange’s largest U.S. of the New York Stock Exchange and the methodology
company listings and 100 of its largest foreign company employed in creating and maintaining the NYSE U.S.
listings, the NYSE World Leaders Index has a float- 100 and NYSE International 100 Indexes; specifically a
adjusted market cap of $11.8 trillion. This represents transparent, rules-based methodology including screens
65% of the market cap of all stocks listed on the NYSE. and buffers to ensure liquidity and low turnover. The
The NYSE World Leaders Index is a global index that end result is a stable, liquid index of 200 of the world’s
benefits from a combination of the high listing standards largest and well known companies providing geographic
and sector diversification accessible via a single portal –
the New York Stock Exchange.
NYSE World Leaders
Number of Companies
Total U.S. Non-U.S. Total
200 100 100 $13,079,347.88
Market Cap (in millions)
Largest Average Median Smallest
$450,988.56 $65,396.74 $44,477.11 $7,093.40
NYSE World Leaders Index Growth of $10,000
$14,000
3 Year Return 10%
5 Year Return 5%
$12,000 10 Year Return 7%
$10,000
$8,000
$6,000
$4,000
Dec. 2001 June 2002 Dec. 2002 June 2003 Dec. 2003 June 2004 Dec. 2004 June 2005 Dec. 2005 June 2006 Dec. 2006
All data as of December 31, 2006
2. NYSE INDEXES | NYSE WORLD LEADERS INDEX
Morningstar Ownership Zone1
Value Core Growth
S
NYSE World Leaders Fundamentals
2006 2005 2004 2003 2002
The fund centroid
Large
represents weighted Weighted EPS Growth 23.74 32.46 41.78 56.42 21.57
average of domestic Median EPS Growth 16.08 16.60 23.49 21.92 15.01
stock holdings Weighted Revenue Growth 13.65 18.53 15.02 12.44 3.15
Medium
Median Revenue Growth 11.44 12.28 10.83 10.54 3.76
The Ownership
Dividend Yield 2.41 2.45 2.26 2.20 2.28
Zone represents 75%
of fund’s domestic Price to Book 3.51 3.63 3.25 4.17 3.60
PE 16.62 17.22 19.97 26.61 23.26
Small
stock holdings
Annual Total Return 22.11 13.04 12.74 29.30 -11.31
*Ownership zone data is as of July 31st
Risk Measures Trailing Total Returns
3 Year 5 Year % Growth $10K
Standard Deviation 2.02 3.57 6-Month 11.77 $11,176.61
Mean 0.83 0.49 1-Year 17.36 $11,735.91
Sharpe Ratio 0.29 0.08 3-Year Annualized 10.14 $13,359.65
5-Year Annualized 5.25 $12,913.95
*Risk Measures based on monthly returns
Annualized Since Inception 7.76 $22,751.88
Geographic Breakdown Regional Breakdown
Country Number Available Market Weight Region/ Number Available Market Weight
of Stocks Cap (in millions) Country of Stocks Cap (in millions)
Australia 5 $208,521.45 1.59% Europe 61 $4,135,848.00 31.6%
Brazil 2 $46,994.35 0.36% Asia/Pacific 21 $1,091,845.54 8.3%
Canada 14 $464,894.85 3.55% Latin America 3 $87,945.45 0.7%
Chile 5 $377,008.34 2.88% Middle East/Africa 1 $17,474.64 0.1%
China 2 $50,280.60 0.38% 14
Canada $464,894.85 3.6%
Finland 1 $83,891.27 0.64% 100
United States $7,281,339.39 55.7%
France 8 $535,177.16 4.09%
Germany 1 $583,169.68 4.46% Total 200 $13,079,347.88 100.00%
Ireland 2 $51,538.36 0.39%
Italy 4 $186,021.36 1.42%
Japan 10 $723,785.42 5.53%
Mexico 1 $40,951.10 0.31%
Netherlands 6 $299,563.66 2.29% Top Ten Largest Companies
Norway 2 $39,017.68 0.30%
South Africa 1 $17,474.64 0.13% Company Weight
South Korea 3 $65,340.54 0.50% Exxon Mobil Corp. 3.45%
Spain 5 $355,406.05 2.72% General Electric Co. 2.98%
Taiwan 1 $43,917.53 0.34% Citigroup Inc. 2.12%
United Kingdom 19 $1,625,054.43 12.42% Bank of America Corp. 1.85%
United States 100 $7,281,339.39 55.67% BP PLC ADS 1.67%
Total 200 $13,079,347.88 100.00% HSBC Holdings PLC ADS 1.62%
Procter & Gamble Co. 1.57%
Toyota Motor Corp. ADS 1.55%
Johnson & Johnson 1.47%
Pfizer Inc. 1.44%
% Weight Top 10 Holdings 19.72%
All data as of December 31, 2006 unless otherwise indicated.
1
®2007 Morningstar, Inc. All Rights Reserved. The information contained herein: NYSE Euronext, Inc.
(1) is proprietary to Morningstar and/or its content providers; (2) may not be 11 Wall Street
copied or distributed; and (3) is not warranted to be accurate, complete or timely. New York, NY 10005
Neither Morningstar nor its content providers are responsible for any damages or 212.656.3000
losses arising from any use of this information. Past performance is no guarantee www.nyse.com
of future results.