023-Fukuzawa Characteristics of paper publication by major countries focusing on journals
•
0 likes•145 views

Blue Sky 3 - Poster Gallery
Recommended

Recommended
More Related Content
Viewers also liked
Viewers also liked (15)
Similar to 023-Fukuzawa Characteristics of paper publication by major countries focusing on journals
Similar to 023-Fukuzawa Characteristics of paper publication by major countries focusing on journals (20)
More from innovationoecd
More from innovationoecd (20)
Recently uploaded
Recently uploaded (20)
023-Fukuzawa Characteristics of paper publication by major countries focusing on journals
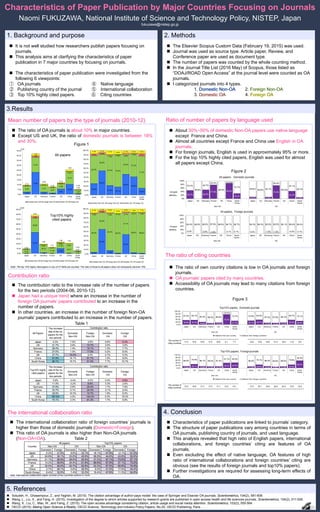
- 1. Characteristics of Paper Publication by Major Countries Focusing on Journals Naomi FUKUZAWA, National Institute of Science and Technology Policy, NISTEP, Japan fukuzawa@nistep.go.jp 1. Background and purpose 2. Methods 3.Results It is not well studied how researchers publish papers focusing on journals. This analysis aims at clarifying the characteristics of paper publication in 7 major countries by focusing on journals. The characteristics of paper publication were investigated from the following 6 viewpoints: ① OA journals ④ Native language ② Publishing country of the journal ⑤ International collaboration ③ Top 10% highly cited papers. ⑥ Citing countries The Elsevier Scopus Custom Data (February 19, 2015) was used. Journal was used as source type. Article paper, Review, and Conference paper are used as document type. The number of papers was counted by the whole counting method. In the Journal Title List (2016 May) of Scopus, those listed as “DOAJ/ROAD Open Access” at the journal level were counted as OA journals. I categorized journals into 4 types. 1. 2. 3. 4. 4. Conclusion 5. References Sotudeh, H., Ghasempour, Z., and Yaghtin, M. (2015). The citation advantage of author-pays model: the case of Springer and Elsevier OA journals. Scientometrics, 104(2), 581-608. Wang, L., Liu, X., and Fang, H. (2015). Investigation of the degree to which articles supported by research grants are published in open access health and life sciences journals. Scientometrics, 104(2), 511-528. Wang, X.. Liu, C., Mao, W., and Famg, Z. (2015). The open access advantage considering citation, article usage and social media attention. Scientometrics, 103(2), 555-564. OECD (2015). Maling Open Science a Reality, OECD Science, Technology and Industry Policy Papers, No.25, OECD Publishing, Paris. Characteristics of paper publications are linked to journals’ category. The structure of paper publications vary among countries in terms of OA journals, publishing country of journals, and used language. This analysis revealed that high ratio of English papers, international collaborations, and foreign countries’ citing are features of OA journals. Even excluding the effect of native language, OA features of high ratio of international collaborations and foreign countries’ citing are obvious (see the results of foreign journals and top10% papers). Further investigations are required for assessing long-term effects of OA. Mean number of papers by the type of journals (2010-12) Contribution ratio The ratio of citing countries The international collaboration ratio Ratio of number of papers by language used The contribution ratio to the increase rate of the number of papers for the two periods (2004-06, 2010-12). Japan had a unique trend where an increase in the number of foreign OA journals’ papers contributed to an increase in the number of papers. In other countries, an increase in the number of foreign Non-OA journals’ papers contributed to an increase in the number of papers. Domestic Non-OA Foreign Non-OA Domestic OA Foreign OA Japan 4.3% 1.0% -2.6% 0.6% 5.3% US 21.7% 3.9% 10.7% 3.5% 3.6% Germany 26.4% 1.4% 16.1% 1.2% 7.7% France 27.0% 1.0% 17.9% 0.2% 8.0% UK 27.7% 10.2% 9.4% 2.7% 5.3% China 91.9% 19.1% 61.7% 1.5% 9.6% South Korea 96.1% 15.7% 61.9% 7.7% 10.7% All Papers The increase rate of the no. papers for the two periods Contribution ratio Domestic Non-OA Foreign Non-OA Domestic OA Foreign OA Japan 0.9% -0.4% -5.0% 0.4% 5.9% US 11.5% -3.2% 8.8% 3.3% 2.6% Germany 37.9% 2.9% 25.4% 1.7% 7.9% France 33.7% 0.1% 24.3% -0.1% 9.4% UK 28.9% 10.3% 10.7% 1.9% 6.0% China 167.0% 4.2% 144.2% 0.3% 18.2% South Korea 75.1% 2.3% 61.2% 1.7% 9.9% Top10% highly cited papers The increase rate of the no. papers for the two periods Contribution ratio Table 1 Note: International collaboration paper consists of two countries authors or more. The international collaboration ratio of foreign countries’ journals is higher than those of domestic journals (Domestic<Foreign). This ratio of OA journals is also higher than Non-OA journals (Non-OA<OA). Table 2 About 30%~50% of domestic Non-OA papers use native language except France and China. Almost all countries except France and China use English in OA journals. For foreign journals, English is used in approximately 95% or more. For the top 10% highly cited papers, English was used for almost all papers except China. Figure 2 The ratio of own country citations is low in OA journals and foreign journals. OA journals’ papers cited by many countries. Accessibility of OA journals may lead to many citations from foreign countries. Figure 3 The ratio of OA journals is about 10% in major countries. Except US and UK, the ratio of domestic journals is between 18% and 30%. Figure 1 2.52 22.83 2.34 1.44 5.61 10.48 0.80 6.09 15.35 7.37 5.77 5.28 13.14 3.67 0.41 1.83 0.17 0.05 0.43 0.43 0.32 0.72 1.97 0.99 0.70 0.73 1.60 0.35 0.00 5.00 10.00 15.00 20.00 25.00 30.00 35.00 40.00 45.00 Japan US Germany France UK China South Korea Domestic Non-OA Foreign Non-OA Domestic OA Foreign OA X104 All papers 25.9% 54.4% 21.6% 18.1% 46.6% 40.9% 15.5% 62.5% 36.6% 67.8% 72.5% 43.8% 51.2% 71.4% 4.2% 4.4% 1.5% 0.6% 3.6% 1.7% 6.2% 7.4% 4.7% 9.1% 8.8% 6.1% 6.2% 6.9% 0.0% 10.0% 20.0% 30.0% 40.0% 50.0% 60.0% 70.0% 80.0% 90.0% 100.0% Japan US Germany France UK China South Korea Domestic Non-OA Foreign Non-OA Domestic OA Foreign OA 0.39 43.32 1.56 0.29 10.28 0.67 0.10 8.18 29.06 16.14 11.35 11.30 19.17 5.00 0.15 3.56 0.30 0.01 0.63 0.05 0.07 0.83 2.91 1.60 1.21 1.46 1.64 0.40 0.00 10.00 20.00 30.00 40.00 50.00 60.00 70.00 80.00 90.00 Japan US Germany France UK China South Korea Domestic Non-OA Foreign Non-OA Domestic OA Foreign OA X103 Top10% highly cited papers 4.1% 54.9% 7.9% 2.3% 43.4% 3.1% 1.8% 85.6% 36.9% 82.3% 88.3% 47.7% 89.0% 89.8% 1.6% 4.5% 1.6% 0.1% 2.7% 0.2% 1.3% 8.7% 3.7% 8.2% 9.4% 6.2% 7.6% 7.1% 0.0% 10.0% 20.0% 30.0% 40.0% 50.0% 60.0% 70.0% 80.0% 90.0% 100.0% Japan US Germany France UK China South Korea Domestic Non-OA Foreign Non-OA Domestic OA Foreign OA Note: The top 10% highly cited papers in any of 27 fields are counted. The ratio of those to all papers does not necessarily become 10%. 0.0% 0.8% 1.5% 0.1% 0.1% 0.0% 1.0% 1.0% 0.2% 0.1% 99.4% 98.8% 98.6% 97.9% 98.6% 99.7% 99.7% 99.3% 96.0% 96.9% 95.6% 96.1% 99.4% 99.4% 0% 20% 40% 60% 80% 100% Japan US Germany France UK China South Korea Japan US Germany France UK China South Korea Non-OA OA All papers, Foreign journals English Native 46.5% 50.2% 77.6% 86.8% 29.3% 10.2% 9.8% 73.9% 42.3% 7.7% 53.2% 99.8% 49.7% 22.0% 99.8% 13.2% 70.7% 89.6% 99.9% 90.1% 25.4% 100.0% 57.1% 92.3% 0% 20% 40% 60% 80% 100% Japan US Germany France UK China South Korea Japan US Germany France UK China South Korea Non-OA OA All papers, Domestic journals English Native 11.0 14.9 14.8 17.5 16.8 4.1 7.7 12.6 15.8 19.6 21.3 18.4 11.6 9.9 15.3 16.0 17.3 17.5 17.1 12.5 15.1 17.0 18.1 18.6 20.5 20.3 15.0 19.2 The number of citing countries The number of citing countries 32.6% 34.3% 19.8% 11.7% 15.0% 76.5% 27.3% 29.1% 35.7% 13.0% 12.2% 14.3% 35.3% 26.9% 67.4% 65.7% 80.2% 88.3% 85.0% 23.5% 72.7% 70.9% 64.3% 87.0% 87.8% 85.7% 64.7% 73.1% 0.0% 20.0% 40.0% 60.0% 80.0% 100.0% Japan US Germany France UK China South Korea Japan US Germany France UK China South Korea Non-OA OA Top10% papers, Domestic journals Citations from own country Citations from foreign countries 13.5% 29.1% 13.9% 11.0% 12.7% 38.3% 40.0% 11.5% 24.9% 13.5% 9.2% 11.4% 24.4% 55.8% 86.5% 70.9% 86.1% 89.0% 87.3% 61.7% 60.0% 88.5% 75.1% 86.5% 90.8% 88.6% 75.6% 44.2% 0.0% 20.0% 40.0% 60.0% 80.0% 100.0% Japan US Germany France UK China South Korea Japan US Germany France UK China South Korea Non-OA OA Top10% papers, Foreignjournals Citations from own country Citations from foreign countries Domestic Foreign Domestic Foreign Domestic Foreign Domestic Foreign Japan 6.2% 31.9% 8.6% 33.1% 16.1% 47.9% 12.1% 51.2% US 24.9% 38.1% 33.0% 45.6% 36.0% 44.6% 43.9% 50.9% Germany 21.1% 56.8% 48.0% 55.9% 47.0% 67.1% 73.5% 67.1% France 14.2% 56.6% 26.9% 61.8% 66.6% 67.9% 57.1% 73.2% UK 35.5% 56.8% 52.7% 62.8% 53.3% 67.5% 65.9% 74.4% China 2.7% 28.1% 5.6% 26.5% 9.0% 41.0% 17.0% 44.4% South Korea 8.4% 32.5% 7.4% 33.3% 15.4% 47.8% 11.3% 54.5% Country All papers Top10% papers Non-OA OA Non-OA OA