1. Financial Discussion
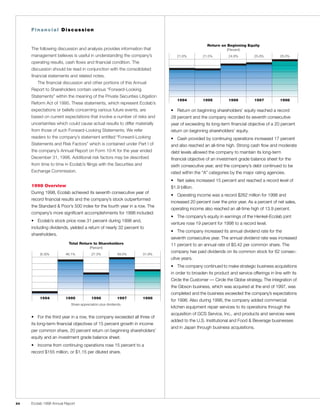
Return on Beginning Equity
The following discussion and analysis provides information that (Percent)
management believes is useful in understanding the company’s 21.6% 21.5% 24.8% 25.8% 28.0%
operating results, cash flows and financial condition. The
discussion should be read in conjunction with the consolidated
financial statements and related notes.
The financial discussion and other portions of this Annual
Report to Shareholders contain various “Forward-Looking
Statements” within the meaning of the Private Securities Litigation
1994 1995 1996 1997 1998
Reform Act of 1995. These statements, which represent Ecolab’s
expectations or beliefs concerning various future events, are • Return on beginning shareholders’ equity reached a record
based on current expectations that involve a number of risks and 28 percent and the company recorded its seventh consecutive
uncertainties which could cause actual results to differ materially year of exceeding its long-term financial objective of a 20 percent
from those of such Forward-Looking Statements. We refer return on beginning shareholders’ equity.
readers to the company’s statement entitled “Forward-Looking • Cash provided by continuing operations increased 17 percent
Statements and Risk Factors” which is contained under Part I of and also reached an all-time high. Strong cash flow and moderate
the company’s Annual Report on Form 10-K for the year ended debt levels allowed the company to maintain its long-term
December 31, 1998. Additional risk factors may be described financial objective of an investment grade balance sheet for the
from time to time in Ecolab’s filings with the Securities and sixth consecutive year, and the company’s debt continued to be
Exchange Commission. rated within the “A” categories by the major rating agencies.
• Net sales increased 15 percent and reached a record level of
1998 Overview $1.9 billion.
During 1998, Ecolab achieved its seventh consecutive year of
• Operating income was a record $262 million for 1998 and
record financial results and the company’s stock outperformed
increased 20 percent over the prior year. As a percent of net sales,
the Standard & Poor’s 500 index for the fourth year in a row. The
operating income also reached an all-time high of 13.9 percent.
company’s more significant accomplishments for 1998 included:
• The company’s equity in earnings of the Henkel-Ecolab joint
• Ecolab’s stock price rose 31 percent during 1998 and,
venture rose 19 percent for 1998 to a record level.
including dividends, yielded a return of nearly 32 percent to
• The company increased its annual dividend rate for the
shareholders.
seventh consecutive year. The annual dividend rate was increased
Total Return to Shareholders 11 percent to an annual rate of $0.42 per common share. The
(Percent)
company has paid dividends on its common stock for 62 consec-
(5.3)% 46.1% 27.3% 49.0% 31.9%
utive years.
• The company continued to make strategic business acquisitions
in order to broaden its product and service offerings in line with its
Circle the Customer — Circle the Globe strategy. The integration of
the Gibson business, which was acquired at the end of 1997, was
completed and the business exceeded the company’s expectations
1994 1995 1996 1997 1998
for 1998. Also during 1998, the company added commercial
Share appreciation plus dividends.
kitchen equipment repair services to its operations through the
acquisition of GCS Service, Inc., and products and services were
• For the third year in a row, the company exceeded all three of
added to the U.S. Institutional and Food & Beverage businesses
its long-term financial objectives of 15 percent growth in income
and in Japan through business acquisitions.
per common share, 20 percent return on beginning shareholders’
equity and an investment grade balance sheet.
• Income from continuing operations rose 15 percent to a
record $155 million, or $1.15 per diluted share.
Ecolab 1998 Annual Report
24
2. All of these acquisitions have been accounted for as purchases Consolidated operating income reached $262 million for 1998,
and, accordingly, the results of their operations have been included an increase of 20 percent over operating income of $219 million in
in the company’s financial statements from the dates of acqui- 1997. Business acquisitions contributed to the growth in operating
sition. Additional information related to these acquisitions is includ- income and accounted for approximately one-fifth of the increase.
ed in Note 6 of the notes to consolidated financial statements. The consolidated operating income margin rose to 13.9 percent
for 1998 and surpassed 1997’s operating income margin of 13.3
percent to reach a new all-time high. A continuation of particularly
Operating Results
strong growth in the U.S. Institutional and Food & Beverage opera-
tions and solid performances by the U.S. Pest Elimination and Kay
Consolidated
businesses were the major contributors to the company’s overall
(thousands, except per share) 1998 1997 1996
profit improvement. Operating income margin growth reflected
Net sales $1,888,226 $1,640,352 $1,490,009
lower selling, general and administrative expenses as a percentage
Operating income $ 261,980 $ 218,504 $ 185,317 of net sales, partially offset by a decrease in the gross profit margin
from last year’s all-time high. Selling, general and administrative
Income
expenses were 41.0 percent of net sales in 1998, a decease from
Continuing operations $ 154,506 $ 133,955 $ 113,185
Discontinued operations 38,000 42.7 percent of net sales in 1997. Selling, general and administrative
Net income $ 192,506 $ 133,955 $ 113,185
expense margins were down for both the company’s United States
and International operations with a significant decrease in the Asia
Diluted income per common share
Continuing operations $ 1.15 $ 1.00 $ 0.85 Pacific region. The improvement in the selling, general and adminis-
Discontinued operations 0.28
trative expense margin reflected the benefits of tight cost controls,
Net income $ 1.44 $ 1.00 $ 0.85
synergies from the integration of businesses acquired, improved
sales productivity and strong sales growth. These benefits were
Consolidated net sales were nearly $1.9 billion for 1998, an partially offset by continued investments in the training and growth
increase of 15 percent over net sales of $1.6 billion in 1997. Both of the sales-and-service force. The gross profit margin was 54.9
the company’s United States and International operations percent of net sales for 1998, down slightly from last year’s record
reported double-digit sales growth and contributed to the consoli- gross profit margin of 56.0 percent. The decrease in gross profit
dated sales improvement. Business acquisitions in 1998 and the margin reflected a comparison against an exceptionally strong
annualized effect of businesses acquired in 1997 were significant period last year, the effects of business acquisitions and lower
to the company’s growth accounting for approximately one-half of margins in the Asia Pacific region which was affected by economic
the overall sales growth for 1998. Changes in currency translation and monetary problems. These negative effects on the gross profit
had a negative effect on sales growth and decreased the consoli- margin were partially offset by the effects of sales of new products
dated growth rate by three percentage points. The growth in and good sales volume growth. Selling price increases continued
sales also reflected the benefits of new products, new customers, to be constrained due to competitive pricing conditions in several
competitive gains, investments in the growth and training of the of the markets in which the company does business.
sales-and-service force and a continuation of generally good Income from continuing operations for 1998 rose 15 percent
conditions in the hospitality and lodging industries, particularly in to $155 million, or $1.15 per diluted share from $134 million, or
the United States. $1.00 per diluted share in 1997. This improvement reflected
double-digit growth in operating income and an increase in the
company’s equity in earnings of the Henkel-Ecolab joint venture.
Earnings were negatively affected by increased net interest and
income tax expenses compared with last year. Income from
continuing operations was 8.2 percent of net sales in both 1998
and 1997.
Ecolab 1998 Annual Report 25
3. Financial Discussion
In addition to ongoing operations, a tax issue related to the dis- Net income for 1997 reached $134 million, or $1.00 per share
posal of a business in 1992 was resolved during 1998, resulting in on a diluted basis, and increased 18 percent over last year’s net
a one-time gain from discontinued operations of $38 million, or income of $113 million, or $0.85 per share. Net income improved
$0.28 per diluted share. As a result of tax losses on the disposition to 8.2 percent of net sales, compared to 7.6 percent in 1996. The
of this business, the company’s U.S. federal income tax payments increase in net income reflected the benefits of strong operating
were reduced in 1992 through 1995 by approximately $58 million. income performance, lower net interest expense and modestly
However, pending final acceptance of the company’s treatment of higher equity in earnings of the Henkel-Ecolab joint venture, which
the losses, no income tax benefit was recognized for financial were partially offset by increased income taxes.
reporting purposes. During 1998, an agreement was reached with
the Internal Revenue Service on the final tax treatment for the loss- Operating Segment Performance
es. This agreement resulted in the payment of approximately $39 (thousands) 1998 1997 1996
million of income taxes and interest, and the recognition of the gain
Net sales
from discontinued operations. United States
Net income for 1998 totaled $193 million, or $1.44 per Cleaning & Sanitizing $1,296,797 $1,156,625 $1,040,823
diluted share, compared with $134 million, or $1.00 per diluted Other Services 160,063 119,203 107,955
Total 1,456,860 1,275,828 1,148,778
share in 1997.
International Cleaning
1997 compared with 1996 & Sanitizing 440,668 335,337 305,938
Consolidated net sales for 1997 were over $1.6 billion, an increase Total 1,897,528 1,611,165 1,454,716
Effect of foreign
of 10 percent compared to net sales of nearly $1.5 billion in 1996.
currency translation (9,302) 29,187 35,293
Both the company’s U.S. and International operations contributed
Consolidated $1,888,226 $1,640,352 $1,490,009
to this sales growth. Business acquisitions accounted for approxi-
Operating income
mately one-fourth of the growth in sales for 1997. New product
United States
introductions, a larger sales-and-service force, new customers and
Cleaning & Sanitizing $ 218,500 $ 180,975 $ 152,979
competitive gains also added to the 1997 sales improvement. Other Services 19,084 14,655 11,907
Consolidated operating income increased 18 percent for 1997 Total 237,584 195,630 164,886
and reached $219 million compared to consolidated operating International Cleaning
& Sanitizing 29,787 22,519 19,151
income of $185 million in 1996. This growth included the benefits
Total 267,371 218,149 184,037
of business acquisitions, which accounted for approximately 20
Corporate (4,347) (4,088) (3,440)
percent of the increase. The consolidated operating income
Effect of foreign
margin was 13.3 percent in 1997, a substantial improvement over currency translation (1,044) 4,443 4,720
the 1996 consolidated operating income margin of 12.4 percent. Consolidated $ 261,980 $ 218,504 $ 185,317
Most of the company’s businesses contributed to these income Operating income as a percent of sales
improvements; however, strong performances by the core U.S. United States
Institutional and Food & Beverage businesses during 1997 were the Cleaning & Sanitizing 16.8% 15.6% 14.7%
Other Services 11.9 12.3 11.0
major contributors to the company’s overall profit improvement.
Total 16.3 15.3 14.4
An improved and record level gross profit margin, reflecting good
International Cleaning
sales volume growth and a more stable raw material cost environ-
& Sanitizing 6.8% 6.7% 6.3%
ment, more than offset a modestly higher selling, general and
administrative expense margin and limited selling price increases.
Ecolab 1998 Annual Report
26
4. During 1998, the company adopted Statement of Financial for approximately 30 percent of the growth in sales of the United
Accounting Standards No. 131. As a result, the company defined States Cleaning and Sanitizing operations. Sales in 1998 also
its reportable segments and changed the information it reports benefited from new product introductions, new customers,
about its operating segments. Operating segment information for competitive gains, a larger and better trained sales-and-service
prior years has been restated to conform to the 1998 presentation. force and favorable trends in the hospitality and lodging
industries. Selling price increases continued to be constrained
United States Sales due to competitive pricing conditions in several of the markets in
Cleaning & Sanitizing (Dollars in Millions)
which the company does business. Sales of the company’s
$1,041 $1,157 $1,297
Institutional operations increased 11 percent for 1998. Institutional
Institutional 60%
reported strong double-digit growth in its Ecotemp, laundry,
Food & Beverage 18%
specialty and housekeeping programs and solid growth in sales
Professional Products 8%
to warewashing markets. Institutional benefited from new
Kay 7%
customers, competitive gains, high customer retention and the
Textile Care 5%
addition of the Grace-Lee vehicle wash business, which added
Water Care 2%
approximately 2 percentage points to the Institutional sales
1998 1996 1997 1998
growth rate. Kay’s U.S. operations reported sales growth of 10
The company’s operating segments have generally similar percent for 1998 reflecting new business, continued growth in its
products and services and, generally, the company is organized food retail services business and retention of key customers.
to manage its operations geographically. Pursuant to the new Textile Care sales increased 1 percent for 1998. Textile Care has a
standard, the company’s operating segments have been aggregat- number of new product offerings, but continues to experience
ed into three reportable segments: United States Cleaning pressures from consolidations in the commercial laundry market
and Sanitizing operations, United States Other Services, and and a difficult pricing environment. The company expects the U.S.
International Cleaning and Sanitizing operations. The company Textile Care business to continue to experience challenging
evaluates the performance of its International operations based market conditions over the near term. Professional Products sales
on fixed management rates of currency exchange. Therefore, were up 6 percent, with double-digit growth in its specialty and
International sales and operating income totals shown above, brand name program and infection prevention products, and
as well as the International financial information included in this modest growth in its core janitorial business. Sales of the
financial discussion, are based on translation into U.S. dollars at company’s Water Care operations increased 6 percent for 1998,
the fixed currency exchange rates used by management for 1998. reflecting double-digit growth in its pool and spa and cruise ship
All other accounting policies of the reportable segments are businesses, partially offset by lower distributor sales to municipal
consistent with generally accepted accounting principles and the markets. Food & Beverage reported sales growth of 15 percent
accounting policies of the company described in Note 2 of the for 1998. Food & Beverage sales growth included the benefits
notes to consolidated financial statements. Additional information of businesses acquired in 1998 and the annualized effect of last
about the company’s reportable segments is included in Note 15 year’s acquisition of Chemidyne. Excluding the effect of these
of the notes to consolidated financial statements. business acquisitions, Food & Beverage sales increased 8 percent
Sales of the company’s United States Cleaning and Sanitizing and included strong growth in sales to the beverage and food pro-
operations were nearly $1.3 billion for 1998 and increased 12 per- cessing markets and good growth in sales to the dairy markets,
cent over sales approaching $1.2 billion in 1997. This sales despite challenging consolidation and pricing conditions.
increase reflected benefits from business acquisitions, a continua- For 1998, sales of the company’s United States Other
tion of particularly strong performances by the company’s core Services operations increased 34 percent to $160 million,
Institutional and Food & Beverage operations and double-digit compared with $119 million last year. Sales for 1998 included the
growth in sales reported by Kay. Business acquisitions accounted mid-year acquisition of GCS Service Inc. (GCS), a nationwide
provider of commercial kitchen equipment repair services. Other
Ecolab 1998 Annual Report 27
5. Financial Discussion
Services sales grew 14 percent excluding the GCS business ac- markets. Sales for the company’s operations in Africa decreased
quisition. Pest Elimination reported sales growth of 14 percent for 6 percent for 1998 as the company focused on integrating the
1998 with strong sales across all of its business lines, including its various businesses acquired over the last couple of years.
core contract services business, its flying insect defense program Operating income of the company’s United States Cleaning
and ancillary services. Pest Elimination had very good new and Sanitizing operations was $219 million in 1998, an increase
contract growth during 1998, continued its high customer of 21 percent over operating income of $181 million in 1997.
retention and benefited from weather conditions that contributed Business acquisitions accounted for approximately 10 percent
to greater pest elimination needs during 1998. Sales of the of the growth in operating income for 1998. Operating income
Jackson equipment business increased 18 percent for 1998, growth in the core Institutional and Food & Beverage businesses
reflecting good sales to the quickservice or fast-food market. remained very strong and operating income in the Kay and
Professional Products businesses was also up at double-digit
rates. Textile Care and Water Care reported a decrease in operat-
United States Sales
Other Services (Dollars in Millions)
ing income for 1998. The operating income margin for the U.S.
$108 $119 $160
Cleaning and Sanitizing operations improved to 16.8 percent of
Pest Elimination 77%
net sales, compared with 15.6 percent in 1997. The increased
GCS Service 15%
operating income margin reflected strong sales growth, including
Jackson 8%
a continuation of strong performance in the core operations and
in sales of new products, modest increases in raw material costs
and the benefits of tight cost controls. The company continued
to invest in its sales-and-service force during 1998 and added
1998 1996 1997 1998
255 associates to its U.S. Cleaning and Sanitizing operations.
Management rate sales of the company’s International United States Other Services reported an increase of 30 percent
Cleaning and Sanitizing operations were $441 million for 1998, up in operating income, to $19 million in 1998 from $15 million in the
31 percent over sales of $335 million in 1997. Sales in 1998 prior year. Excluding the GCS acquisition, operating income was
benefited from the acquisition of Gibson at the end of 1997 and up 27 percent. The operating income margin was down slightly, to
from the addition of a business in Japan during 1998. These busi- 11.9 percent of net sales in 1998 from 12.3 percent last year, due
ness acquisitions accounted for approximately two-thirds of in part to the addition of GCS. The increase in operating income
International’s sales growth for 1998. The Asia Pacific region, for 1998 was driven by sales growth, productivity improvements
International’s largest area of operation, reported sales growth of and tight cost controls. 365 sales-and-service associates were
56 percent. Excluding business acquisitions, Asia Pacific sales added to the U.S. Other Services operations in 1998, including
increased approximately 10 percent and reflected double-digit GCS associates.
growth in Japan and Southeast Asia, modest growth in Australia International Cleaning and Sanitizing operations reported oper-
and a decrease in sales in New Zealand. Sales to the Asia Pacific ating income of $30 million for 1998, an increase of 32 percent
food and beverage markets were up significantly and the region over 1997 operating income of $23 million. Business acquisitions
recorded modest growth in sales to institutional markets. Latin accounted for approximately 90 percent of the growth in operating
America sales for 1998 increased 8 percent over the prior year. income for 1998. Operating income margins for the International
The region continued to be led by significant double-digit growth Cleaning and Sanitizing operations were 6.8 percent of net sales
in Mexico. Sales were also up at double-digit rates in Venezuela in 1998 compared with 6.7 percent in the prior year. Operating
and in Central America, while sales growth in Brazil was modest. income reflected significant double-digit growth in Latin America,
Latin America recorded good growth in sales to both the good growth in Canada and a decrease in operating income in
institutional and food and beverage markets. Sales in Canada Africa and in the Asia Pacific region when the Gibson acquisition
increased 9 percent for 1998 and included high single-digit is excluded. The company continues to be cautious about near-
growth in sales to both the institutional and food and beverage term growth in Asia Pacific due to the lingering uncertain econom-
ic conditions in the region. The recent currency devaluation in
Brazil is also expected to slow growth in Latin America during
1999. The company added 300 sales-and-service associates to
its International Cleaning and Sanitizing operations during 1998,
including associates of businesses acquired.
Ecolab 1998 Annual Report
28
6. line. Water Care sales were down 2 percent for 1997 and reflected
International Sales
Cleaning & Sanitizing (Dollars in Millions)
the elimination of low margin business, consolidation of business
$306 $335 $441
acquisitions made over the past three years, integration of
Asia Pacific 48%
disparate product lines, and the refining of sales efforts. Food &
Latin America 20%
Beverage reported a sales increase of 24 percent for 1997. Food
Canada 19%
& Beverage sales growth included the benefits of Chemidyne, a
Africa, Export & Other 13%
provider of cleaning and sanitizing products and equipment to the
meat, poultry and processed food markets, which was acquired
in August of 1997, and the annualized effect of the acquisition of
1998 1996 1997 1998
Monarch in August of 1996. Excluding these business acqui-
Operating income margins of the company’s International
sitions, Food & Beverage sales growth was 9 percent for 1997
operations are substantially less than the operating income margins
and included growth in sales to all of its markets with double-digit
realized for the company’s U.S. operations. The lower International
growth in sales to the food processing and beverage markets.
margins are due to the difference in scale of International operations,
Sales of the United States Other Services operations were
where operating locations are smaller in size, and to the additional
$119 million for 1997, up 10 percent over sales of $108 million in
costs of operating in numerous and diverse foreign jurisdictions.
1996. Pest Elimination reported 10 percent sales growth for 1997,
Proportionately larger investments in sales, technical support and
despite increased competitive activity. Pest Elimination continued
administrative personnel are also necessary in order to facilitate
to develop new programs to leverage its alliances with Ecolab’s
growth of International operations.
other operations. Sales of the Jackson business increased 18 per-
cent for 1997.
1997 compared with 1996
International Cleaning and Sanitizing sales were $335 million
Sales of the company’s United States Cleaning and Sanitizing
for 1997 and increased 10 percent over sales of $306 million in
operations approached $1.2 billion in 1997 and increased 11 per-
1996. Sales growth included the benefits of business acquisitions
cent over sales of $1.0 billion in 1996. Sales reflected strong
and significant new product introductions. Businesses acquired in
growth in the core Institutional and Food & Beverage operations
Canada and Africa in 1997 and the annualization of 1996 Canadian
and included benefits from business acquisitions and significant
business acquisitions accounted for approximately 50 percent of
new product introductions. Business acquisitions accounted for
International’s sales growth for 1997. Asia Pacific had sales growth
approximately 25 percent of the sales growth for 1997. Sales of
of 9 percent for 1997 with double-digit growth in Japan, modest
the U.S. Institutional division increased 10 percent for 1997.
growth in New Zealand and flat results in Australia. Latin America
Institutional’s growth reflected strong sales in all of its business
reported sales growth of 9 percent for 1997. Growth in the Latin
units, significant new customer business and competitive gains,
America region was led by significant double-digit growth in Mexico
continued strong growth in its Ecotemp program and the success-
and included good growth in Brazil. Canada had sales growth of
ful rollout of its new Keystone product line sold through partnership
16 percent for 1997, with approximately 70 percent of its growth
with a distributor. Sales of Kay’s U.S. operations increased 6 percent
due to business acquisitions. International sales results also bene-
for 1997. Kay was unfavorably affected by a more competitive
fited from businesses acquired in Central Africa during 1997.
quickservice market; however, Kay added another major quickser-
Sales in South Africa decreased during 1997, principally due to
vice chain customer in 1997 and had good growth in sales to the
the elimination of low margin business.
food retail market, which it entered in 1996. Sales of Textile Care
Operating income of the United States Cleaning and Sanitizing
decreased 3 percent for 1997. Continued plant consolidations,
operations reached $181 million in 1997, an increase of 18 percent
particularly in laundries serving the healthcare market, increased
over operating income of $153 million in 1996. Business acqui-
competitive activity and comparison against periods that benefited
sitions accounted for approximately 20 percent of operating
significantly from new product introductions unfavorably affected
income growth for 1997. With the exception of Textile Care,
Textile Care’s sales growth. Professional Products reported sales
all of the company’s U.S. Cleaning and Sanitizing operations
growth of 12 percent for 1997. This sales improvement reflected
the annualized effect of the 1996 acquisition of Huntington
Laboratories, good growth in sales to corporate accounts, and
the addition of new products to its commercial mass distribution
Ecolab 1998 Annual Report 29
7. Financial Discussion
reported increased operating income, with particularly strong Henkel-Ecolab sales, although not consolidated in Ecolab’s
growth in the core Institutional and Food & Beverage operations. financial statements, increased 10 percent when measured in
The U.S. Cleaning and Sanitizing operating income margin Deutsche marks. Excluding businesses acquired in the United
improved to 15.6 percent of net sales from 14.7 percent in 1996. Kingdom and Germany, sales increased 5 percent for 1998 with
The improved operating income margin reflected the benefits of good growth across most divisions and regions. Sales in Germany
strong core business sales, sales of new products, stable raw continued to be weak due in part to government and private spend-
material costs, sales productivity improvements and tight cost ing cutbacks. When measured in U.S. dollars, Henkel-Ecolab sales
controls, which were partially offset by investments in the sales- were up 7 percent for 1998.
and-service force.
1997 compared with 1996
United States Other Services operating income was $15 million
The company’s equity in earnings of Henkel-Ecolab was $13
for 1997, up 23 percent over operating income of $12 million in
million for 1997, a 3 percent increase over 1996. Results were
1996. The operating income margin improved from 11.0 percent
negatively affected by the stronger U.S. dollar. When measured in
of net sales in 1996 to 12.3 percent of net sales in 1997. The
Deutsche marks, Henkel-Ecolab’s net income increased 11
improvement in operating income reflected strong sales,
percent and reflected increased sales, improved gross margins
productivity improvements and tight cost controls.
and lower interest expense. Henkel-Ecolab sales increased 7 per-
Operating income of the company’s International Cleaning
cent when measured in Deutsche marks. When measured in U.S.
and Sanitizing operations totaled $23 million in 1997, an increase
dollars, sales were negatively affected by the strengthening U.S.
of 18 percent over operating income of $19 million in 1996.
dollar and decreased 7 percent.
Operating income margins improved to 6.7 percent of net sales
in 1997 compared with 6.3 percent in 1996. Double-digit operat-
Corporate
ing income growth in Asia Pacific and Canada more than offset
Corporate operating expense was $4 million in 1998 and 1997
a decrease in operating income in the Latin America region which
and $3 million in 1996. Corporate operating expense includes
was principally due to investments in Brazil and Argentina.
overhead costs directly related to the joint venture.
Henkel-Ecolab Joint Venture
Interest and Income Taxes
The company operates cleaning and sanitizing businesses in
Net interest expense for 1998 was $22 million, an increase of
Europe through a 50 percent economic interest in the Henkel-
72 percent over net interest expense of $13 million in 1997.
Ecolab joint venture. The company includes the operations of
This increase was due to debt incurred at the end of 1997 for
Henkel-Ecolab in its financial statements using the equity method
the Gibson business acquisition and for additional borrowings
of accounting. The company’s equity in earnings of Henkel-
related to other business acquisitions, income tax payments to
Ecolab, including royalty income and after deduction of intangible
settle an outstanding tax issue and share repurchases during 1998.
amortization, was $16 million in 1998, a 19 percent increase
Net interest expense decreased 12 percent to less than
over 1997. When measured in Deutsche marks, net income of
$13 million in 1997, compared to net interest expense of over
Henkel-Ecolab increased 18 percent for 1998. This improvement
$14 million in 1996. This decrease was principally due to a
reflected increased sales, the benefits of cost controls and a lower
scheduled debt repayment on the company’s 9.68 percent
overall effective income tax rate.
senior notes and to increased interest income earned on higher
Ecolab’s Equity average levels of cash and cash equivalents held during 1997.
Henkel-Ecolab in Earnings
The company’s effective income tax rate was 42.4 percent for
Business Mix (Dollars in Millions)
1998, and increased from an effective income tax rate of 41.5
$13 $13 $16
Institutional 36% percent in 1997. This increase was principally due to a higher
Professional Hygiene 26%
overall effective rate on earnings of International operations and
Food & Beverage P3 25%
to the effects of business acquisitions. International’s effective
Textile Hygiene
(Textile Care) 13%
1998 1996 1997 1998
Ecolab 1998 Annual Report
30
8. income tax rate varies from year to year with the pre-tax income The company has completed the assessment stage of
mix of the various countries in which the company operates. analyzing its manufacturing and building maintenance operations
The company’s effective income tax rate was 41.5 percent for for date/time sensitivity relative to Year 2000. While some issues
1997, a modest increase from the 1996 effective income tax rate have been identified, the company believes that it can modify its
of 41.4 percent. This increase was due to a slightly higher overall processes or retrofit equipment to become Year 2000 compliant
effective rate on earnings of International operations. and is in the process of doing so with the intention of completing
the process by July 1999.
The company does not have final estimates for the costs of full
Year 2000 Conversion
Year 2000 remediation other than for St. Paul-based operating
The company has completed an assessment of Year 2000 compli-
and application systems but it believes the costs, when aggregat-
ance for its critical operating and application systems located at
ed with costs for the St. Paul-based systems, will not be material
its St. Paul-based headquarters. These include customer-oriented
to the company’s results of operations, financial position, or liquid-
systems such as sales and order processing, billing and collections
ity. The costs will be funded by operating cash flows.
and associated infrastructure. As a result, the company has reme-
The company intends to complete its Year 2000 remediation
diated or is replacing portions of its software and hardware. The
efforts primarily with in-house resources, but has and will continue
company has tested these systems by simulating the occurrence
to use consultants for specific tasks.
of the Year 2000 in an orchestrated manner. Approximately 95 per-
Failures caused by the Year 2000 of key suppliers and vendors
cent of the systems proved compliant and the goal is to complete
could cause supply interruptions. Therefore, the company has con-
the remaining renovation and testing by July 1999. The costs related
tacted key suppliers and vendors in order to determine the status
to complete this activity are not expected to exceed $7.0 million,
of their Year 2000 remediation plans. In the company’s experience,
in both capital and expense, of which approximately $5.5 million
its key suppliers and vendors are aware of the Year 2000 issue
has been incurred to date. The company does not consider these
and represent that they have plans for being compliant on a timely
costs to be material to results of operations, financial position,
basis. The company intends to continue to monitor progress and
or liquidity.
may take further actions to verify the accuracy of vendor and sup-
Each business unit not on the St. Paul system is responsible for
plier representations.
developing and implementing a Year 2000 compliance plan for its
The company is dependent upon its customers for sales and
critical operating and application systems (including assessment,
cash flow and customers’ Year 2000 failures could result in
remediation, validation and implementation) subject to the oversight
reduced sales, increased inventory or receivable levels and cash
and coordination of a special corporate-wide Year 2000 manage-
flow reductions. While these events are possible, the company’s
ment team. The goal was for these business units to complete all
customer base is wide and diverse and the company does not,
compliance activities by December 31, 1998. The business units
at this point, believe that customers’ Year 2000 failures will have
have reported approximately 90 percent achievement of Year
a material effect on the company. The company will continue to
2000 compliance. Where compliance has not been achieved,
monitor this issue and will consider further actions as may be
appropriate remedial plans have been adopted. The Year 2000
warranted in the circumstances.
management team is currently auditing the plans as presented by
The company recognizes the need for Year 2000 contingency
the business units to ensure corporate-wide consistency in these
plans and will be developing such plans during 1999.
efforts and, to the extent determined necessary, will participate in
The Henkel-Ecolab joint venture is conducting its own Year
tests based on the simulation of Year 2000. The goal is to achieve
2000 compliance program.
full compliance by July 1999.
The company recognizes that issues related to Year 2000
The company has completed an assessment of its dispensing
constitute a material known uncertainty. The company also
and cleaning systems which are at customer locations, for date/
recognizes the importance of ensuring its operations will not
time sensitivity. The installed base of such cleaning and dispensing
be adversely affected by Year 2000 issues. It believes that the
systems which has not been determined to be Year 2000 compli-
processes described above will be effective to manage the risks
ant is estimated at less than 0.5 percent of all systems in place at
customer sites. The company believes that Year 2000 compliant
alternatives have been designed and identified and that the
systems can be retrofitted by July 1999.
Ecolab 1998 Annual Report 31
9. Financial Discussion
associated with Year 2000 compliance. However, there can be Financial Position, Cash Flows and Liquidity
no assurance that the process can be completed on the timetable
described above, that it will be 100 percent effective in identifying Financial Position
all Year 2000 issues, or that the remediation processes for its own The company has maintained its long-term financial objective of
operations will be completely effective. The issues related to vendors an investment grade balance sheet since 1993. The company’s
or suppliers are more difficult because their Year 2000 compliance debt was rated within the “A” categories by the major rating agen-
programs are not within the company’s direct control. These cies throughout 1998. Significant changes to the company’s
uncertainties relating to Year 2000, however, are ones which the balance sheet during 1998 included the following:
company believes it shares with companies in similar businesses. • The company has added assets and liabilities to its balance
Additional information is found under the company’s statement sheet during the last two years through business acquisitions.
entitled “Forward-Looking Statements and Risk Factors” which is Other noncurrent assets reflect significant additions for the GCS
contained under Part I of the company’s Annual Report on Form business and a cleaning and sanitizing business acquired in
10-K for the year ended December 31, 1998. Japan during 1998, and the acquisitions of Gibson and
The failure to identify and remediate Year 2000 problems or, Chemidyne in 1997. Significant levels of accounts receivable,
the failure of key third parties who do business with the company inventories, property, plant and equipment and other current liabil-
or governmental/regulatory agencies to timely remediate their ities were also added during 1998 and 1997 as a result of these
Year 2000 issues could cause system failures or errors, business business acquisitions. During 1998, net assets (principally
interruptions and in a worst case scenario, the inability to engage in accounts receivable, inventories and property, plant and
normal business practices for an unknown length of time. Litigation equipment) related to certain Gibson businesses and duplicate
could also ensue. The effect on the company’s results of operations, facilities were reclassified to other current assets and the majority
financial position, or liquidity could be materially adverse. of these net assets were sold.
Euro Currency Conversion Total Debt to
Capitalization
The company’s principal activities in Europe are not conducted
(Percent)
25% 36% 30%
directly. Rather, such activities are conducted through its Henkel-
Shareholders’ Equity 70%
Ecolab joint venture.
Total Debt 30%
On January 1, 1999, 11 of the 15 member countries of the
European Monetary Union established fixed conversion rates
between their existing currencies and a new currency, the Euro.
During a transition period from January 1, 1999 through January 1,
70 30
2002, the Euro will replace the national currencies that exist in the 1998 1996 1997 1998
participating countries.
The transition to the Euro creates a number of sales, marketing, • Total debt was $295 million at December 31, 1998, compared
finance and accounting issues. These issues are being addressed with total debt of $308 million at year-end 1997 and $176 million
by the management of the Henkel-Ecolab joint venture. at year-end 1996. The increase in total debt during 1997 included
While the company will continue to evaluate the impact of the $116 million of borrowings incurred under the company’s
Euro introduction over time, based on currently available Multicurrency Credit Agreement to finance the purchase of the out-
information and the nature of the company’s exposures, the com- standing common shares of Gibson, and $22 million of debt which
pany does not, at this time, believe that the transition to the Euro was included on Gibson’s balance sheet at the time of acquisition.
will have a material adverse impact on the company’s results During 1998, the company replaced long-term debt under its
of operations, financial position, or liquidity. Multicurrency Credit Agreement with approximately $60 million of
Australian-dollar-denominated debt under a medium-term note
agreement and approximately $30 million of Australian-dollar-
denominated commercial paper. At December 31, 1998, the com-
pany had $44 million of U.S.-dollar-denominated debt outstanding
Ecolab 1998 Annual Report
32
10. under its Multicurrency Credit Agreement related primarily to income taxes paid related to a business which was discontinued
business acquisitions, funding for income tax payments to settle in 1992.
an outstanding tax issue and share repurchases. As of December Cash flows used for investing activities included capital expen-
31, 1998, the ratio of total debt to capitalization was 30 percent ditures of $148 million in 1998, $122 million in 1997 and $112
compared to 36 percent at year-end 1997 and 25 percent at year- million in 1996. Worldwide additions of merchandising equipment,
end 1996. The improvement in the total debt to capitalization ratio primarily cleaning and sanitizing product dispensers, accounted
for 1998 was principally due to increased shareholders’ equity, for approximately 70 percent of each year’s capital expenditures.
which resulted from strong earnings performance and the 1998 The company has also expanded its manufacturing facilities over
gain from discontinued operations. the last few years through construction and business acquisitions
in order to meet sales requirements more efficiently. The majority
• Working capital levels have remained fairly constant over the
of cash flows used in 1998 for businesses acquired were related
last three year ends. Working capital was $104 million at year-end
to the year-end 1997 Gibson acquisition and a cleaning and sani-
1998, compared with working capital levels of $105 million and
tizing business acquired in Japan in early 1998. Cash flows used
$108 million at year-end 1997 and 1996, respectively.
for businesses acquired included Gibson in 1997 and Huntington
• Other noncurrent liabilities decreased to $68 million at
and Monarch in 1996. Investing activities cash flows for 1998 also
December 31, 1998 from $125 million at year-end 1997 and
included the proceeds from the sale of certain Gibson businesses
$138 million at year-end 1996. During 1998, the company
and duplicate facilities which the company chose not to retain.
resolved a tax issue related to the disposal of a business in 1992.
Cash used for financing activities included cash flows used for
As a result, the company reduced its noncurrent liabilities through
reacquired shares, cash dividends and net cash used of $9 million
the payment of income taxes of approximately $39 million and the
to reduce short-term and long-term debt during 1998.
recognition of a gain from discontinued operations of $38 million.
In 1998, the company increased its annual dividend rate for
the seventh consecutive year. The company has paid dividends
Cash Flows
on its common stock for 62 consecutive years. Cash dividends
For 1998, cash flows from continuing operating activities reached
declared per share of common stock, by quarter, for each of the
a record $275 million, compared to $235 million in 1997 and
last three years were as follows:
$254 million in 1996. Operating cash flows for 1998 included
First Second Third Fourth
strong earnings performance and the additional cash flows from
Quarter Quarter Quarter Quarter Year
businesses acquired. Operating cash flows for 1997 were
unfavorably affected by a cash outflow due to an $18 million 1998 $0.095 $0.095 $0.095 $0.105 $0.39
income tax deposit against outstanding federal income tax issues
1997 0.08 0.08 0.08 0.095 0.335
that had been accrued for in other noncurrent liabilities, and the
1996 0.07 0.07 0.07 0.08 0.29
reversal of favorable timing of payments which affected the fourth
quarter of 1996. Operating cash flows for 1997 also included
Liquidity
higher dividends from the Henkel-Ecolab joint venture.
The company maintains a committed line of credit under the
Cash used for discontinued operating activities in 1998 reflects
Multicurrency Credit Agreement for general corporate financing
needs. The agreement includes a competitive bid feature to
Cash from Continuing Operating Activities
(Dollars in Millions) minimize the cost of the company’s borrowings. The company
$154 $163 $254 $235 $275 also has a $200 million shelf registration as an additional source
of liquidity. The company believes its existing cash balances, cash
generated by operating activities, including cash flows from the
Henkel-Ecolab joint venture, available credit, and additional credit
available based on a strong financial position, are more than
adequate to fund all of its 1999 requirements for growth, possible
acquisitions, new program investments, scheduled debt
1994 1995 1996 1997 1998
repayments and dividend payments.
Ecolab 1998 Annual Report 33
11. Consolidated Statement of Income
Year ended December 31 (thousands, except per share) 1998 1997 1996
Net Sales $1,888,226 $1,640,352 $1,490,009
Cost of Sales 851,173 722,084 674,953
Selling, General and Administrative Expenses 775,073 699,764 629,739
Operating Income 261,980 218,504 185,317
Interest Expense, Net 21,742 12,637 14,372
Income From Continuing Operations Before Income Taxes and
Equity in Earnings of Henkel-Ecolab 240,238 205,867 170,945
Provision for Income Taxes 101,782 85,345 70,771
Equity in Earnings of Henkel-Ecolab Joint Venture 16,050 13,433 13,011
Income From Continuing Operations 154,506 133,955 113,185
Gain From Discontinued Operations 38,000
Net Income $ 192,506 $ 133,955 $ 113,185
Basic Income Per Common Share
Income From Continuing Operations $ 1.20 $ 1.03 $ 0.88
Gain From Discontinued Operations 0.29
Net Income $ 1.49 $ 1.03 $ 0.88
Diluted Income Per Common Share
Income From Continuing Operations $ 1.15 $ 1.00 $ 0.85
Gain From Discontinued Operations 0.28
Net Income $ 1.44 $ 1.00 $ 0.85
Weighted-Average Common Shares Outstanding
Basic 129,157 129,446 128,991
Diluted 134,047 133,822 132,817
See notes to consolidated financial statements.
Ecolab 1998 Annual Report
34
12. Consolidated Balance Sheet
December 31 (thousands, except per share) 1998 1997 1996
Assets
Cash and cash equivalents $ 28,425 $ 61,169 $ 69,275
Accounts receivable, net 246,695 246,041 205,026
Inventories 165,627 154,831 122,248
Deferred income taxes 36,256 34,978 29,344
Other current assets 26,511 12,482 9,614
Current Assets 503,514 509,501 435,507
Property, Plant and Equipment, Net 420,205 395,562 332,314
Investment in Henkel-Ecolab Joint Venture 253,646 239,879 285,237
Other Assets 293,630 271,357 155,351
Total Assets $1,470,995 $1,416,299 $1,208,409
Liabilities and Shareholders’ Equity
Short-term debt $ 67,991 $ 48,884 $ 27,609
Accounts payable 124,646 130,682 103,803
Compensation and benefits 79,431 74,317 71,533
Income taxes 244 13,506 26,977
Other current liabilities 127,479 137,075 97,849
Current Liabilities 399,791 404,464 327,771
Long-Term Debt 227,041 259,384 148,683
Postretirement Health Care and Pension Benefits 85,793 76,109 73,577
Other Liabilities 67,829 124,641 138,415
Shareholders’ Equity (common stock, par value $1.00 per share;
shares outstanding: 1998 – 129,479; 1997 – 129,127; 1996 – 129,600) 690,541 551,701 519,963
Total Liabilities and Shareholders’ Equity $1,470,995 $1,416,299 $1,208,409
See notes to consolidated financial statements.
Ecolab 1998 Annual Report 35
13. Consolidated Statement of Cash Flows
Year ended December 31 (thousands) 1998 1997 1996
Operating Activities
Net income $ 192,506 $ 133,955 $ 113,185
Less: gain from discontinued operations 38,000
Income from continuing operations 154,506 133,955 113,185
Adjustments to reconcile income from continuing operations to cash
provided by continuing operations:
Depreciation 99,276 84,415 75,185
Amortization 22,695 16,464 14,338
Deferred income taxes (2,012) (2,074) (6,878)
Equity in earnings of joint venture (16,050) (13,433) (13,011)
Joint venture royalties and dividends 10,451 25,367 15,769
Other, net 1,526 4,630 1,023
Changes in operating assets and liabilities:
Accounts receivable 1,352 (21,231) 2,809
Inventories (11,667) (14,395) (6,852)
Other assets (7,631) (10,993) (5,255)
Accounts payable (7,794) 20,876 16,397
Other liabilities 29,877 11,517 47,559
Cash provided by continuing operations 274,529 235,098 254,269
Cash used for discontinued operations (38,887)
Cash provided by operating activities 235,642 235,098 254,269
Investing Activities
Capital expenditures (147,631) (121,667) (111,518)
Property disposals 7,060 3,424 3,284
Businesses acquired (40,206) (157,234) (54,911)
Sale of Gibson businesses and assets 14,226
Other, net 4,766 (1,240) (1,449)
Cash used for investing activities (161,785) (276,717) (164,594)
Financing Activities
Notes payable 24,820 9,280 (42,045)
Long-term debt borrowings 117,740 117,000 75,000
Long-term debt repayments (151,143) (15,210) (35,690)
Reacquired shares (52,984) (60,795) (22,790)
Cash dividends on common stock (49,000) (41,456) (36,096)
Other, net 5,679 26,278 17,088
Cash provided by (used for) financing activities (104,888) 35,097 (44,533)
Effect of exchange rate changes on cash (1,713) (1,584) (585)
Increase (Decrease) in Cash and Cash Equivalents (32,744) (8,106) 44,557
Cash and cash equivalents, beginning of year 61,169 69,275 24,718
Cash and cash equivalents, end of year $ 28,425 $ 61,169 $ 69,275
Bracketed amounts indicate a use of cash.
See notes to consolidated financial statements.
Ecolab 1998 Annual Report
36
14. Consolidated Statement of Comprehensive Income and Shareholders’ Equity
Accumulated
Other
Additional Comprehensive
Common Paid-in Retained Deferred Income: Treasury
(thousands) Stock Capital Earnings Compensation Translation Stock Total
Balance December 31, 1995 $ 70,078 $171,765 $325,674 $ (6,484) $ 16,272 $(120,647) $456,658
Net income 113,185 113,185
Foreign currency translation (9,485) (9,485)
Comprehensive income 103,700
Cash dividends on common stock (37,409) (37,409)
Stock options 673 14,824 15,497
Stock awards 522 2,912 (3,638) 1,779 1,575
Reacquired shares (22,790) (22,790)
Amortization 2,732 2,732
Balance December 31, 1996 70,751 187,111 404,362 (7,390) 6,787 (141,658) 519,963
Net income 133,955 133,955
Foreign currency translation (35,730) (35,730)
Comprehensive income 98,225
Cash dividends on common stock (43,367) (43,367)
Stock options 648 15,877 16,525
Stock awards 5,093 (5,200) 1,427 1,320
Business acquisitions 12,454 3,946 16,400
Reacquired shares (60,795) (60,795)
Amortization 3,430 3,430
Stock dividend 71,398 (71,398)
Balance December 31, 1997 142,797 149,137 494,950 (9,160) (28,943) (197,080) 551,701
Net income 192,506 192,506
Foreign currency translation (937) (937)
Comprehensive income 191,569
Cash dividends on common stock (50,309) (50,309)
Stock options 1,059 16,047 17,106
Stock awards 6,833 (6,163) 1,198 1,868
Business acquisitions 850 26,195 220 27,265
Reacquired shares (52,984) (52,984)
Amortization 4,325 4,325
Balance December 31, 1998 $144,706 $198,212 $637,147 $(10,998) $ (29,880) $(248,646) $690,541
Common Stock Activity
1998 1997 1996
Common Treasury Common Treasury Common Treasury
Year ended December 31 (shares) Stock Stock Stock Stock Stock Stock
Shares, beginning of year 142,796,652 (13,669,624) 70,750,741 (5,950,518) 70,078,398 (5,376,917)
Stock options 1,058,686 648,085 672,343
Stock awards 206,366 124,440 150,010
Business acquisitions 850,445 33,083 308,343
Reacquired shares (1,796,868) (1,317,077) (723,611)
Stock dividend 71,397,826 (6,834,812)
Shares, end of year 144,705,783 (15,227,043) 142,796,652 (13,669,624) 70,750,741 (5,950,518)
See notes to consolidated financial statements.
Ecolab 1998 Annual Report 37
15. Notes to Consolidated Financial Statements
1
One: Nature of Business Intangible Assets
The company is the leading global developer and marketer of Intangible assets arise principally from business acquisitions and
premium cleaning and sanitizing products and services for the are stated at cost. The assets are amortized on a straight-line
hospitality, institutional and industrial markets. Customers include basis over their estimated economic lives, generally not exceeding
hotels and restaurants; foodservice, healthcare and educational 30 years.
facilities; quickservice (fast-food) units; commercial laundries; light
Long-Lived Assets
industry; dairy plants and farms; and food and beverage
The company periodically assesses the recoverability of long-lived
processors around the world.
and intangible assets based on anticipated future earnings and
2
operating cash flows.
Two: Summary of Significant Accounting Policies
Income Per Common Share
Principles of Consolidation
The computations of the basic and diluted per share amounts for
The consolidated financial statements include the accounts of the
the company’s continuing operations were as follows:
company and all majority-owned subsidiaries. The company
accounts for its investment in the Henkel-Ecolab joint venture (thousands, except per share) 1998 1997 1996
under the equity method of accounting. International subsidiaries
Income from continuing
and the Henkel-Ecolab joint venture are included in the financial operations $ 154,506 $ 133,955 $ 113,185
statements on the basis of their November 30 fiscal year ends.
Weighted-average common
shares outstanding
Foreign Currency Translation
Basic (actual shares
Financial position and results of operations of the company’s
outstanding) 129,157 129,446 128,991
international subsidiaries and the Henkel-Ecolab joint venture
Effect of dilutive
generally are measured using local currencies as the functional stock options 4,890 4,376 3,826
currency. Assets and liabilities of these operations are translated Diluted 134,047 133,822 132,817
at the exchange rates in effect at each fiscal year end. Income
Income from continuing operations
statement accounts are translated at the average rates of per common share
exchange prevailing during the year. Translation adjustments Basic $ 1.20 $ 1.03 $ 0.88
arising from the use of differing exchange rates from period to Diluted $ 1.15 $ 1.00 $ 0.85
period are included in accumulated other comprehensive income
in shareholders’ equity. Stock options granted in 1998 for approximately 2.2 million
shares were not dilutive and, therefore, were not included in the
Cash and Cash Equivalents
computation of diluted income per common share amounts
Cash equivalents include highly liquid investments with a maturity
for 1998.
of three months or less when purchased.
Use of Estimates
Inventory Valuations
The preparation of the company’s financial statements requires
Inventories are valued at the lower of cost or market. Domestic
management to make certain estimates and assumptions that
chemical inventory costs are determined on a last-in, first-out (lifo)
affect the reported amounts of assets and liabilities as of the date
basis. Lifo inventories represented 45 percent, 40 percent and
of the financial statements and the reported amounts of revenues
44 percent of consolidated inventories at year-end 1998, 1997
and expenses during the reporting periods. Actual results could
and 1996, respectively. All other inventory costs are determined
differ from these estimates.
on a first-in, first-out (fifo) basis.
Property, Plant and Equipment
Property, plant and equipment are stated at cost. Merchandising
equipment consists principally of various systems that dispense
cleaning and sanitizing products and low-temperature dish-
washing machines. The dispensing systems are accounted for
on a mass asset basis, whereby equipment is capitalized and
depreciated as a group and written off when fully depreciated.
Depreciation and amortization are charged to operations using
the straight-line method over the assets’ estimated useful lives.
Ecolab 1998 Annual Report
38