2. Masco
ABOUT
Masco Corporation is a world leader in the manufacture of home improvement and
building products. Masco is also a leading provider of services that include the instal-
lation of insulation and other building products. We provide brand-name, value-added
products and services for the home and family that can be used with confidence and
displayed with pride.
Vision...COMMITMENT TO EXCELLENCE
OUR
Masco’s commitment to being a premier growth company with above-average increases
in earnings and value for our shareholders is driven by our focus on excellence in
people, products, services and partnering relationships.
Cover
ON THE
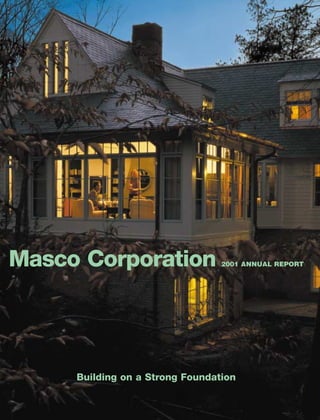
“The Timeless Home” was built in 2001 and unveiled at the 2002 International
Builders’ Show in Atlanta. This show home was a collaboration among Masco
Corporation, This Old House magazine, Jeremiah Eck Architects, Metropolitan Design
& Construction and Kay Douglass Interiors. The home combines traditional, time-hon-
ored design with new technology and improved materials that meet the needs of today’s
contemporary lifestyle. Nearly 20 of our companies provided products and services for
the home, including: architectural coatings; builders’ hardware; cabinetry; decorative
bath accessories and lighting; faucets and other plumbing products; and installation
services.
TABLE OF CONTENTS
Financial Results 1
Masco Leadership Companies and Brands 2
Shareholders’ Letter 4
Five-Year Internal Growth Forecast 13
Forty-Five Years of Growth 14
Financial Review 16
Corporate Directors and Officers 17
Division Operating Executives 18
Form 10-K
FORWARD-LOOKING STATEMENTS:
Our Annual Report to Shareholders contains statements reflecting our views about the Company’s future per-
formance. These statements are “forward-looking statements” under the Private Securities Litigation Reform Act
of 1995. Readers should refer to the comment at the beginning of “Management’s Discussion and Analysis of
Financial Condition and Results of Operations” contained in our Annual Report on Form 10-K included herein,
which explains that various factors may affect our projected performance. The forward-looking statements
include the Five-Year Sales Forecast on page 13, which is not intended to represent a full presentation of a
financial forecast. The Company’s independent accountants have neither examined nor compiled the accompa-
nying forward-looking statements and, accordingly, do not provide any assurance with respect to such statements.
3. Results2001 ANNUAL REPORT | m
FINANCIAL
DOLLARS IN THOUSANDS
EXCEPT PER COMMON SHARE DATA
45-Year 5-Year
Growth Growth 2001
Rate Rate vs 2000 2001 2000 19965 1956
Net Sales 16% 17% +15% $8,358,000 $7,243,000 $3,854,000 $10,670
Operating Profit 17% 13% + 8% $1,039,800 $ 960,020 $ 574,340 $ 950
1
Income From Continuing Operations2, 3 14% -11% -66% $ 198,500 $ 591,700 $ 355,100 $ 450
Income From Continuing Operations2, 3
as a % of:
Net Sales 2.4% 8.2% 9.2% 4.2%
4
Shareholders’ Equity 5.8% 18.9% 19.5% 9.0%
Shareholders’ Equity 16% 15% +20% $4,119,830 $3,426,060 $2,064,040 $ 5,420
Per Common Share Data:
Net Income2, 3 12% -13% -68% $ .42 $1.31 $ .83 $ .005/16
Cash Dividends Paid 16% 6% + 7% $ .52 1/2 $ .49 $ .38 1/2 $ .001/16
Includes restatement for 1999 poolings of interests, except for dividends.
Includes the reclassification of gains/losses on the disposition of fixed assets from other income (expense), net.
1
The year 2001 includes a $344 million after-tax ($530 million pre-tax), non-cash charge for the write-down of certain investments, principally securities of
2
Furnishings International Inc.
The year 2000 includes a $94 million after-tax ($145 million pre-tax), non-cash charge for the planned disposition of businesses and the write-down of
3
certain investments.
Based on shareholders’ equity as of the beginning of the year.
4
Excludes the home furnishings products segment, which was accounted for as discontinued operations and divested in August, 1996.
5
FIVE YEARS OF SALES GROWTH
IN MILLIONS
$7,243 $8,358
$6,307
$5,280
$4,508
97 98 99 00 01
|1
4. Companies2001 ANNUAL REPORT | m
LEADERSHIP
NET SALES IN MILLIONS
CABINETS AND RELATED PRODUCTS $2,551 $2,583
$2,220
This segment includes assembled and ready-to-assemble kitchen $1,908
$1,540
and bath cabinets; home office workstations; entertainment centers;
storage products; bookcases; and kitchen utility products. Masco is
the largest U.S. manufacturer of kitchen and bath cabinetry, offering
approximately 300 styles in more than 20 lines from
our U.S. companies KraftMaid, Merillat, Mill’s Pride and Texwood.
Our European cabinet leaders include Alma Küchen, The Alvic
Group, The Aran Group, The GMU Group, The Moores Group and
Tvilum-Scanbirk. 97 98 99 00 01
$1,839 $1,754
$1,803
PLUMBING PRODUCTS $1,667
$1,551
Masco is a world leader in the manufacture of plumbing products.
This segment includes faucets; plumbing fittings and valves; bath-
tubs and shower enclosures; and spas. Leading faucet brands
include Damixa®, Delta®, Mariani® and Peerless®. Leading plumbing
specialty brands include A&J Gummers™, Alsons®, Aqua Glass®,
Brass Craft®, Heritage™, Hot Spring®, NewTeam™ and Plumb Shop®.
97 98 99 00 01
INSTALLATION AND OTHER SERVICES
$855 $1,692
Masco provides a variety of installation services across the U.S. and $532
$250
in Canada. Included in this segment are the sale and installation $195
principally of insulation and, in certain locations, other products
including cabinetry; gutters; siding; windows; and fireplaces. Under
the Masco Contractor Services umbrella, this segment includes
industry leaders BSI Holdings, The Cary Group, Davenport Insulation
Group and Gale Industries.
DECORATIVE ARCHITECTURAL PRODUCTS 97 98 99 00 01
The Decorative Architectural Products segment includes paints and $1,395 $1,512
stains; mechanical and electronic lock sets; and door, window and $1,165
$919
other hardware. Market leaders in paints and stains include Behr $737
Process Corporation and Masterchem Industries with top-selling
brands Behr®, Behr Premium Plus®, Kilz® and Hammerite®. Leading
hardware brands include Baldwin®, Franklin Brass®, Ginger®,
Liberty®, Melard™ and Weiser® in the U.S. and Avocet Hardware in
Europe. This segment also includes Vapor Technologies, which pro-
vides coatings technology and manufacturing process equipment for
many Masco products. 97 98 99 00 01
$603 $817
OTHER SPECIALTY PRODUCTS $587
$536
$485
The Other Specialty Products segment includes windows and patio
doors; staple gun tackers, staples and other fastening tools; hydron-
ic radiators and heat convectors; and venting and ventilation sys-
tems. Companies in this segment include Arrow Fastener, Cobra,
Faucet Queens and Milgard Manufacturing in the U.S., and The
Brugman Group, Gebhardt, Griffin Windows, Jung Pumpen, Superia
Radiatoren and Vasco in Europe.
97 98 99 00 01
|2
6. MARCH 2002
Shareholders2001 ANNUAL REPORT | m
TO OUR
To say that the last two years have been a period of challenge
for Masco Corporation is a great understatement. We, along
with many other companies, did not anticipate the speed or
magnitude of the economic slowdown in our markets.
Beginning in the spring of 2000, our sales and earnings were
negatively impacted by a variety of factors, including reduced
consumer spending for our products, unusual plant start-up
costs, higher interest rates, weak foreign currencies, higher
energy costs and customer inventory reduction programs.
In 2001, the slowing economy, exacerbated by the tragic
events of September 11, contributed to even further reduced
demand for our products, as did the negative wealth effect of RICHARD A. RAYMOND F.
MANOOGIAN KENNEDY
the declining stock market, increased unemployment and lower
consumer confidence.
Despite all of these challenges, we were able to build on our
strong foundation and achieve record net sales in both 2001
and 2000.
Results
FINANCIAL
Financial results for 2001 include:
• Net sales, aided by acquisitions, were a record $8.3 billion, a
15 percent increase over the $7.2 billion we achieved in
2000;
• Operating profit exceeded $1 billion for the first time in the
Company’s history;
|4
7. • In the third quarter, our Company report-
ed a $530 million pre-tax ($344 million
after-tax), non-cash charge for the write-
down of certain investments, principally
securities of Furnishings International
Inc., which had previously contributed
approximately $.08 annually in earnings
per common share. Including this charge,
net income declined to $199 million from
$592 million in 2000, and earnings per
common share declined to $.42 in 2001
from $1.31 in 2000;
• Excluding the 2001 third quarter after-tax
charge and the 2000 fourth quarter after-
tax charge of $94 million, net income in The Company ended the year in a relatively
1
2001 declined 21 percent to $543 million ; strong financial position with cash in excess
of $300 million and unused lines of bank
• After-tax return on shareholders’ equity,
credit of approximately $2 billion. Total debt
after adjusting for the third quarter charge,
as a percent of total capitalization was 48
1
approximated 16 percent for 2001 ;
percent at year end.
• Capital expenditures for the year were
$274 million compared with $388 million OPERATING RESULTS
in 2000 when we completed a number of
Specific factors that contributed to our
major expansion programs at several
lower-than-anticipated earnings included:
divisions;
• Reduced consumer confidence, as a result
• The quarterly cash dividend was
of the negative wealth effect caused by the
increased to $.131/2 per common share,
stock market drop in 2000 and 2001, the
marking the 43rd consecutive year in
uncertain economy and the tragic events
which dividends have been increased; and
of September 11;
• During 2001, the Company issued $800
• Increased unemployment;
million of 6.75% notes due 2006; $500
million of 6% notes due 2004; and Zero • Reduced consumer liquidity and spending;
Coupon Convertible Senior Notes due and
2031 for gross proceeds of $750 million.
• Continued inventory reduction programs
Proceeds from 2001 debt issuances were
undertaken by our retail and wholesale
used principally to reduce floating interest
customers.
rate bank debt.
The combination of all of the above factors
resulted in year 2001 earnings being below
Certain non-GAAP measures are provided to enhance compa-
1
rability and to provide additional information regarding the what the Company expected at the begin-
results of ongoing operations. These measures may not be
ning of the year.
comparable to similarly titled measures reported by other
companies and should not be considered as an alternative or
superior to amounts reported under accounting principles
generally accepted in the United States. See consolidated
financial statements.
|5
8. Segments
BUSINESS
Decorative Architectural Products
Masco continues to be a world leader in the
manufacture of home improvement and
This segment includes paints and stains;
building products as well as a leading
mechanical and electronic lock sets; and
provider of services that include the instal-
door, window and other hardware.
lation of insulation and other building prod-
Net sales of decorative architectural prod-
ucts. The Company’s current operations are
ucts increased eight percent to $1,512 mil-
in the following business segments:
lion in 2001 from $1,395 million in 2000.
Cabinets and Related Products
Other Specialty Products
This segment includes assembled and
This segment includes windows and patio
ready-to-assemble kitchen and bath cabinets;
doors; staple gun tackers, staples and other
home office workstations; entertainment
fastening tools; hydronic radiators and
centers; storage products; bookcases; and
heat convectors; and venting and ventilation
kitchen utility products.
systems.
Net sales of cabinets and related products
Net sales of other specialty products
increased approximately one percent to
increased 35 percent to $817 million in
$2,583 million in 2001 from $2,551 million
2001 from $603 million in 2000, principally
in 2000.
due to the acquisition of Milgard
Plumbing Products Manufacturing, a leading manufacturer of
windows and patio doors.
This segment includes faucets; plumbing fit-
tings and valves; bathtubs and shower
Results
enclosures; and spas. GEOGRAPHIC
Most of Masco’s business continues to be
Net sales of plumbing products declined five
generated in North America, accounting for
percent to $1,754 million in 2001 from
approximately 85 percent of the Company’s
$1,839 million in 2000.
sales. Following is a breakdown of sales by
Installation and Other Services geographic region:
Included in this segment are the sale and • Net sales in North America, aided by
installation principally of insulation and, in acquisitions, increased 19 percent to
certain locations, other products including $7,088 million in 2001 from $5,947
cabinetry; gutters; siding; windows; and million in 2000.
fireplaces.
• Net sales of international operations,
Masco nearly doubled the size of this principally in Europe, declined two per-
segment in 2001 with the acquisition of BSI cent to $1,270 million in 2001 from
Holdings. $1,296 million in 2000.
Net sales of installation and other services
increased 98 percent to $1,692 million in
2001 from $855 million in 2000.
|6
9. Growth2001 ANNUAL REPORT | m
FOUNDATION FOR
Over the years, the Company has focused internal sales growth, largely as a result of
on our goals of achieving above-average new products, industry growth and
growth and strong cash flow. This has been increased market share.
attained through a combination of internal
A variety of initiatives have contributed to
growth, acquisitions and cost containment
our successful internal growth: coordinat-
initiatives, as well as aggressive marketing,
ing marketing programs that use shared
merchandising and new product develop-
customer and end-user research, combin-
ment programs. Our goal over the next five
ing the resources of our operating divisions
years is to achieve the following approxi-
to maximize efficiencies and product offer-
mate average financial objectives:
ings, and developing key customer incentive
• Average 6–10 percent annual internal programs to help grow sales and increase
sales growth; market share.
• Average 5–10 percent annual sales NET SALES AND OPERATING PROFIT1
growth through acquisitions; DOLLARS IN THOUSANDS
Year Net Sales Operating Profit 2, 3
• Average at least 15 percent annual
2001 $8,358,000 $1,039,800
growth in earnings per common share;
2000 7,243,000 960,020
1999 6,307,000 911,010
• Average 15–18 percent annual operating
1998 5,280,000 870,090
profit margins before general corporate
1997 4,508,000 704,550
expense; 1996 3,854,000 574,340
1995 3,435,000 461,900
• Average annual after-tax return on equity
1994 2,988,260 466,140
of 15–20 percent; and 1993 2,507,740 363,740
1992 2,218,050 313,000
• Improve our cash flow and return on
10-Year Annual
assets. Growth Rate 16% 17%
Includes restatement for 1999 poolings of interests.
Growth 1 Excludes the home furnishings products segment, which was accounted
INTERNAL for as discontinued operations and divested in August, 1996.
2 Includes the reclassification of gains/losses on the disposition of fixed
Over the past ten years, excluding acquisi- assets from other income (expense), net.
3 After general corporate expense.
tions, we have averaged 8.1 percent annual
|7
10. Masco Key Retailer Program
LEADERSHIP PRODUCTS
AND SERVICES Initiated in 1986, the Key Retailer Program
has consistently driven incremental growth
DOLLARS IN THOUSANDS
20011 Percent and market share gains and provided a
Sales of Total
competitive advantage for Masco. Through
Cabinets and Related Products $2,380,000 29%
this effort, we developed coordinated pro-
Installation and Other Services 1,570,000 19%
grams with key customers that leverage the
Plumbing Products 1,410,000 17%
collective strength of our individual operat-
Decorative Architectural Products 1,340,000 17%
ing companies. During the past five years,
Other Specialty Products 680,000 8%
Masco’s Key Retailer Program sales, aided
Leadership Sales $7,380,000 90%
by acquisitions, have increased at an aver-
Total Home Improvement and
age annual rate of 29 percent.
Building Products Sales $8,174,000 100%
Excludes discontinued product lines.
1
KEY RETAILER SALES1
IN MILLIONS
We estimate that approximately 90 percent $2,730 $2,940
$1,650
of our sales are from products and services $1,100
$970
$819
that represent leadership positions in their $738
$620
market segments. We believe that Masco’s $415
$350
leading brands have contributed signifi-
cantly to our market share gains and to our
sales growth.
CUSTOMER GROWTH PROGRAMS
In recognition of changing customer needs
and the evolution of our Company, we
revised two major customer incentive
programs in recent years – the Masco Key 92 93 94 95 96 97 98 99 00 01
Retailer Program and the Masco Builder Includes sales of acquired companies from date of acquisition.
1
Alliance Program. Both programs are now
exclusively focused on the top tier Masco Builder Alliance Program
customers in each market that utilize a
When introduced in 1987, the Masco
number of products from the Masco family
Builder Partnership Program was the
of companies. The objectives for these
industry’s first comprehensive growth ini-
programs are:
tiative. Through coordinated efforts to meet
quality, procurement, installation, training,
• To reward our strategic customer part-
upgrade selling and delivery needs, the
ners for profitable sales growth; and
Masco Builder Partnership Program was
• To encourage customers to support a
designed to offer leading builders the
broader selection of Masco’s products.
opportunity to increase sales and prof-
itability. In 2001, the program was
redesigned and renamed the Masco Builder
Alliance Program (MBA) to reflect its
renewed focus and customization to meet
the changing needs of our builder customers.
|8
11. NEW PRODUCT DEVELOPMENT
New product development has always been an important com-
ponent of Masco’s revenue growth. Over the past decade, it has
taken on even more significance due to distribution shifts and
the multitude of new products in the marketplace that must be
properly positioned. As a result, in 2001, we formed the Masco
Design Trend Council to work with our operating companies
on long-term new product identification, innovation and inte-
gration activities.
Council members are Masco employees who have expertise in
new product development and are on the forefront of trends,
colors and design. Through the efforts of the Council and our
operating companies, Masco is able to provide distinctive,
high-value products while leading the marketplace with new
and exciting innovations.
Development
CORPORATE
In addition to internal growth, Masco has experienced signifi-
cant expansion over the past decade through our ambitious
acquisition program, which continues to remain a key compo-
nent of our overall growth strategy.
Masco seeks high-margin leadership companies with above-
average growth potential that share the same cultural values
and entrepreneurial spirit upon which Masco was founded.
Key to our strategy is acquiring companies with annual sales
generally in the range of $100 million to $500 million and oper-
ating profit margins of at least 15 percent.
We seek companies that also have brand leadership positions
and product or service lines that complement our existing
companies. The type of companies that we strive to acquire
are those which exhibit leadership in serving one or more of
our key customer groups — homebuilders, wholesale and THESE ARE JUST A FEW
OF THE MANY NEW
other distributors, home centers, mass merchants and other PRODUCTS AND FINISHES
retail home improvement outlets. In addition, these companies INTRODUCED IN 2001.
share similar operating philosophies as well as strong man-
agement teams that wish to remain with the Company.
2001 ACQUISITIONS
During 2001, Masco acquired the following companies with
combined annual sales of approximately $1.4 billion:
|9
12. • The Aran Group, an Italian manufacturer
of assembled kitchen cabinets;
• BSI Holdings, Inc., a leading provider of
installed insulation and other products
within the United States and Canada;
• d-Scan, Inc., a style leader in the manufac-
ture of ready-to-assemble products, includ-
ing bookcases, entertainment centers and
other home/office products;
and installers of insulation and other
• Griffin Windows Limited, a United King-
building products.
dom manufacturer of door and window
products;
Composed of BSI Holdings, The Cary Group,
• Milgard Manufacturing Incorporated, a Davenport Insulation Group and Gale
leading manufacturer of windows and patio Industries, MCS, with over 300 branch loca-
doors in the western United States; and tions and 12,000 employees, serves builder
customers throughout the United States.
• Resources Conservation, Inc., an innovative
manufacturer of energy and water saving Recognizing that customer needs are
showerheads and decorative trim products. changing, MCS provides integrated solu-
tions to builders through a variety of instal-
While our acquisition efforts have been lation services—primarily insulation and, in
aggressive, we continue to review our certain locations, a broad range of other
portfolio of businesses and have, when products, including cabinetry, gutters, sid-
appropriate, divested companies that were ing, windows and fireplaces. Currently,
inconsistent with our growth and profit- Masco installs products in approximately 60
ability objectives or were no longer a strate- percent of all new single-family homes.
gic fit with Masco. Two companies that were
In 2001, MCS announced its inno-
identified as not core to our long-term
vative energy performance program—
growth strategies were divested in 2001.
Environments for Living™. The program is
designed to help builders with a
INSTALLATION SERVICES GROWTH
system-based approach to the design and
Through a number of acquisitions in the
application of the principles of building
past seven years, Masco has achieved a
science as they relate to energy usage.
significant presence in the service industry.
Environments for Living-certified homes
Net sales of installation and other services
offer increased homeowner comfort and
have grown from less than $100 million in
satisfaction through improved energy
1995, when we entered the installation
utilization—a significant product offering
business, to $1.7 billion in 2001.
for our builder customers. We believe that
Environments for Living will provide a plat-
In 2001, Masco introduced Masco
form for new energy efficient products as
Contractor Services (MCS) as a key initiative
we help move the construction industry into
to specifically focus on builder customer
a new paradigm of quality building design.
needs. Under this umbrella, MCS offers a
nationwide network of leading providers
| 10
13. Future2001 ANNUAL REPORT | m
FOUNDATION FOR THE
We firmly believe that in order to be OUTLOOK FOR THE FUTURE
successful in today’s dynamic, intensely
We continue to be optimistic regarding
competitive global marketplace, a company
Masco’s future outlook. Many of the factors
must continuously reinvent itself to survive
that negatively impacted our business in the
and prosper. To this end, in 2000 we formed
past two years might reverse themselves in
corporate teams to evaluate all aspects of
the next few years. Customer inventories
our business. The teams focus principally on
will need to be rebuilt, interest rates and
broad strategies and specific tactics to
energy costs are lower, consumer confi-
achieve our growth objectives, improve
dence is improving, and foreign currencies
profitability and increase cash flow.
are more favorable than they have been for
the past several years. In addition,
During 2001, these teams successfully
increased focus on the home should help to
identified and implemented a number of ini-
expand consumer demand for our products.
tiatives that should contribute positively to
our future results.
We believe that the Company’s growth
potential today is greater than ever before.
While we have many challenges ahead
During the first few months of this year, we
of us, we are committed to increasing
have experienced a partial recovery in our
shareholder value by containing costs, max-
businesses in North America and,
imizing efficiency, marketing our products
if present economic trends continue, we
and services aggressively, maintaining a
believe that we will achieve significant
culture that is committed to continuous
improvement in sales and earnings in 2002.
improvement in everything we do and
continuing our history of growth. We believe
As we look to the future, striving to build
that in order to build upon our already-
upon our strong foundation, we take pride
strong foundation, we must remain diligent
in our products and services that represent
in evaluating our progress and the strate-
leadership positions as well as a culture that
gies implemented to attain our goals.
values excellence, innovation and entrepre-
neurial vision. These are the principles that
Our over 55,000 employees are integral to
we will continue to embrace as we all work
this process, and we continue to appreciate
together to meet our financial and opera-
their continued commitment to quality and
tional goals and achieve above-average
their service to Masco and our customers.
returns for our shareholders.
We would especially like to thank Arman
Simone and Peter Stroh, who retired from
our Board of Directors last year, for their
Richard A. Manoogian
many years of valued service to the
Chairman and Chief Executive Officer
Company.
Raymond F. Kennedy
President and Chief Operating Officer
| 11
14. Growth2001 ANNUAL REPORT | m
45-YEARS OF SALES
IN THOUSANDS $8,358,000
$11,810
BUILDING ON A STRONG FOUNDATION,
OUR LEADING BRANDS HAVE
CONTRIBUTED TO OUR SALES GROWTH
OVER THE PAST 45 YEARS.
57 61 71 76 81 86 96
91 01
66
™
™
™
® ®
®
® GRIFFIN WINDOWS
WORLD
™
™ ™
¤
™
™
™
™
™
™
™
™
™ ™
™
™
™
®
™ ®
®
® ™
®
®
®
®
15. GrowthFORECAST|m
INTERNAL
FIVE-YEAR INTERNAL GROWTH SALES FORECAST
DOLLARS IN THOUSANDS
Internal Growth
Sales Forecast Actual Sales
5-Year 5-Year
Growth Rate Growth Rate
2002-2006 2006 1997-2001 2001 19961
Cabinets and Related Products 6% $ 3,460,000 16% $2,583,000 $1,234,000
Plumbing Products 6% 2,370,000 4% 1,754,000 1,443,000
Installation and Other Services 8% 2,310,000 60% 1,568,000 150,000
Decorative Architectural Products 10% 2,480,000 22% 1,512,000 550,000
Other Specialty Products 16% 1,570,000 26% 757,000 239,000
Total Home Improvement and
Building Products 8% $12,190,000 18% $8,174,000 $3,616,000
All years exclude discontinued product lines.
1 Includes restatement for 1999 poolings of interests.
ASSUMPTIONS USED IN FORECAST
2002–2006
1. Average 2 percent real annual growth in GDP.
2. Average 3 percent annual inflation, with no
change in net average pricing of Masco products.
3. No significant acquisitions or divestitures.
4. No change in currency exchange rates.
| 13
17. FORTY-FIVE YEARS OF GROWTH | m
AS RESTATED TO REFLECT POOLINGS OF INTERESTS
Dollars In Thousands Except Per Common Share Data
Net Income Per Common
Share Data
as a Percent
Income Deprec. Share- of Share- Net Dividends Average
Net Before Income Net & Working holders’ holders’ Income Paid Common
Sales5 Taxes Taxes Income Amort. Capital Equity Equity 1 Shares2
2, 3 2, 6
Growth
Rates:
5-Year 17% -12% -14% -11% 19% 6% 15% - -13% 6% -
10-Year 16% 12% 7% 18% 10% 5% 8% - 15% 6% -
45-Year 16% 14% 13% 14% 15% 15% 16% - 12% 16% -
Years
2001 $8,358,000 $300,700 $102,200 $198,500 $269,490 $1,390,360 $4,119,830 5.8% $0.42 $0.521⁄2 459,730
2000 7,243,000 893,400 301,700 591,700 238,330 1,230,110 3,426,060 18.9% 1.31 0.49 449,270
1999 6,307,000 904,100 334,500 569,600 181,820 1,263,350 3,136,500 20.5% 1.28 0.45 442,900
1998 5,280,000 905,540 340,440 565,100 156,670 1,105,660 2,774,040 25.4% 1.26 0.43 442,700
1997 4,508,000 733,830 289,730 444,100 131,510 1,049,690 2,224,820 21.5% 1.02 0.401⁄2 429,800
1996 3,854,000 577,150 222,050 355,100 111,620 1,019,940 2,064,040 19.5% 0.83 0.381⁄2 425,000
19954 3,435,000 427,820 190,320 237,500 108,370 585,810 1,820,710 10.5% 0.56 0.361⁄2 423,000
1994 2,988,260 354,200 134,970 219,240 130,710 1,278,160 2,257,710 10.3% 0.52 0.341⁄2 421,400
1993 2,507,740 384,740 145,070 239,670 123,160 1,161,960 2,121,120 12.2% 0.59 0.321⁄2 409,200
1992 2,218,050 310,260 123,920 186,350 120,390 975,870 1,963,280 10.0% 0.46 0.301⁄2 407,200
1991 1,876,050 92,840 54,180 38,660 107,350 863,030 1,865,930 2.1% 0.10 0.281⁄2 403,600
1990 1,854,790 221,240 98,180 123,070 97,310 822,350 1,841,220 6.6% 0.30 0.27 409,000
1989 1,835,880 301,820 107,060 194,770 89,080 859,840 1,865,870 11.1% 0.47 0.25 415,000
1988 1,669,320 442,390 139,650 302,740 86,570 849,270 1,750,160 19.7% 0.73 0.22 416,000
1987 1,554,400 360,380 118,920 241,460 69,170 691,290 1,537,730 18.8% 0.69 0.19 349,800
1986 1,344,610 350,860 129,390 221,470 48,430 641,840 1,287,390 21.0% 0.64 0.17 344,600
1985 1,165,260 283,310 106,040 177,270 38,690 613,410 1,056,010 19.9% 0.52 0.141⁄2 338,400
1984 1,174,360 229,260 86,780 142,480 42,340 499,160 888,850 17.3% 0.42 0.121⁄2 337,800
1983 1,184,800 210,150 81,060 129,090 54,640 592,940 824,340 19.5% 0.39 0.11 327,400
1982 929,640 167,520 64,020 103,500 46,330 433,420 663,140 18.6% 0.33 0.10 313,800
1981 943,860 170,940 68,630 102,310 40,450 421,840 555,100 22.5% 0.33 0.09 306,100
1980 826,040 152,260 64,870 87,390 33,950 388,530 454,590 23.0% 0.29 0.08 302,900
1979 785,390 145,830 63,270 82,560 28,080 362,380 379,140 24.3% 0.27 0.071⁄2 308,300
1978 636,240 124,740 57,300 67,440 20,530 284,810 339,390 23.9% 0.22 0.06 310,200
1977 486,530 102,260 45,890 56,370 15,390 213,990 282,340 24.3% 0.18 0.041⁄2 310,200
1976 449,040 94,550 42,520 52,030 11,260 184,420 231,840 28.4% 0.17 0.03 310,100
1975 327,860 63,670 29,880 33,790 10,060 130,600 183,510 22.0% 0.11 0.02 309,600
1974 279,560 53,030 25,010 28,020 8,340 105,510 153,620 22.2% 0.09 0.02 309,000
1973 224,230 45,260 21,960 23,310 6,650 89,990 126,350 22.3% 0.08 0.011⁄2 301,300
1972 162,480 34,650 17,040 17,610 5,010 55,380 104,760 26.6% 0.06 0.01 291,800
1971 121,130 23,470 11,250 12,220 4,370 49,520 66,280 22.1% 0.04 0.01 284,300
1970 99,090 20,260 9,860 10,400 3,720 44,310 55,210 22.3% 0.04 0.003⁄4 282,200
1969 96,850 21,700 11,810 9,890 2,950 37,220 46,630 25.4% 0.04 0.005⁄8 281,500
1968 86,530 18,530 10,050 8,480 3,100 17,440 38,880 27.0% 0.03 0.009⁄16 281,000
1967 66,190 13,450 6,210 7,240 2,570 14,540 31,440 27.9% 0.03 0.001⁄2 280,100
1966 56,520 12,510 5,780 6,720 1,690 13,350 25,920 32.9% 0.02 0.001⁄2 275,800
1965 44,720 10,050 4,680 5,380 1,240 11,590 20,420 33.6% 0.02 0.007⁄16 275,500
1964 35,360 8,140 3,960 4,190 970 9,650 16,020 32.7% 0.02 0.003⁄8 273,000
1963 27,820 6,200 3,150 3,050 760 7,700 12,800 28.2% 0.01 0.005⁄16 261,100
1962 22,840 4,350 2,160 2,190 820 6,330 10,800 24.6% 0.01 0.001⁄8 260,100
1961 16,760 2,530 1,270 1,270 710 5,060 8,890 16.2% 0.001⁄2 0.001⁄8 258,800
1960 15,740 2,000 980 1,020 870 4,350 7,830 14.4% 0.002⁄5 0.001⁄16 258,800
1959 15,550 1,920 960 960 790 3,940 7,060 15.1% 0.003⁄8 0.001⁄16 258,800
1958 11,760 1,110 520 590 700 3,220 6,360 10.1% 0.001⁄4 0.001⁄32 228,400
1957 11,810 1,030 480 550 620 2,640 5,870 10.1% 0.001⁄4 0.001⁄16 205,900
Based on shareholders’ equity as of the beginning of the year.
1
After giving effect to 100 percent stock distributions in 1998, 1986, 1982, 1975, 1971, 1963 and 1961, and 50 percent stock distributions in 1968 and 1967.
2
Years 1976 through 1981 and after 1996 include the effect of common share dilution.
3
For 1995, net sales, depreciation and amortization and working capital exclude discontinued home furnishings operations; income before taxes, income taxes and net-
4
income exclude the effect of the $650 million loss on disposition of such operations.
Net sales prior to 1995 exclude discontinued home furnishings operations; other data prior to 1995 include discontinued home furnishings operations.
5
Dividends per common share have not been adjusted for poolings of interests.
6
| 15
18. Review2001 ANNUAL REPORT | m
FINANCIAL
SELECTED FINANCIAL DATA—CONTINUING OPERATIONS (CONSOLIDATED)
Dollars In Thousands Except Per Common Share Data
2001 2000 1999 1998 1997
Net sales $8,358,000 $ 7,243,000 $ 6,307,000 $5,280,000 $ 4,508,000
Operating profit1 $1,039,800 $ 960,020 $ 911,010 $ 870,090 $ 704,550
Income from continuing operations2, 3 $ 198,500 $ 591,700 $ 569,600 $ 565,100 $ 444,100
Per share of common stock 4:
Income from continuing operations2, 3:
Basic $0.43 $1.34 $1.31 $1.30 $1.05
Diluted $0.42 $1.31 $1.28 $1.26 $1.02
Dividends declared $0.53 $0.50 $0.46 $0.431⁄2 $0.41
Dividends paid $0.521/2 $0.49 $0.45 $0.43 $0.401⁄2
Income from continuing operations2, 3 as a % of:
Net sales 2.4% 8.2% 9.0% 10.7% 9.9%
Shareholders’ equity5 5.8% 18.9% 20.5% 25.4% 21.5%
Capital expenditures $ 274,430 $ 388,030 $ 350,850 $ 243,380 $ 215,190
At December 31:
Total assets $9,183,330 $ 7,744,000 $ 6,634,920 $5,618,850 $ 4,696,600
Long-term debt $3,627,630 $ 3,018,240 $ 2,431,270 $1,638,290 $ 1,553,950
Shareholders’ equity $4,119,830 $ 3,426,060 $ 3,136,500 $2,774,040 $ 2,224,820
Book value per common share2, 3, 4 $8.97 $7.70 $7.07 $6.26 $5.12
Includes restatement for 1999 poolings of interests, except for dividends.
1 Includes the reclassification of gains/losses on the disposition of fixed assets from other income (expense), net.
2 The year 2001 includes a $344 million after-tax ($530 million pre-tax), non-cash charge for the write-down of certain investments, principally securities of
Furnishings International Inc.
3 The year 2000 includes a $94 million after-tax ($145 million pre-tax), non-cash charge for the planned disposition of businesses and the write-down of
certain investments.
4 After giving effect to 100 percent common stock distribution in July 1998.
5 Based on shareholders’ equity as of the beginning of the year.
OPERATING PROFIT AS A % OF NET SALES1
2001 2000 1999 1998 1997
As reported 12.4% 13.2% 14.4% 16.5% 15.6%
Before general corporate expense2, 3 13.6% 14.6% 15.9% 18.1% 17.4%
Before goodwill amortization and
general corporate expense3 14.7% 15.5% 16.6% 18.7% 17.9%
Includes restatement for 1999 poolings of interests.
1 Includes the reclassification of gains/losses on the disposition of fixed assets from other income (expense), net.
2 General corporate expense is reported in the “Segment Information” Note in the
MASCO COMMON SHARE
Consolidated Financial Statements.
MARKET PRICE—P/E RATIO1
3 These non-GAAP measures provide additional information regarding the results
of ongoing operations. These measures may not be comparable to similarly titled
Earnings Price/
measures reported by other companies and should not be considered as an
Market Per Common Earnings
alternative or superior to amounts reported under accounting principles generally
Price Share As Ratio
accepted in the United States.
Year High Low Reported2 High Low
2001 $26.94 $17.76 $0.42 64 – 42
2000 27.00 14.50 1.31 21 – 11
1999 33.69 22.50 1.28 26 – 18
1998 33.00 20.75 1.26 26 – 16
1997 26.91 16.88 1.02 26 – 17
Five-Year Average 33 – 21
After giving effect to 100 percent common stock distribution in
1
July 1998.
Includes restatement for 1999 poolings of interests.
2
| 16
19. Leadership2001 ANNUAL REPORT | m
CORPORATE
DIRECTORS OFFICERS
THOMAS G. DENOMME1, 3 WILLIAM T. ANDERSON JOHN J. KIMES
Retired Vice Chairman and Chief Administrative Officer Group Vice President Group Vice President
Chrysler Corporation
RONALD W. AYERS
Director since 1998 ALAN J. KRAUSS
Group President Senior Group President
PETER A. DOW 1, 2
ALAN H. BARRY
Retired Vice Chairman, Chief Operating Officer and LARRY J. LA BO
Executive Committee Chairman Group President Vice President – Controller
Campbell-Ewald, an advertising company North American Operations
Director since 2001 DR. LILLIAN BAUDER
JOHN R. LEEKLEY
Vice President – Corporate
ANTHONY F. EARLEY, JR. Affairs Senior Vice President and
Chairman, Chief Executive Officer, General Counsel
President and Chief Operating Officer KLAUS BOCH
DTE Energy Company RICHARD A. MANOOGIAN
Vice President – Controller
Director since 2001 European Operations Chairman of the Board and
Chief Executive Officer
JOSEPH L. HUDSON, JR.1 J. MICHAEL CAMPBELL
Trustee KAREN R. MENDELSOHN
Group President
Hudson-Webber Foundation, philanthropic organization Vice President – Sales and
Director since 1996 SAM A. CRACCHIOLO Marketing
Director of Corporate
VERNE G. ISTOCK1, 2 DONALD J. MILROY
Development
Retired Chairman/President Group Vice President
Bank One Corporation SAMUEL A. CYPERT
Director since 1997 JERRY W. MOLLIEN
Vice President – Investor
Relations Vice President – Corporate
RAYMOND F. KENNEDY3 Taxes
President and Chief Operating Officer DAVID A. DORAN
Masco Corporation RICHARD G. MOSTELLER
Vice President – Taxes
Director since 1998 Vice President and
CHARLES A. DOWD, JR. Senior Financial Advisor
WAYNE B. LYON
Group President
Chairman ROBERT B. ROSOWSKI
LifeStyle Furnishings International Ltd. DANIEL R. FOLEY Vice President and
Director since 1988 Treasurer
Vice President – Human
Resources
RICHARD A. MANOOGIAN3 R. HAMILTON SCHIRMER
Chairman of the Board and Chief Executive Officer LAU FRANDSEN Vice President – Business
Masco Corporation Development
Group President – Europe
Director since 1964
BARRY J. SILVERMAN
EUGENE A. GARGARO, JR.
JOHN A. MORGAN2, 3
Vice President – Associate
Vice President and
Managing Director General Counsel
Secretary
Morgan Lewis Githens & Ahn, investment bankers
Director since 1969 DAVID W. VAN HISE
TED GOOLD
Vice President – International
Group Vice President
MARY ANN VAN LOKEREN2
Chairman and Chief Executive Officer TIMOTHY WADHAMS
ROLAND GRASSBERGER
Krey Distributing Company
Vice President and
Group Vice President
Director since 1997
Chief Financial Officer
RAYMOND F. KENNEDY
JOHN C. WILLS
President and Chief
Group President
Operating Officer
Member of Audit Committee
1
Member of Organization and Compensation Committee
2
Member of Executive Committee
3
| 17
20. Executives2001 ANNUAL REPORT | m
DIVISION OPERATING
Allan Abrams Michael P. Duggan William J. Kushlick Alejandro Rosales
Vasken Altounian Andoni Eizmendi Bob C. Ladd Peter Schabos
Ole Lund Andersen Jeffrey D. Filley Saul Levitt Bastian Schaefer
Antonio Arangiaro Ronald J. Foy Robert Manroe William F. Schmidt
A. James Aruffo Stephen Gannon R. Bruce Martin Vernon S. Schroeder
Marc Bickler Esmerelda Goncalves Nicholas McGrellis Ronald D. Smith
Nicholas Billig Steven M. Hammock Reinhard Metzger Larry Solari
Thomas Breuer Larry B. Higgins Gary E. Milgard Giuliano Spina
Charles M. Brown Werner Hornschemeyer Bernd Möhner Todd Talbot
Roger A. Carlson David B. Humenik Nicholas W. Moss Jochen Tappmeier
Thomas N. Chieffe Eckhard Keill Rob Nicholson Jos Vaessen
John J. Dellamore David J. Kent Michael Perpeet Jerry Volas
Donald J. DeMarie, Jr. Clay H. Kiefaber Luciano Pianezzola Alfons Walder
Wayne Devine Stanley G. Korte Dominic Primucci Michael Wales
Herbert Dieterle Dieter E. Krist Steven P. Raia Jose Zubizarreta
RESPONSIBILITY FOR FINANCIAL STATEMENTS
Management is responsible for the fairness and integrity of the Company’s consolidated financial state-
ments. In order to meet this responsibility, management maintains formal policies and procedures that
are consistent with high standards of accounting and administrative practices, which are regularly com-
municated within the organization. In addition, management maintains a program of internal auditing
within the Company to examine and evaluate the adequacy and effectiveness of established internal con-
trols as related to Company policies, procedures and objectives. The accompanying report of the
Company’s independent accountants states their opinion on the Company’s consolidated financial state-
ments, based on audits conducted in accordance with auditing standards generally accepted in the
United States of America.
The Audit Committee of the Board of Directors meets periodically with both management and the inde-
pendent accountants to provide oversight with respect to the Company’s financial reporting process and
system of internal control.
| 18
21. hareholders2001 ANNUAL REPORT | m
INFORMATION FORS
COMPANY PROFILE Send all other shareholder inquiries, including those
regarding lost, stolen or destroyed stock certificates,
Masco Corporation is one of the world’s largest man-
to:
ufacturers of brand-name consumer products for the
home and family. Masco Corporation is also a leading
The Bank of New York
provider of services that include the installation of
Shareholder Relations Department
insulation and other building products.
P.O. Box 11258
Church Street Station
Our products include faucets, kitchen and bath
New York, NY 10286
cabinets, architectural coatings (paints and stains),
bath and shower units, spas and hot tubs, showering
Answers to many of your shareholder questions and
and plumbing specialties, windows, lock sets and
requests for forms are available by visiting The Bank
other builders’ hardware, air treatment products,
of New York’s website at www.stockbny.com
ventilating equipment and pumps.
The Company has approximately 6,000 shareholders DUPLICATE MAILINGS
of record and 55,400 employees. Masco’s principal Shares owned by one person, but held in different
manufacturing facilities are located throughout the forms of the same name (e.g., John Smith, John B.
United States; international operations are primarily Smith, J.B. Smith), result in duplicate mailings of
located in Europe, particularly Denmark, Germany, shareholder information at added expense to the
Italy, Spain and the United Kingdom. Company. By law, such duplication can be eliminated
only at the request of the shareholder.
EXECUTIVE OFFICES
Please notify The Bank of New York by calling
Corporate Headquarters
800-524-4458 if you wish to eliminate such
Masco Corporation
duplication.
21001 Van Born Road
Taylor, MI 48180
DIVIDEND REINVESTMENT PLAN
313-274-7400
Masco Corporation has appointed The Bank of New
Fax 313-792-6135
York to serve as agent for our Dividend Reinvestment
Plan. All enrollments, terminations, sales, requests
INDEPENDENT ACCOUNTANTS
for certificates and optional cash payments regarding
PricewaterhouseCoopers LLP
the Plan should be sent to:
400 Renaissance Center
Detroit, MI 48243
The Bank of New York
Dividend Reinvestment Department
STOCK EXCHANGE INFORMATION P.O. Box 1958
Masco Corporation common stock is traded on the Newark, NJ 07101-9774
New York Stock Exchange with the symbol MAS.
INTERNET
TRANSFER AGENT, REGISTRAR AND
Current information on Masco Corporation can be
DIVIDEND DISBURSING AGENT found by visiting our home page on the Internet at
The Bank of New York www.masco.com
Shareholder Relations Department
P.O. Box 11258
INVESTOR RELATIONS CONTACT
Church Street Station
Additional information about the Company is avail-
New York, NY 10286
able without charge to shareholders who direct a
request to:
SHAREHOLDER INQUIRIES CAN BE
ANSWERED BY CONTACTING: Samuel A. Cypert
The Bank of New York Vice President–Investor Relations
800-524-4458 Masco Corporation
E-Mail Address: shareowner-svcs@bankofny.com 21001 Van Born Road
Taylor, MI 48180
Send certificates for transfer and address changes to:
ANNUAL MEETING OF SHAREHOLDERS
The Bank of New York
The 2002 Annual Meeting of Shareholders of Masco
Receive and Deliver Department
Corporation will be held at the offices of the Company
P.O. Box 11002
on May 15, 2002 at 10:00 a.m. local time.
Church Street Station
New York, NY 10286
22. m
MASCO CORPORATION
21001 Van Born Road
Taylor, Michigan 48180
313.274.7400
www.masco.com