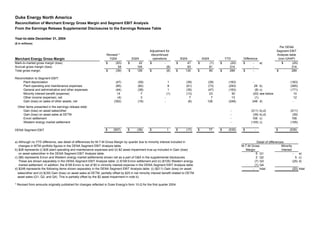
1. Duke Energy North America
Reconciliation of Merchant Energy Gross Margin and Segment EBIT Analysis
From the Earnings Release Supplemental Disclosures to the Earnings Release Table
Year-to-date December 31, 2004
($ in millions)
Per DENA
Adjustment for Segment EBIT
Revised * discontinued Analysis table
1Q04 2Q04 operations 3Q04 4Q04 YTD Difference (non-GAAP)
Merchant Energy Gross Margin
Mark-to-market gross margin (loss) $ (93) $ 22 $ - $ 47 $ (1) $ (25) $ - a) $ (25)
Accrual gross margin (loss) 54 104 (8) 83 81 314 - 314
Total gross margin $ (39) $ 126 $ (8) $ 130 $ 80 $ 289 $ - $ 289
Reconciliation to Segment EBIT:
Plant depreciation (47) (39) 1 (39) (39) (163) - (163)
Plant operating and maintenance expenses (85) (82) 8 (61) (73) (293) 28 b) (265)
General and administrative and other expenses (44) (38) 1 (35) (47) (163) (8) c) (171)
Minority interest benefit (expense) 14 7 (1) (13) 23 30 (20) see below 10
Other income (expense), net (4) 3 - 7 7 13 (1) 12
Gain (loss) on sales of other assets, net (352) (16) - (6) 126 (248) 248 d) -
Other items presented in the earnings release slide:
Gain (loss) on asset sales/other - (211) b),d) (211)
Gain (loss) on asset sales at DETM - (39) b),d) (39)
Enron settlement - 108 c) 108
Western energy market settlement - (105) c) (105)
$ (557) $ (39) $ 1 $ (17) $ 77 $ (535) $ - $ (535)
DENA Segment EBIT
a) Although no YTD difference, see detail of differences for M-T-M Gross Margin by quarter due to minority interest included in Detail of differences
changes in MTM portfolio figures in the DENA Segment EBIT Analysis table. M-T-M Gross Minority
b) $28 represents (i) $26 plant operating and maintenance expenses and (ii) $2 asset impairment true-up included in Gain (loss) Margin Interest
on asset sales/other in the DENA Segment EBIT Analysis table. 6 Q1 - a)
c) ($8) represents Enron and Western energy market settlements shown net as a part of G&A in the supplemental disclosures. 2 Q2 5 c)
These are shown separately in the DENA Segment EBIT Analysis table: (i) $108 Enron settlement and (ii) ($105) Western energy (7) Q3 (25) d)
market settlement. In addition, the $108 Enron is net of $5 in minority interest expense in the DENA Segment EBIT Analysis table. (1) Q4
d) $248 represents the following items shown separately in the DENA Segment EBIT Analysis table: (i) ($211) Gain (loss) on asset - total (20) total
sales/other and (ii) $(39) Gain (loss) on asset sales at DETM, partially offset by $25 in net minority interest benefit related to DETM
asset sales (Q1, Q2, and Q4). This is partially offset by the $2 asset impairment in note b).
* Revised from amounts originally published for changes reflected in Duke Energy's form 10-Q for the first quarter 2004.