occidental petroleum Oil and Gas net proved developed and undeveloped reserves and segment assets
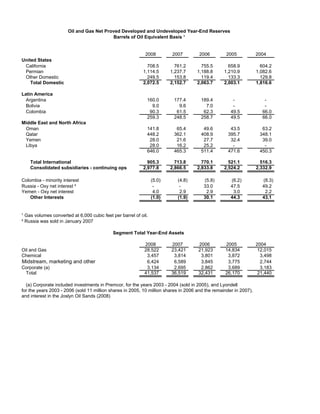
1. Oil and Gas Net Proved Developed and Undeveloped Year-End Reserves
Barrels of Oil Equivalent Basis ¹
2008 2007 2006 2005 2004
United States
California 708.5 761.2 755.5 658.9 604.2
Permian 1,114.5 1,237.7 1,188.8 1,210.9 1,082.6
Other Domestic 249.5 153.8 119.4 133.3 129.8
Total Domestic 2,072.5 2,152.7 2,063.7 2,003.1 1,816.6
Latin America
Argentina 160.0 177.4 189.4 - -
Bolivia 9.0 9.6 7.0 - -
Colombia 90.3 61.5 62.3 49.5 66.0
259.3 248.5 258.7 49.5 66.0
Middle East and North Africa
Oman 141.8 65.4 49.6 43.5 63.2
Qatar 448.2 362.1 408.9 395.7 348.1
Yemen 28.0 21.6 27.7 32.4 39.0
Libya 28.0 16.2 25.2 - -
646.0 465.3 511.4 471.6 450.3
Total International 905.3 713.8 770.1 521.1 516.3
Consolidated subsidiaries - continuing ops 2,977.8 2,866.5 2,833.8 2,524.2 2,332.9
Colombia - minority interest (5.0) (4.8) (5.8) (6.2) (8.3)
Russia - Oxy net interest ² - - 33.0 47.5 49.2
Yemen - Oxy net interest 4.0 2.9 2.9 3.0 2.2
Other Interests (1.0) (1.9) 30.1 44.3 43.1
¹ Gas volumes converted at 6,000 cubic feet per barrel of oil.
² Russia was sold in January 2007
Segment Total Year-End Assets
2008 2007 2006 2005 2004
Oil and Gas 28,522 23,421 21,923 14,834 12,015
Chemical 3,457 3,814 3,801 3,872 3,498
Midstream, marketing and other 6,424 6,589 3,845 3,775 2,744
Corporate (a) 3,134 2,695 2,862 3,689 3,183
Total 41,537 36,519 32,431 26,170 21,440
(a) Corporate included investments in Premcor, for the years 2003 - 2004 (sold in 2005), and Lyondell
for the years 2003 - 2006 (sold 11 million shares in 2005, 10 million shares in 2006 and the remainder in 2007),
and interest in the Joslyn Oil Sands (2008)