Tmd Evening Edition12142008
•
0 likes•131 views

The market detective is a Chartered Market Technician (CMT). He uses technical analysis to identify market turning points and opportunities. He is primarily an Elliottician, he uses the Elliott wave principle and Fibonacci ratio analysis to uncover clues about the direction of the market. He uses other forms of technical analysis to corroborate his findings in such a way as to assign a probability factor to them.

Recommended
More Related Content
Recently uploaded
Recently uploaded (20)
Featured
Featured (20)
Tmd Evening Edition12142008
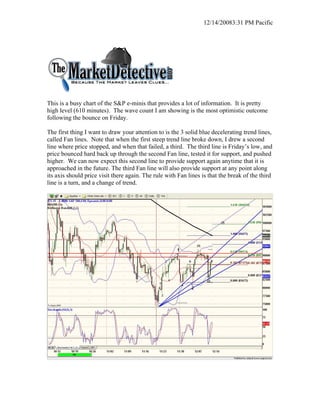
- 1. 12/14/20083:31 PM Pacific This is a busy chart of the S&P e-minis that provides a lot of information. It is pretty high level (610 minutes). The wave count I am showing is the most optimistic outcome following the bounce on Friday. The first thing I want to draw your attention to is the 3 solid blue decelerating trend lines, called Fan lines. Note that when the first steep trend line broke down, I drew a second line where price stopped, and when that failed, a third. The third line is Friday’s low, and price bounced hard back up through the second Fan line, tested it for support, and pushed higher. We can now expect this second line to provide support again anytime that it is approached in the future. The third Fan line will also provide support at any point along its axis should price visit there again. The rule with Fan lines is that the break of the third line is a turn, and a change of trend.
- 2. 12/14/20083:31 PM Pacific The next line overhead is the original steep trend line off the low. It happens to coincide with the high of wave 1 and a .618 extension of wave (1) up from 2. I have highlighted it in red, along with another strong resistance confluence directly above it. This is a formidable resistance zone over head that goes all the way back to October. Getting through this red zone will be very promising for higher prices. Once through it, the next powerful resistance level isn’t until 960, a 1:1 ratio Fibonacci extension of wave 1. The light blue trend line over head lines up with the second Fan line to form an Elliott channel. It is common for longer term wave counts to play with waves 1 and 3 occurring at the top of the channel and waves 2 and 4 at the bottom. Also notice how future Fibonacci levels have the potential to interact with probable intersections along the Fan lines in both directions. These intersections are powerful support and resistance levels. It is a tapestry of price and time. TMD/DW The market detective provides personal market opinion based on sound technical analysis and research. However, no warranty is given or implied as to its true reliability. The market detective will make errors and mistakes. The market detective is not an investment adviser and is not making recommendations to buy, sell, or place orders relating to the futures contracts, ETFs, or stocks that he writes about. The responsibility for decisions made from information contained in this service are solely that of the individual subscriber. The individual must fully research and make his/her own decisions before acting on any information provided by the market detective. The market detective assumes no responsibility for subscriber investment or trading results.