SlideShare a Scribd company logo
1 of 12
Download to read offline
Fonterra Co-operative Group Limited
                      Results for announcement to the market

Reporting Period              Six months to 31 January 2009
Previous Reporting Period     Six months to 30 November 2007

                              Amount (NZD millions)         Percentage change
Revenue from sale of          $NZ 8,035                     9.6%
goods
Profit (loss) from ordinary   $NIL                          0%
activities after tax
attributable to shareholder
suppliers
Net profit (loss)             $NIL                          0%
attributable to shareholder
suppliers

Interim/Final Dividend        Amount per security           Imputed amount per
                                                            security
                              N/A                           N/A

Record Date                   Not Applicable
Dividend Payment Date         Not Applicable

Comments:            A         As a co-operative, Fonterra distributes its surplus after
                              retentions to shareholders by way of pay out to
                              suppliers.

To be followed by the balance of the information required in the report pursuant to
Appendix 1
PRELIMINARY HALF YEAR REPORT ANNOUNCEMENT                                                                                                                    Appendix 1 (Rule 10.4)
                                                                                                                                                                                                 Preliminary Half Year Report
                                                                Fonterra Co-operative Group Limited
                                                                             (Name of Listed Issuer)
                                                                                 31 January 2009
                For Current Half Year Ended
                                                                                 31 November 2007
                Previous Corresponding Half Year Ended

Preliminary Half Year Report on consolidated results (including the results for the previous corresponding
half year) in accordance with Listing Rule 10.4.2.
This report has been prepared in a manner which complies with generally accepted accounting practice and gives a true
and fair view of the matters to which the report relates and is based on unaudited financial statements which will be
approved by the Board of Directors.

The Listed Issuer has a formally constituted Audit Committee of the Board of Directors.

                                                                                                                                                  Consolidated
                                                                                                                                                Income Statement
                                                                                                                                                                            Previous
                                                                                                                         Current                   *Up/(Down)             corresponding
    1     CONSOLIDATED INCOME STATEMENT
                                                                                                                        Half Year                      %                    Half Year
                                                                                                                       $NZ millions                                       $NZ millions

          REVENUE FROM SALE OF GOODS
   1.1                                                                                                                              8,035                         9.6%                7,334
   1.2    COST OF GOODS SOLD                                                                                                       (6,958)                        8.3%              (6,427)
   1.3    OTHER OPERATING INCOME                                                                                                        56                       80.6%                   31
   1.4    OPERATING EXPENSE EXCLUDING FINANCE COSTS AND NET
                                                                                                                                     (951)                       13.5%                (838)
          FOREIGN EXCHANGE GAINS / (LOSSES)
          (a) Selling and marketing expenses                                                                                         (266)                       20.9%                (220)
          (b) Distribution expenses                                                                                                  (223)                       16.1%                (192)
          (c) Administrative expenses                                                                                                (312)                       (2.8%)               (321)
          (d) Other operating expenses                                                                                               (150)                       42.9%                (105)
   1.5    NET FOREIGN EXCHANGE GAINS / (LOSSES)                                                                                        147                    (1570.0%)                (10)
   1.6    NET FINANCE COSTS                                                                                                          (368)                       128.6%               (161)
          (a) Finance income                                                                                                            57                       128.0%                  25
          (b) Finance cost                                                                                                           (425)                       128.5%               (186)
   1.7    SHARE OF PROFIT OF EQUITY ACCOUNTED INVESTEES                                                                                  69                      (4.2%)                    72
   1.8    IMPAIRMENT OF EQUITY ACCOUNTED INVESTEES                                                                                     (62)                    1966.7%                     (3)
          PROFIT / (LOSS) BEFORE TAXATION
   1.9                                                                                                                                 (32)                    1500.0%                     (2)
          (a) Taxation credit / (expense)                                                                                                31                       10.7%                    28
  1.10    PROFIT FOR THE PERIOD                                                                                                         (1)                    (103.8%)                     26
          (a) Profit attributable to Minority interests                                                                                   1                    (103.8%)                   (26)
  1.11    PROFIT AFTER TAXATION AND MINORITY INTERESTS
                                                                                                                                       NIL                                                NIL
          ATTRIBUTABLE TO SHAREHOLDER SUPPLIERS

Where a change in the presentational format of the financial statements has been made during the period, comparative figures have been restated accordingly


                                                                                          January 2009
                                                                                                                                                                                                                 Page 1 of 5
Consolidated Statement
                                                                                                                                                                             Appendix 1 (Rule 10.4)
                                                                                                                       of Total Recognised                             Preliminary Half Year Report
                                                                                                                       Income and Expenses
          STATEMENT OF TOTAL RECOGNISED INCOME AND EXPENSES                                                                 Previous               Previous
2
                                                                                                    Current               corresponding          corresponding
                                                                                                   Half Year                Full Year              Half Year
                                                                                                  $NZ millions            $NZ millions           $NZ millions


    2.1         Cash flow hedges:
          (a)   Net fair value gains                                                                       (1,665)                      354                    402
          (b)   Transferred and reported in revenue                                                            764                    (717)                  (199)
          (c)   Transferred to goodwill                                                                        NIL                       24                    NIL
          (d)   Tax on cash flow hedge transactions                                                            164                      102                   (61)
          (e)   Effect of tax rate change on cash flow hedge reserve                                          NIL                      NIL                    NIL
    2.2       Net investment hedges
          (a) Net fair value gains/(losses)                                                                  (230)                    (178)                        2
          (b) Tax on net fair value gains/(losses)                                                              41                       54                      NIL
    2.3       Foreign currency movements
          (a) Foreign currency translation attributable to shareholder suppliers                                 335                      162                (18)
          (b) Foreign currency translation reserve transferred to profit/(loss)                                   20                       (1)               NIL
          (c) Foreign currency translation attributable to minority interests                                     19                       12                 (4)
    2.4         Share of equity accounted investees reserve movements                                          (4)                       (1)                 NIL
    2.5         Income and expense recognised directly in equity                                             (556)                    (189)                   122
    2.6         Profit/(loss) for the period (before value return)                                             (1)                      294                    26
    2.7         Total recognised income and expense for the period                                           (557)                     105                   148

          ENTITIES OVER WHICH CONTROL HAS BEEN GAINED
3
             There have been no material entities acquired during the period.

          ENTITIES OVER WHICH CONTROL HAS BEEN DISPOSED OF
4
             There have been no material entities disposed of during the period.

          REPORTS FOR INDUSTRY SEGMENTS
5
             Refer to Attachment 1


                                                                                   January 2009
                                                                                                                                                                                       Page 2 of 5
Consolidated Balance Sheet
                                                                                                                                                                                                 Appendix 1 (Rule 10.4)
                                                                                                                         At end of            At end of previous    At end of previous
                                                                                                                                                                                           Preliminary Half Year Report
                                                                                                                          Current                 Full Year             Half Year
                                                                                                                                                $NZ millions          $NZ millions
                                                                                                                         Half Year
    6           CONSOLIDATED BALANCE SHEET
                                                                                                                       $NZ millions
   6.1    CURRENT ASSETS
          (a) Cash and cash equivalents*                                                                                                751                       681                974
          (b) Trade and other receivables                                                                                             2,581                     2,216              2,452
          (c) Inventories                                                                                                             5,095                     3,288              4,037
          (d) Taxation receivable                                                                                                        51                        31                 49
          (e) Derivative financial instruments                                                                                          538                       183                520
          (f) Other current assets                                                                                                       54                        58                 92
              TOTAL CURRENT ASSETS                                                                                                    9,070                     6,457              8,124
   6.2    NON-CURRENT ASSETS
          (a) Property, plant and equipment                                                                                           4,446                     4,292              4,291
          (b) Equity accounted investments                                                                                              629                       592                666
          (c) Intangible assets                                                                                                       2,847                     2,680              2,491
          (d) Deferred tax asset                                                                                                        183                       139                 39
          (e) Derivative financial instruments                                                                                          596                       103                329
          (f) Other non-current assets                                                                                                  189                       176                164
             TOTAL NON-CURRENT ASSETS                                                                                                 8,890                     7,982              7,980
   6.3    TOTAL ASSETS                                                                                                               17,960                    14,439             16,104

   6.4    CURRENT LIABILITIES
          (a) Bank overdraft*                                                                                                            79                        67                 17
          (b) Borrowings*                                                                                                             1,890                     2,016              2,391
          (c) Trade and other payables                                                                                                1,324                     1,271              1,168
          (d) Owing to suppliers                                                                                                      1,806                     1,069              2,726
          (e) Taxation payable                                                                                                           42                        55                 60
          (f) Derivative financial instruments                                                                                        2,103                       348                115
          (g) Provisions                                                                                                                129                       233                102
          (h) Other current liabilities                                                                                                  14                        12                  8
              TOTAL CURRENT LIABILITIES                                                                                               7,387                     5,071              6,587
   6.5    NON-CURRENT LIABILITIES
          (a) Borrowings*                                                                                                             6,209                     4,502              3,580
          (b) Capital notes*                                                                                                             35                        35                 35
          (c) Derivative financial instruments                                                                                          386                       155                258
          (d) Provisions                                                                                                                 77                        64                 45
          (e) Deferred tax liability                                                                                                     41                       288                547
          (f)   Other non-current liabilities                                                                                            35                        55                 56
             TOTAL NON-CURRENT LIABILITIES                                                                                            6,783                     5,099              4,521
   6.6    TOTAL LIABILITIES                                                                                                          14,170                    10,170             11,108

   6.7    EQUITY
          (a) Co-operative shares                                                                                                     4,392                     4,297              4,769
          (b) Retained earnings                                                                                                          14                        18              (166)
          (c) Foreign currency translation reserve                                                                                      165                        (1)              (54)
          (d) Cash flow hedge reserve                                                                                                 (825)                      (88)                291

          TOTAL EQUITY ATTRIBUTABLE TO SHAREHOLDER SUPPLIERS                                                                          3,746                     4,226              4,840
   6.8

                                                                                                                                         44                        43                156
          MINORITY INTERESTS
  6.9
          TOTAL EQUITY
  6.10                                                                                                                                3,790                     4,269              4,996

  6.11    TOTAL LIABILITIES AND EQUITY                                                                                               17,960                    14,439             16,104

  6.12    OTHER INFORMATION
          (a) Debt to Equity Ratio (%) (Total Liabilities divided by
              Equity)                                                                                                            373.88%                      238.23%           222.34%
          (b) Total number of co-operative shares (millions)                                                                        1,217                        1,200             1,261
                                                                                                                                     1.89                         1.51              1.61
          (c) Net tangible assets per security
                                                                                                                                      N/A                          N/A               N/A
          (d) Earnings per security

* Refer to Attachment 2 for detailed note on Loans and Borrowings
Where a change in the presentational format of the financial statements has been made during the period, comparative figures have been restated accordingly


                                                                                          January 2009
                                                                                                                                                                                                           Page 3 of 5
Consolidated Cash Flow
                                                                                                                                                                              Appendix 1 (Rule 10.4)
                                                                                                                                      Statement
                                                                                                                                                                        Preliminary Half Year Report
                                                                                                                           Current               Corresponding
                                                                                                                          Half Year                Half Year
7     CASH FLOWS RELATING TO OPERATING ACTIVITIES
                                                                                                                         $NZ millions            $NZ millions
7.1   CASH FLOWS FROM OPERATING ACTIVITIES
      (a) Cash inflows                                                                                                                8,922                  7,001
      (b) Cash outflows                                                                                                             (8,811)                (6,183)
           NET CASH FLOWS FROM OPERATING ACTIVITIES                                                                                       111                    818

7.2   CASH FLOWS FROM INVESTING ACTIVITIES
      (a) Cash inflows                                                                                                                      95                 19
      (b) Cash outflows                                                                                                                  (554)              (286)
          NET CASH FLOWS FROM INVESTING ACTIVITIES                                                                                       (459)              (267)

7.3   CASH FLOWS FROM FINANCING ACTIVITIES
      (a) Cash inflows                                                                                                                2,458                  3,471
      (b) Cash outflows                                                                                                             (2,117)                (3,180)
           NET CASH FLOWS FROM FINANCINF ACTIVITIES                                                                                       341                    291

7.4   NET INCREASE IN CASH AND CASH EQUIVALENTS                                                                                            (7)               842
      (a) Cash and cash equivalents at the beginning of the period                                                                        614                115
      (b) Effect of exchange rate changes on cash balances                                                                                 65                NIL
           CASH AND CASH EQUIVALENTS AT THE END OF THE PERIOD                                                                             672                    957

7.5   RECONCILIATION OF CLOSING BANK BALANCE TO THE BALANCE SHEET
      (a) Cash and cash equivalents                                                                                                       751                    974
      (b) Bank overdraft                                                                                                                  (79)                   (17)
          CLOSING CASH BALANCES                                                                                                           672                    957

7.6   RECONCILIATION OF PROFIT/(LOSS) FOR THE PERIOD TO NET CASH FLOWS
      FROM OPERATING ACTIVITIES
         PROFIT/(LOSS) FOR THE PERIOD                                                                                                      (1)                    26

          ADJUSTMENT FOR NON-CASH ITEMS
      (a) Depreciation / amortisation                                                                                                      234                   231
      (b) Other non-cash items                                                                                                           (291)                   (97)

      (c) Movements in working capital                                                                                                   (113)                   141

      (d) Items classified as investing and financing activities                                                                          282                    517
           NET CASH FLOWS FROM OPERATING ACTIVITIES                                                                                       111                    818

8     NON-CASH FINANCING AND INVESTING ACTIVITIES
      Provide details of financing and investing transactions which have had a material effect on group assets and
      and liabilities but did not involve cash flows:


           There were no material non cash financing and investing transactions for the Group for the six months ended 31 January 2009


                                                                              January 2009
                                                                                                                                                                                        Page 4 of 5
EQUITY ACCOUNTED INVESTMENTS IN ASSOCIATES
9
                                                                                                                                                                            Appendix 1 (Rule 10.4)
                                                                                                                                                                      Preliminary Half Year Report
     MATERIAL INTERESTS IN CORPORATIONS NOT BEING SUBSIDIARIES
     (a) The Group has a material (from Group's viewpoint) interest in the following corporations:

                                                                                    Percentage of ordinary                          Contribution to net
                                                                                     shares held at end of                           surplus (deficit)
                                   Name
                                                                                          Half Year                                      after tax
                                                                                                         Previous                                      Previous
          Equity Accounted
                                                                              Current                  Corresponding         Current               Corresponding
          Associates
                                                                             Half Year                   Half Year          Half Year                Half Year
                                                                                                                           $NZ millions            $NZ millions
                                                                                                                               Equity Accounted in current year
          DairiConcepts Management, LLC                                        50.0%                      50.0%
          AFF P/S                                                              25.0%                      25.0%
          Dairy Industries (Jamaica) Ltd                                       50.0%                      50.0%
          Corporation Inlaca C.A.                                              25.0%                      25.0%               Earnings                 Earnings
          DPA Manufacturing Holdings Ltd                                       50.0%                      50.0%                 $69                       $72
          Dairy Partners Americas Brasil Limitada                              50.0%                      50.0%              Impairment               Impairment
          Dairy Partners Americas Argentina S.A.                               50.0%                      50.0%                ($62)                      ($3)
          Dairy Partners Americas del Ecuador S.A.                             50.0%                      50.0%           Net Contribution         Net Contribution
          DMV Fonterra Excipients GmBH & Co KG                                 50.0%                      50.0%                  $7                       $69
          Britannia New Zealand Foods PVTE Limited                             49.0%                      49.0%
          Shijiazhuang San Lu Group Company Limited                            43.0%                      43.0%
          RD1 Limited                                                          50.0%                      50.0%

     (b) In August 2008, Fonterra became aware that certain milk products manufactured in China had been contaminated. This included
           products sold by Shijiazhuang San Lu Group Company Limited (quot;San Luquot;), a company in which Fonterra has a 43% interest. As a result
           of issues associated with the contamination, Fonterra recognised an impairment charge, for the 14 months ended 31 July 2008, of
           $139 million against the carrying value of the investment in San Lu.
           The remaining investment in San Lu of NZD 62 million has been written down to zero in the six month period ended 31 January 2009.
     OTHER INFORMATION
10
     If no report in any section, state NIL. If insufficient space below, provide details in the form of notes to be attached
     to this report.
     (a) Material factors affecting the revenues and expenses of the Group for the current half year
         Refer to Attachment 3

     (b) Significant trends or events since end of current half year
         On 10 March 2009 Fonterra Co-operative Group Limited issued $800 million of six year unsecured fixed rate bonds. There were no
         other material events subsequent to 31 January 2009 that would materially impact these financial statements.

     (c) Management's discussion and analysis of financial condition, result and/or operations
         Refer to attachment 3

     (d) Significant Accounting Policies
           Fonterra Co-operative Group Limited (“Fonterra” or the “Company”) is a co-operative company incorporated and
           domiciled in New Zealand. Fonterra is registered under the Companies Act 1993, and the Co-operative Companies
           Act 1996, and is an issuer for the purpose of the Financial Reporting Act.

           The consolidated interim financial statements of Fonterra, as at and for the six months ended 31 January 2009,
           comprise Fonterra and its subsidiaries (together referred to as the “Group”) and the Group’s equity accounted
           investees.

           The consolidated interim financial statements comply with New Zealand Generally Accepted Accounting
           Practice (“NZ GAAP”) and have been prepared in accordance with New Zealand Equivalent to International
           Accounting Standard (“NZ IAS”) 34: Interim Financial Reporting. The consolidated interim financial statements
           also comply with International International Accounting Standard (“IAS”) 34: Interim Financial Reporting.
           The consolidated interim financial statements should be read in conjunction with the financial statements for the
           14 months ended 31 July 2008.

           The accounting policies used are consistent with those used to prepare the financial statements for the 14 months
            ended 31 July 2008 and the half year report for the six months ended 30 November 2007. There have been no
           changes in accounting policy during the interim period.

           Due to the seasonal nature of Fonterra’s business, the final Milk Price can only be calculated at the end of the
           financial year. For the purpose of the consolidated interim financial statements it is assumed that 100% of profit
            attributable to shareholder suppliers for the six months to 31 January 2009 will be paid out as Payout to shareholder
           suppliers. At year end the Payout to shareholder suppliers is based on the amount declared by the Directors.

           The consolidated interim financial statements are presented in New Zealand dollars (“$”), which is the Company’s
           functional and presentation currency, and rounded to the nearest million.

           The Group is primarily involved in the collection, manufacture and sale of milk and milk derived products and is a
           profit oriented entity.


                                                                             January 2009
                                                                                                                                                                                      Page 5 of 5
Attachment 1
Fonterra Co-operative Group Limited
For the six months ended 31 January 2009

5)      SEGMENT REPORTING

The Group has four reportable segments that are defined by product type and
geographic area to reflect how the Group’s operations are managed.
The Commodities & Ingredients segment includes the manufacturing business in
New Zealand together with the integrated offshore supply chain, manufacturing
operations and specialty ingredients business. Commodities & Ingredients generates
its revenue primarily from ingredient milk products. All other reportable segments
generate their revenue primarily from consumer products and exclude any part of the
Group’s operations that is included within Commodities & Ingredients.
Transactions between segments are based on estimated market prices.
Reportable segment         Description
Commodities &              Includes New Zealand Milk Supply, New Zealand
Ingredients                Manufacturing, Sales and Operations Planning, Global
                           Trade, Global Supply Chain, Fonterra Ingredients and
                           Specialty Ingredients operations in North Asia, North
                           America and Europe (including equity accounted
                           investments), and Corporate.
ANZ                        Represents operations in New Zealand (other than those
                           included in Commodities & Ingredients) and Australia
                           (including Milk Supply and Manufacturing).
Asia / AME                 Represents operations and equity accounted investments in
                           Asia (excluding North Asia), Africa and the Middle East.
Latam                      Represents operations and equity accounted investments in
                           South America.


                         Commodities &     ANZ        Asia /     Latam      Eliminations   Total
$ million                 Ingredients                 AME                                  Group
  Segment revenue and assets
  For the six months ended and as at 31 January 2009 (unaudited)

External revenue                 4,965      1,504      1,208         358               -        8,035
                                   923        461         40          37         (1,461)            -
Inter-segment revenue
                                 5,888      1,965      1,248         395         (1,461)        8,035
Total revenue

                                12,121      3,876      1,629        1,020          (686)       17,960
Total assets

  For the six months ended and as at 30 November 2007 (unaudited)

External revenue                 4,880      1,345        788         321               -        7,334
                                   767        236         24          23         (1,050)            -
Inter-segment revenue
                                 5,647      1,581        812         344         (1,050)        7,334
Total revenue

                                11,217      3,610      1,382         674           (779)       16,104
Total assets


                                                                                           i
Attachment 1
Fonterra Co-operative Group Limited
For the six months ended 31 January 2009


Segment reporting (continued)

                        Commodities       ANZ        Asia /            Latam       Eliminations   Total
$ million                     &                      AME                                          Group
                         Ingredients
  Segment revenue and assets
  For the 14 months ended and as at 31 July 2008 (audited)

External revenue                     13,517     3,302      1,904          789                 -        19,512
                                      2,009       696         84           53           (2,842)             -
Inter-segment revenue
                                     15,526     3,998      1,988          842           (2,842)        19,512
Total revenue

                                      9,061     3,737      1,374          892             (625)        14,439
Total assets


To complete segmental profit analysis for the Group, it is necessary to calculate Milk
Price. Due to the seasonal nature of Fonterra’s business, the final Milk Price can
only be calculated at the end of the financial year. Accordingly, segmental profit
analysis is not prepared for the half year reporting periods, and is only presented for
the 14 months ended 31 July 2008.

                                Commodities    ANZ       Asia /        Latam       Eliminations   Total
$ million                             &                  AME                                      Group
                                 Ingredients
  Segment profit
  For the 14 months ended and as at 31 July 2008 (audited)
Segment operating profit
before depreciation,
amortisation and non-
recurring items                  824          266             96          119              (36)         1,269
Depreciation                   (362)         (75)             (8)         (20)                -         (465)
Amortisation                     (78)          (1)            (1)          (1)                -           (81)
Share of royalty income             2            1              -           17                -             20
Non-recurring items            (156)           12             (1)            -                -         (145)

Segment profit before
finance costs, equity
accounted income and tax               230       203              86      115              (36)           598
Share of profit of equity
accounted investees                    137           -             7       14                 -           158
Impairment of equity
                                          -          -      (142)              -              -         (142)
accounted investees

Segment profit before
finance costs and tax                  367       203         (49)         129              (36)           614
Unallocated finance income                                                                                 76
Unallocated finance costs                                                                               (443)
Unallocated tax income                                                                                     47

Profit for the period (before
Value Return)                                                                                             294


                                                                                                  ii
Attachment 2
Fonterra Co-operative Group Limited
For the six months ended 31 January 2009

6)       LOANS AND BORROWINGS

                                                                               6 months to         14 months to
                                                                6 months to
                                                                               30 Nov 2007         31 July 2008
                                                                31 Jan 2009
                                                                                Unaudited            Audited
$ million                                                        Unaudited

                                                                                      5,160               5,160
Balance at beginning of period                                         6,553
New issues
                                                                                         58                 627
Loans drawn                                                              898
                                                                                          -                   -
New finance leases                                                        22
                                                                                      2,061               4,958
Commercial paper issued                                                  729
                                                                                          -                 445
Medium term notes issued                                                 668
                                                                                      2,119               6,030
                                                                       2,317
Repayments
                                                                                      (525)                (916)
Bank lending                                                            (17)
                                                                                       (17)                (126)
Finance leasing                                                         (23)
                                                                                      (804)              (4,129)
Commercial paper matured                                             (1,776)
                                                                                        (3)                 (10)
Medium term notes matured                                               (57)
                                                                                    (1,349)              (5,181)
                                                                     (1,873)
Other movements
                                                                                         15                 105
Amortisation of debt                                                      37
                                                                                         41                  34
Changes in fair value                                                    168
                                                                                         20                 405
Changes due to foreign exchange                                          932
                                                                                         76                 544
                                                                       1,137

                                                                                      6,006               6,553
Balance at end of period                                               8,134

Represented by:
Current borrowings                                                                    2,391               2,016
                                                                       1,890
Non-current borrowings                                                                3,580               4,502
                                                                       6,209
Capital notes                                                                            35                  35
                                                                          35
                                                                                      6,006               6,553
                                                                       8,134

Net interest bearing debt position
Total borrowings                                                                      6,006               6,553
                                                                       8,134
Cash and cash equivalents                                                             (974)               (681)
                                                                       (751)
Long term interest bearing advances                                                     (79)                (79)
                                                                       (102)
Bank overdraft                                                                            17                  67
                                                                          79
Net interest bearing debt                                                             4,970               5,860
                                                                       7,360
Less carrying value of derivatives used to manage foreign
exchange movements on debt                                                              212                  70
                                                                       (561)
Net interest bearing debt after deducting derivatives used to
manage foreign exchange movements on debt                                             5,182               5,930
                                                                       6,799


The following table explains the impact of other movements in loans and borrowings on the
income statement:
 Total non-cash movement in loans and borrowings                                       76                    544
                                                                     1,137
 Less amount recognised directly in FCTR                                                8                  (141)
                                                                     (281)
 Less amount offset by derivatives used to manage foreign
 exchange movements on debt                                                          (69)                  (298)
                                                                     (782)
 Net pre-tax impact on profit or loss                                                  15                    105
                                                                        74

The amount recognised directly in FCTR relates to translation of subsidiary debt and debt that
has been designated as net investment hedges. The amount offset by the derivatives used to
manage foreign exchange movements on debt relates to both realised and unrealised
derivative contracts held throughout the period. The unrealised portion only remains on
balance sheet as at reporting date. Any realised portion will be offset as a repayment of
borrowings during the period.


                                                                                               i
Attachment 3
Fonterra Co-operative Group Limited
For the six months ended 31 January 2009

10a/c) Media Release


                                                          i
Media Release
24 March 2009
                    FONTERRA ANNOUNCES SOLID HALF YEAR FINANCIAL RESULT
              Financial performance driven by seasonal factors, stronger contribution from regional
              consumer businesses and the lower Kiwi dollar
              Payout forecast for season unchanged at $5.10 per kgMS

Fonterra Co-operative Group announced today its financial results for the six months to January 31, 2009.
Because of a change to the annual balance date last year, the result is affected by seasonal factors. The
latest half year covers the period August 2008 to January 2009 and includes two additional high production
months (December and January), distorting comparisons with the previous half year which went from June
2007 to November 2007.

Highlights of the half-year result include:
•   Revenue was up 9.6% to $8.0 billion. The higher revenue was driven by the inclusion of two high sales
    months due to the change in balance date, stronger contributions from Fonterra’s regional consumer
    businesses, and the lower Kiwi dollar - offset by lower global dairy prices.
    - Commodities & Ingredients revenue up 2% to $5.0 billion.
    - Australia/New Zealand revenue up 12% to $1.5 billion.
    - Asia/Africa Middle East revenue up 53% to $1.2 billion.
    - Latin America revenue up 12% to $358 million.
    Adjusting for timing factors and including exchange hedging, total revenues would have been down by
    7.6%, reflecting the lower international dairy commodity prices.
•   Operating expenses as reported were up 13%. Adjusting for seasonal and currency factors, operating
    expenses would have been down by 2%.
•   Debt gearing at January 31, 2009 was 61.5%, compared with 57.4% at July 31, 2008. The increase
    primarily reflects:
    - The cost of carrying higher inventories over the season’s peak;
    - The devaluation of the New Zealand dollar which resulted in foreign currency debt increasing when
        converted to NZD. Although the Group has an offsetting hedge on the foreign debt, this hedge is
        recognised in the accounts as an asset and not as a reduction in debt;
    - And the higher-than-usual advance rate percentage Fonterra has been paying farmer-shareholders
        this season, which resulted in more than $700 million extra in payments to farmers over and above
        the normal payment schedule.
•   Debt gearing is expected to reduce to more normal levels by year-end as working capital requirements
    ease due to the normal seasonal cycle and with other initiatives such as a freeze on non-essential
    capital expenditure. Additionally, the requirement announced last October that farmers must bring their
    shareholdings fully in line with this season’s milk production is expected to bring in around $400 million
    of additional equity by the end of the financial year offsetting forecast share redemptions.
•   By paying back short term loans and taking out longer term borrowings, average debt maturity has
    increased, putting the Co-operative in a stronger position to face uncertain times in financial markets. As
    at January 31, the weighted average length of borrowings was 4.1 years - up from 3.3 years at July 31,
    2008. As at March 31, Fonterra’s successful retail bond issue in New Zealand has extended the
    company’s average maturity to 4.7 years.
•   The payout forecast for the 2008/09 season is unchanged from the revised forecast of $5.10 per
    kilogram of milksolids (kgMS) announced in late January. This would be Fonterra’s third highest payout.

Chairman Henry van der Heyden said the interim result was satisfactory given the global economic meltdown
and its impact on dairy markets. “Despite this climate, our payout is still forecast to be $5.10, and our result
shows Fonterra to be in reasonable shape given the turmoil in the world economy - it’s a tough time for
everyone and Fonterra is no exception. We have taken, and will continue to take, the tough decisions to
manage the business prudently in the current climate and get our farmers the highest payout.”

- ENDS -

For further information contact:
Fonterra Communications
Phone: +64 21 507 072

About Fonterra
     Fonterra is the world’s largest dairy exporter, with annual revenues of about NZ$17 billion*.
     As New Zealand’s largest and truly multinational business, Fonterra trades in 140 countries.
     Our portfolio includes dairy ingredients, liquid and powdered milks, cultured foods and yoghurts, butter, cheese and specialty
     foodservices products.
     Our brands include Anchor, Anlene, Anmum, Fresh n’ Fruity, Mainland, Peters, Brownes, Tip Top, and Chesdale.
* Fonterra reported revenues of NZ$19.5 billion for 14 months ended 31 July 2008.

If this material is not relevant to your purpose, you may wish to prevent further deliveries via email. To opt-out, please click this link.

More Related Content

What's hot

11q4 sonypre
11q4 sonypre11q4 sonypre
11q4 sonyprehkn1984
 
Ryder2Q2008report
Ryder2Q2008reportRyder2Q2008report
Ryder2Q2008reportfinance44
 
HXN2007Q2ConfCallFinal
HXN2007Q2ConfCallFinalHXN2007Q2ConfCallFinal
HXN2007Q2ConfCallFinalfinance36
 
LEAR Q 106 earnings
LEAR Q 106 earningsLEAR Q 106 earnings
LEAR Q 106 earningsfinance16
 
RYDERFINAL Q406presentation
RYDERFINAL Q406presentationRYDERFINAL Q406presentation
RYDERFINAL Q406presentationfinance44
 
arvinmeritor UBS_Debt_Conference_050907
arvinmeritor UBS_Debt_Conference_050907arvinmeritor UBS_Debt_Conference_050907
arvinmeritor UBS_Debt_Conference_050907finance27
 
atmos enerrgy _1qslides
atmos enerrgy _1qslidesatmos enerrgy _1qslides
atmos enerrgy _1qslidesfinance35
 
du pont Earnings Release
du pont Earnings Release du pont Earnings Release
du pont Earnings Release finance9
 
RYDERFINAL1Q06EarningsReport
RYDERFINAL1Q06EarningsReportRYDERFINAL1Q06EarningsReport
RYDERFINAL1Q06EarningsReportfinance44
 

What's hot (11)

11q4 sonypre
11q4 sonypre11q4 sonypre
11q4 sonypre
 
Q1 2009 Earning Report of Covanta Holdings
Q1 2009 Earning Report of Covanta HoldingsQ1 2009 Earning Report of Covanta Holdings
Q1 2009 Earning Report of Covanta Holdings
 
Ryder2Q2008report
Ryder2Q2008reportRyder2Q2008report
Ryder2Q2008report
 
HXN2007Q2ConfCallFinal
HXN2007Q2ConfCallFinalHXN2007Q2ConfCallFinal
HXN2007Q2ConfCallFinal
 
LEAR Q 106 earnings
LEAR Q 106 earningsLEAR Q 106 earnings
LEAR Q 106 earnings
 
RYDERFINAL Q406presentation
RYDERFINAL Q406presentationRYDERFINAL Q406presentation
RYDERFINAL Q406presentation
 
arvinmeritor UBS_Debt_Conference_050907
arvinmeritor UBS_Debt_Conference_050907arvinmeritor UBS_Debt_Conference_050907
arvinmeritor UBS_Debt_Conference_050907
 
atmos enerrgy _1qslides
atmos enerrgy _1qslidesatmos enerrgy _1qslides
atmos enerrgy _1qslides
 
3Q05FINAL
3Q05FINAL3Q05FINAL
3Q05FINAL
 
du pont Earnings Release
du pont Earnings Release du pont Earnings Release
du pont Earnings Release
 
RYDERFINAL1Q06EarningsReport
RYDERFINAL1Q06EarningsReportRYDERFINAL1Q06EarningsReport
RYDERFINAL1Q06EarningsReport
 

Similar to FONTERRA HALF YEAR REPORT

Generali Group first half results 2011
Generali Group first half results 2011Generali Group first half results 2011
Generali Group first half results 2011Generali
 
Release ifrs us 3 q11 final
Release ifrs us 3 q11 finalRelease ifrs us 3 q11 final
Release ifrs us 3 q11 finalEmbraer RI
 
NewRyderER1Q08FINAL
NewRyderER1Q08FINALNewRyderER1Q08FINAL
NewRyderER1Q08FINALfinance44
 
NewRyderER1Q08FINAL
NewRyderER1Q08FINALNewRyderER1Q08FINAL
NewRyderER1Q08FINALfinance44
 
Ryder2Q2008report
Ryder2Q2008reportRyder2Q2008report
Ryder2Q2008reportfinance44
 
Ryder2Q2008report
Ryder2Q2008reportRyder2Q2008report
Ryder2Q2008reportfinance44
 
shaw group 656631FE-D4E6-4F14-A3DB-B8C5E6B7BB07_1Q2009
shaw group 656631FE-D4E6-4F14-A3DB-B8C5E6B7BB07_1Q2009shaw group 656631FE-D4E6-4F14-A3DB-B8C5E6B7BB07_1Q2009
shaw group 656631FE-D4E6-4F14-A3DB-B8C5E6B7BB07_1Q2009finance36
 
shaw group 656631FE-D4E6-4F14-A3DB-B8C5E6B7BB07_1Q2009
shaw group 656631FE-D4E6-4F14-A3DB-B8C5E6B7BB07_1Q2009shaw group 656631FE-D4E6-4F14-A3DB-B8C5E6B7BB07_1Q2009
shaw group 656631FE-D4E6-4F14-A3DB-B8C5E6B7BB07_1Q2009finance36
 
TI FY 2009 - 2009 Results and the 2010-2012 Strategic Plan Update
TI FY 2009 - 2009 Results and the 2010-2012 Strategic Plan UpdateTI FY 2009 - 2009 Results and the 2010-2012 Strategic Plan Update
TI FY 2009 - 2009 Results and the 2010-2012 Strategic Plan UpdateGruppo TIM
 
Fourth Quarter 2010 Earnings Report
Fourth Quarter 2010 Earnings ReportFourth Quarter 2010 Earnings Report
Fourth Quarter 2010 Earnings ReportRyder System, Inc.
 
1 Q09 Earnings Eng Final[20090421134102809]
1 Q09 Earnings Eng Final[20090421134102809]1 Q09 Earnings Eng Final[20090421134102809]
1 Q09 Earnings Eng Final[20090421134102809]Sang Park
 
omnicom group Q1 2006 Investor Presentation
omnicom group  Q1 2006 Investor Presentationomnicom group  Q1 2006 Investor Presentation
omnicom group Q1 2006 Investor Presentationfinance22
 
Q1 2011 Ryder System, Inc. Earnings Report
Q1 2011 Ryder System, Inc. Earnings ReportQ1 2011 Ryder System, Inc. Earnings Report
Q1 2011 Ryder System, Inc. Earnings ReportRyder System, Inc.
 
Main 12M 2011 re‐presented figures IFRS 5
Main 12M 2011 re‐presented figures IFRS 5Main 12M 2011 re‐presented figures IFRS 5
Main 12M 2011 re‐presented figures IFRS 5ve-finance
 
Q2 2011 Ryder System, Inc. Earnings Report
Q2 2011 Ryder System, Inc. Earnings ReportQ2 2011 Ryder System, Inc. Earnings Report
Q2 2011 Ryder System, Inc. Earnings ReportRyder System, Inc.
 
Generali Group 1Q 2009 Results
Generali Group 1Q 2009 ResultsGenerali Group 1Q 2009 Results
Generali Group 1Q 2009 ResultsGenerali
 
progressive mreport-11/05
progressive mreport-11/05progressive mreport-11/05
progressive mreport-11/05finance18
 

Similar to FONTERRA HALF YEAR REPORT (20)

Generali Group first half results 2011
Generali Group first half results 2011Generali Group first half results 2011
Generali Group first half results 2011
 
Release ifrs us 3 q11 final
Release ifrs us 3 q11 finalRelease ifrs us 3 q11 final
Release ifrs us 3 q11 final
 
NewRyderER1Q08FINAL
NewRyderER1Q08FINALNewRyderER1Q08FINAL
NewRyderER1Q08FINAL
 
NewRyderER1Q08FINAL
NewRyderER1Q08FINALNewRyderER1Q08FINAL
NewRyderER1Q08FINAL
 
Ryder2Q2008report
Ryder2Q2008reportRyder2Q2008report
Ryder2Q2008report
 
Ryder2Q2008report
Ryder2Q2008reportRyder2Q2008report
Ryder2Q2008report
 
Q3 2011 Financial Highlights Presentaion Final
Q3 2011 Financial Highlights Presentaion FinalQ3 2011 Financial Highlights Presentaion Final
Q3 2011 Financial Highlights Presentaion Final
 
shaw group 656631FE-D4E6-4F14-A3DB-B8C5E6B7BB07_1Q2009
shaw group 656631FE-D4E6-4F14-A3DB-B8C5E6B7BB07_1Q2009shaw group 656631FE-D4E6-4F14-A3DB-B8C5E6B7BB07_1Q2009
shaw group 656631FE-D4E6-4F14-A3DB-B8C5E6B7BB07_1Q2009
 
shaw group 656631FE-D4E6-4F14-A3DB-B8C5E6B7BB07_1Q2009
shaw group 656631FE-D4E6-4F14-A3DB-B8C5E6B7BB07_1Q2009shaw group 656631FE-D4E6-4F14-A3DB-B8C5E6B7BB07_1Q2009
shaw group 656631FE-D4E6-4F14-A3DB-B8C5E6B7BB07_1Q2009
 
TI FY 2009 - 2009 Results and the 2010-2012 Strategic Plan Update
TI FY 2009 - 2009 Results and the 2010-2012 Strategic Plan UpdateTI FY 2009 - 2009 Results and the 2010-2012 Strategic Plan Update
TI FY 2009 - 2009 Results and the 2010-2012 Strategic Plan Update
 
Fourth Quarter 2010 Earnings Report
Fourth Quarter 2010 Earnings ReportFourth Quarter 2010 Earnings Report
Fourth Quarter 2010 Earnings Report
 
1 Q09 Earnings Eng Final[20090421134102809]
1 Q09 Earnings Eng Final[20090421134102809]1 Q09 Earnings Eng Final[20090421134102809]
1 Q09 Earnings Eng Final[20090421134102809]
 
omnicom group Q1 2006 Investor Presentation
omnicom group  Q1 2006 Investor Presentationomnicom group  Q1 2006 Investor Presentation
omnicom group Q1 2006 Investor Presentation
 
Q1 2011 Ryder System, Inc. Earnings Report
Q1 2011 Ryder System, Inc. Earnings ReportQ1 2011 Ryder System, Inc. Earnings Report
Q1 2011 Ryder System, Inc. Earnings Report
 
Main 12M 2011 re‐presented figures IFRS 5
Main 12M 2011 re‐presented figures IFRS 5Main 12M 2011 re‐presented figures IFRS 5
Main 12M 2011 re‐presented figures IFRS 5
 
.credit-suisse - Presentation
 .credit-suisse - Presentation .credit-suisse - Presentation
.credit-suisse - Presentation
 
Pirelli 1 H09 Financial Results
Pirelli 1 H09 Financial ResultsPirelli 1 H09 Financial Results
Pirelli 1 H09 Financial Results
 
Q2 2011 Ryder System, Inc. Earnings Report
Q2 2011 Ryder System, Inc. Earnings ReportQ2 2011 Ryder System, Inc. Earnings Report
Q2 2011 Ryder System, Inc. Earnings Report
 
Generali Group 1Q 2009 Results
Generali Group 1Q 2009 ResultsGenerali Group 1Q 2009 Results
Generali Group 1Q 2009 Results
 
progressive mreport-11/05
progressive mreport-11/05progressive mreport-11/05
progressive mreport-11/05
 

Recently uploaded

Call Girls In Panjim North Goa 9971646499 Genuine Service
Call Girls In Panjim North Goa 9971646499 Genuine ServiceCall Girls In Panjim North Goa 9971646499 Genuine Service
Call Girls In Panjim North Goa 9971646499 Genuine Serviceritikaroy0888
 
Vip Dewas Call Girls #9907093804 Contact Number Escorts Service Dewas
Vip Dewas Call Girls #9907093804 Contact Number Escorts Service DewasVip Dewas Call Girls #9907093804 Contact Number Escorts Service Dewas
Vip Dewas Call Girls #9907093804 Contact Number Escorts Service Dewasmakika9823
 
VIP Call Girl Jamshedpur Aashi 8250192130 Independent Escort Service Jamshedpur
VIP Call Girl Jamshedpur Aashi 8250192130 Independent Escort Service JamshedpurVIP Call Girl Jamshedpur Aashi 8250192130 Independent Escort Service Jamshedpur
VIP Call Girl Jamshedpur Aashi 8250192130 Independent Escort Service JamshedpurSuhani Kapoor
 
Catalogue ONG NUOC PPR DE NHAT .pdf
Catalogue ONG NUOC PPR DE NHAT      .pdfCatalogue ONG NUOC PPR DE NHAT      .pdf
Catalogue ONG NUOC PPR DE NHAT .pdfOrient Homes
 
Call Girls Navi Mumbai Just Call 9907093804 Top Class Call Girl Service Avail...
Call Girls Navi Mumbai Just Call 9907093804 Top Class Call Girl Service Avail...Call Girls Navi Mumbai Just Call 9907093804 Top Class Call Girl Service Avail...
Call Girls Navi Mumbai Just Call 9907093804 Top Class Call Girl Service Avail...Dipal Arora
 
Russian Faridabad Call Girls(Badarpur) : ☎ 8168257667, @4999
Russian Faridabad Call Girls(Badarpur) : ☎ 8168257667, @4999Russian Faridabad Call Girls(Badarpur) : ☎ 8168257667, @4999
Russian Faridabad Call Girls(Badarpur) : ☎ 8168257667, @4999Tina Ji
 
Vip Female Escorts Noida 9711199171 Greater Noida Escorts Service
Vip Female Escorts Noida 9711199171 Greater Noida Escorts ServiceVip Female Escorts Noida 9711199171 Greater Noida Escorts Service
Vip Female Escorts Noida 9711199171 Greater Noida Escorts Serviceankitnayak356677
 
VIP Call Girls Pune Kirti 8617697112 Independent Escort Service Pune
VIP Call Girls Pune Kirti 8617697112 Independent Escort Service PuneVIP Call Girls Pune Kirti 8617697112 Independent Escort Service Pune
VIP Call Girls Pune Kirti 8617697112 Independent Escort Service PuneCall girls in Ahmedabad High profile
 
rishikeshgirls.in- Rishikesh call girl.pdf
rishikeshgirls.in- Rishikesh call girl.pdfrishikeshgirls.in- Rishikesh call girl.pdf
rishikeshgirls.in- Rishikesh call girl.pdfmuskan1121w
 
Progress Report - Oracle Database Analyst Summit
Progress  Report - Oracle Database Analyst SummitProgress  Report - Oracle Database Analyst Summit
Progress Report - Oracle Database Analyst SummitHolger Mueller
 
Call Girls In Sikandarpur Gurgaon ❤️8860477959_Russian 100% Genuine Escorts I...
Call Girls In Sikandarpur Gurgaon ❤️8860477959_Russian 100% Genuine Escorts I...Call Girls In Sikandarpur Gurgaon ❤️8860477959_Russian 100% Genuine Escorts I...
Call Girls In Sikandarpur Gurgaon ❤️8860477959_Russian 100% Genuine Escorts I...lizamodels9
 
0183760ssssssssssssssssssssssssssss00101011 (27).pdf
0183760ssssssssssssssssssssssssssss00101011 (27).pdf0183760ssssssssssssssssssssssssssss00101011 (27).pdf
0183760ssssssssssssssssssssssssssss00101011 (27).pdfRenandantas16
 
Non Text Magic Studio Magic Design for Presentations L&P.pptx
Non Text Magic Studio Magic Design for Presentations L&P.pptxNon Text Magic Studio Magic Design for Presentations L&P.pptx
Non Text Magic Studio Magic Design for Presentations L&P.pptxAbhayThakur200703
 
Cash Payment 9602870969 Escort Service in Udaipur Call Girls
Cash Payment 9602870969 Escort Service in Udaipur Call GirlsCash Payment 9602870969 Escort Service in Udaipur Call Girls
Cash Payment 9602870969 Escort Service in Udaipur Call GirlsApsara Of India
 
Call Girls in Gomti Nagar - 7388211116 - With room Service
Call Girls in Gomti Nagar - 7388211116  - With room ServiceCall Girls in Gomti Nagar - 7388211116  - With room Service
Call Girls in Gomti Nagar - 7388211116 - With room Servicediscovermytutordmt
 
Insurers' journeys to build a mastery in the IoT usage
Insurers' journeys to build a mastery in the IoT usageInsurers' journeys to build a mastery in the IoT usage
Insurers' journeys to build a mastery in the IoT usageMatteo Carbone
 
Enhancing and Restoring Safety & Quality Cultures - Dave Litwiller - May 2024...
Enhancing and Restoring Safety & Quality Cultures - Dave Litwiller - May 2024...Enhancing and Restoring Safety & Quality Cultures - Dave Litwiller - May 2024...
Enhancing and Restoring Safety & Quality Cultures - Dave Litwiller - May 2024...Dave Litwiller
 
A DAY IN THE LIFE OF A SALESMAN / WOMAN
A DAY IN THE LIFE OF A  SALESMAN / WOMANA DAY IN THE LIFE OF A  SALESMAN / WOMAN
A DAY IN THE LIFE OF A SALESMAN / WOMANIlamathiKannappan
 
The CMO Survey - Highlights and Insights Report - Spring 2024
The CMO Survey - Highlights and Insights Report - Spring 2024The CMO Survey - Highlights and Insights Report - Spring 2024
The CMO Survey - Highlights and Insights Report - Spring 2024christinemoorman
 
Call Girls In Sikandarpur Gurgaon ❤️8860477959_Russian 100% Genuine Escorts I...
Call Girls In Sikandarpur Gurgaon ❤️8860477959_Russian 100% Genuine Escorts I...Call Girls In Sikandarpur Gurgaon ❤️8860477959_Russian 100% Genuine Escorts I...
Call Girls In Sikandarpur Gurgaon ❤️8860477959_Russian 100% Genuine Escorts I...lizamodels9
 

Recently uploaded (20)

Call Girls In Panjim North Goa 9971646499 Genuine Service
Call Girls In Panjim North Goa 9971646499 Genuine ServiceCall Girls In Panjim North Goa 9971646499 Genuine Service
Call Girls In Panjim North Goa 9971646499 Genuine Service
 
Vip Dewas Call Girls #9907093804 Contact Number Escorts Service Dewas
Vip Dewas Call Girls #9907093804 Contact Number Escorts Service DewasVip Dewas Call Girls #9907093804 Contact Number Escorts Service Dewas
Vip Dewas Call Girls #9907093804 Contact Number Escorts Service Dewas
 
VIP Call Girl Jamshedpur Aashi 8250192130 Independent Escort Service Jamshedpur
VIP Call Girl Jamshedpur Aashi 8250192130 Independent Escort Service JamshedpurVIP Call Girl Jamshedpur Aashi 8250192130 Independent Escort Service Jamshedpur
VIP Call Girl Jamshedpur Aashi 8250192130 Independent Escort Service Jamshedpur
 
Catalogue ONG NUOC PPR DE NHAT .pdf
Catalogue ONG NUOC PPR DE NHAT      .pdfCatalogue ONG NUOC PPR DE NHAT      .pdf
Catalogue ONG NUOC PPR DE NHAT .pdf
 
Call Girls Navi Mumbai Just Call 9907093804 Top Class Call Girl Service Avail...
Call Girls Navi Mumbai Just Call 9907093804 Top Class Call Girl Service Avail...Call Girls Navi Mumbai Just Call 9907093804 Top Class Call Girl Service Avail...
Call Girls Navi Mumbai Just Call 9907093804 Top Class Call Girl Service Avail...
 
Russian Faridabad Call Girls(Badarpur) : ☎ 8168257667, @4999
Russian Faridabad Call Girls(Badarpur) : ☎ 8168257667, @4999Russian Faridabad Call Girls(Badarpur) : ☎ 8168257667, @4999
Russian Faridabad Call Girls(Badarpur) : ☎ 8168257667, @4999
 
Vip Female Escorts Noida 9711199171 Greater Noida Escorts Service
Vip Female Escorts Noida 9711199171 Greater Noida Escorts ServiceVip Female Escorts Noida 9711199171 Greater Noida Escorts Service
Vip Female Escorts Noida 9711199171 Greater Noida Escorts Service
 
VIP Call Girls Pune Kirti 8617697112 Independent Escort Service Pune
VIP Call Girls Pune Kirti 8617697112 Independent Escort Service PuneVIP Call Girls Pune Kirti 8617697112 Independent Escort Service Pune
VIP Call Girls Pune Kirti 8617697112 Independent Escort Service Pune
 
rishikeshgirls.in- Rishikesh call girl.pdf
rishikeshgirls.in- Rishikesh call girl.pdfrishikeshgirls.in- Rishikesh call girl.pdf
rishikeshgirls.in- Rishikesh call girl.pdf
 
Progress Report - Oracle Database Analyst Summit
Progress  Report - Oracle Database Analyst SummitProgress  Report - Oracle Database Analyst Summit
Progress Report - Oracle Database Analyst Summit
 
Call Girls In Sikandarpur Gurgaon ❤️8860477959_Russian 100% Genuine Escorts I...
Call Girls In Sikandarpur Gurgaon ❤️8860477959_Russian 100% Genuine Escorts I...Call Girls In Sikandarpur Gurgaon ❤️8860477959_Russian 100% Genuine Escorts I...
Call Girls In Sikandarpur Gurgaon ❤️8860477959_Russian 100% Genuine Escorts I...
 
0183760ssssssssssssssssssssssssssss00101011 (27).pdf
0183760ssssssssssssssssssssssssssss00101011 (27).pdf0183760ssssssssssssssssssssssssssss00101011 (27).pdf
0183760ssssssssssssssssssssssssssss00101011 (27).pdf
 
Non Text Magic Studio Magic Design for Presentations L&P.pptx
Non Text Magic Studio Magic Design for Presentations L&P.pptxNon Text Magic Studio Magic Design for Presentations L&P.pptx
Non Text Magic Studio Magic Design for Presentations L&P.pptx
 
Cash Payment 9602870969 Escort Service in Udaipur Call Girls
Cash Payment 9602870969 Escort Service in Udaipur Call GirlsCash Payment 9602870969 Escort Service in Udaipur Call Girls
Cash Payment 9602870969 Escort Service in Udaipur Call Girls
 
Call Girls in Gomti Nagar - 7388211116 - With room Service
Call Girls in Gomti Nagar - 7388211116  - With room ServiceCall Girls in Gomti Nagar - 7388211116  - With room Service
Call Girls in Gomti Nagar - 7388211116 - With room Service
 
Insurers' journeys to build a mastery in the IoT usage
Insurers' journeys to build a mastery in the IoT usageInsurers' journeys to build a mastery in the IoT usage
Insurers' journeys to build a mastery in the IoT usage
 
Enhancing and Restoring Safety & Quality Cultures - Dave Litwiller - May 2024...
Enhancing and Restoring Safety & Quality Cultures - Dave Litwiller - May 2024...Enhancing and Restoring Safety & Quality Cultures - Dave Litwiller - May 2024...
Enhancing and Restoring Safety & Quality Cultures - Dave Litwiller - May 2024...
 
A DAY IN THE LIFE OF A SALESMAN / WOMAN
A DAY IN THE LIFE OF A  SALESMAN / WOMANA DAY IN THE LIFE OF A  SALESMAN / WOMAN
A DAY IN THE LIFE OF A SALESMAN / WOMAN
 
The CMO Survey - Highlights and Insights Report - Spring 2024
The CMO Survey - Highlights and Insights Report - Spring 2024The CMO Survey - Highlights and Insights Report - Spring 2024
The CMO Survey - Highlights and Insights Report - Spring 2024
 
Call Girls In Sikandarpur Gurgaon ❤️8860477959_Russian 100% Genuine Escorts I...
Call Girls In Sikandarpur Gurgaon ❤️8860477959_Russian 100% Genuine Escorts I...Call Girls In Sikandarpur Gurgaon ❤️8860477959_Russian 100% Genuine Escorts I...
Call Girls In Sikandarpur Gurgaon ❤️8860477959_Russian 100% Genuine Escorts I...
 

FONTERRA HALF YEAR REPORT

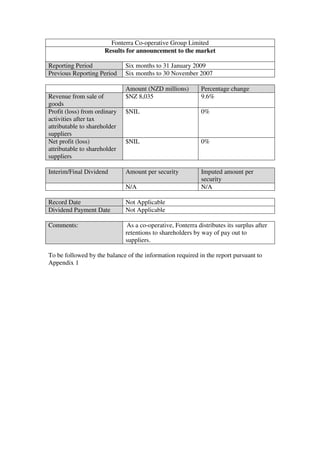
  • 1. Fonterra Co-operative Group Limited Results for announcement to the market Reporting Period Six months to 31 January 2009 Previous Reporting Period Six months to 30 November 2007 Amount (NZD millions) Percentage change Revenue from sale of $NZ 8,035 9.6% goods Profit (loss) from ordinary $NIL 0% activities after tax attributable to shareholder suppliers Net profit (loss) $NIL 0% attributable to shareholder suppliers Interim/Final Dividend Amount per security Imputed amount per security N/A N/A Record Date Not Applicable Dividend Payment Date Not Applicable Comments: A As a co-operative, Fonterra distributes its surplus after retentions to shareholders by way of pay out to suppliers. To be followed by the balance of the information required in the report pursuant to Appendix 1
  • 2. PRELIMINARY HALF YEAR REPORT ANNOUNCEMENT Appendix 1 (Rule 10.4) Preliminary Half Year Report Fonterra Co-operative Group Limited (Name of Listed Issuer) 31 January 2009 For Current Half Year Ended 31 November 2007 Previous Corresponding Half Year Ended Preliminary Half Year Report on consolidated results (including the results for the previous corresponding half year) in accordance with Listing Rule 10.4.2. This report has been prepared in a manner which complies with generally accepted accounting practice and gives a true and fair view of the matters to which the report relates and is based on unaudited financial statements which will be approved by the Board of Directors. The Listed Issuer has a formally constituted Audit Committee of the Board of Directors. Consolidated Income Statement Previous Current *Up/(Down) corresponding 1 CONSOLIDATED INCOME STATEMENT Half Year % Half Year $NZ millions $NZ millions REVENUE FROM SALE OF GOODS 1.1 8,035 9.6% 7,334 1.2 COST OF GOODS SOLD (6,958) 8.3% (6,427) 1.3 OTHER OPERATING INCOME 56 80.6% 31 1.4 OPERATING EXPENSE EXCLUDING FINANCE COSTS AND NET (951) 13.5% (838) FOREIGN EXCHANGE GAINS / (LOSSES) (a) Selling and marketing expenses (266) 20.9% (220) (b) Distribution expenses (223) 16.1% (192) (c) Administrative expenses (312) (2.8%) (321) (d) Other operating expenses (150) 42.9% (105) 1.5 NET FOREIGN EXCHANGE GAINS / (LOSSES) 147 (1570.0%) (10) 1.6 NET FINANCE COSTS (368) 128.6% (161) (a) Finance income 57 128.0% 25 (b) Finance cost (425) 128.5% (186) 1.7 SHARE OF PROFIT OF EQUITY ACCOUNTED INVESTEES 69 (4.2%) 72 1.8 IMPAIRMENT OF EQUITY ACCOUNTED INVESTEES (62) 1966.7% (3) PROFIT / (LOSS) BEFORE TAXATION 1.9 (32) 1500.0% (2) (a) Taxation credit / (expense) 31 10.7% 28 1.10 PROFIT FOR THE PERIOD (1) (103.8%) 26 (a) Profit attributable to Minority interests 1 (103.8%) (26) 1.11 PROFIT AFTER TAXATION AND MINORITY INTERESTS NIL NIL ATTRIBUTABLE TO SHAREHOLDER SUPPLIERS Where a change in the presentational format of the financial statements has been made during the period, comparative figures have been restated accordingly January 2009 Page 1 of 5
  • 3. Consolidated Statement Appendix 1 (Rule 10.4) of Total Recognised Preliminary Half Year Report Income and Expenses STATEMENT OF TOTAL RECOGNISED INCOME AND EXPENSES Previous Previous 2 Current corresponding corresponding Half Year Full Year Half Year $NZ millions $NZ millions $NZ millions 2.1 Cash flow hedges: (a) Net fair value gains (1,665) 354 402 (b) Transferred and reported in revenue 764 (717) (199) (c) Transferred to goodwill NIL 24 NIL (d) Tax on cash flow hedge transactions 164 102 (61) (e) Effect of tax rate change on cash flow hedge reserve NIL NIL NIL 2.2 Net investment hedges (a) Net fair value gains/(losses) (230) (178) 2 (b) Tax on net fair value gains/(losses) 41 54 NIL 2.3 Foreign currency movements (a) Foreign currency translation attributable to shareholder suppliers 335 162 (18) (b) Foreign currency translation reserve transferred to profit/(loss) 20 (1) NIL (c) Foreign currency translation attributable to minority interests 19 12 (4) 2.4 Share of equity accounted investees reserve movements (4) (1) NIL 2.5 Income and expense recognised directly in equity (556) (189) 122 2.6 Profit/(loss) for the period (before value return) (1) 294 26 2.7 Total recognised income and expense for the period (557) 105 148 ENTITIES OVER WHICH CONTROL HAS BEEN GAINED 3 There have been no material entities acquired during the period. ENTITIES OVER WHICH CONTROL HAS BEEN DISPOSED OF 4 There have been no material entities disposed of during the period. REPORTS FOR INDUSTRY SEGMENTS 5 Refer to Attachment 1 January 2009 Page 2 of 5
  • 4. Consolidated Balance Sheet Appendix 1 (Rule 10.4) At end of At end of previous At end of previous Preliminary Half Year Report Current Full Year Half Year $NZ millions $NZ millions Half Year 6 CONSOLIDATED BALANCE SHEET $NZ millions 6.1 CURRENT ASSETS (a) Cash and cash equivalents* 751 681 974 (b) Trade and other receivables 2,581 2,216 2,452 (c) Inventories 5,095 3,288 4,037 (d) Taxation receivable 51 31 49 (e) Derivative financial instruments 538 183 520 (f) Other current assets 54 58 92 TOTAL CURRENT ASSETS 9,070 6,457 8,124 6.2 NON-CURRENT ASSETS (a) Property, plant and equipment 4,446 4,292 4,291 (b) Equity accounted investments 629 592 666 (c) Intangible assets 2,847 2,680 2,491 (d) Deferred tax asset 183 139 39 (e) Derivative financial instruments 596 103 329 (f) Other non-current assets 189 176 164 TOTAL NON-CURRENT ASSETS 8,890 7,982 7,980 6.3 TOTAL ASSETS 17,960 14,439 16,104 6.4 CURRENT LIABILITIES (a) Bank overdraft* 79 67 17 (b) Borrowings* 1,890 2,016 2,391 (c) Trade and other payables 1,324 1,271 1,168 (d) Owing to suppliers 1,806 1,069 2,726 (e) Taxation payable 42 55 60 (f) Derivative financial instruments 2,103 348 115 (g) Provisions 129 233 102 (h) Other current liabilities 14 12 8 TOTAL CURRENT LIABILITIES 7,387 5,071 6,587 6.5 NON-CURRENT LIABILITIES (a) Borrowings* 6,209 4,502 3,580 (b) Capital notes* 35 35 35 (c) Derivative financial instruments 386 155 258 (d) Provisions 77 64 45 (e) Deferred tax liability 41 288 547 (f) Other non-current liabilities 35 55 56 TOTAL NON-CURRENT LIABILITIES 6,783 5,099 4,521 6.6 TOTAL LIABILITIES 14,170 10,170 11,108 6.7 EQUITY (a) Co-operative shares 4,392 4,297 4,769 (b) Retained earnings 14 18 (166) (c) Foreign currency translation reserve 165 (1) (54) (d) Cash flow hedge reserve (825) (88) 291 TOTAL EQUITY ATTRIBUTABLE TO SHAREHOLDER SUPPLIERS 3,746 4,226 4,840 6.8 44 43 156 MINORITY INTERESTS 6.9 TOTAL EQUITY 6.10 3,790 4,269 4,996 6.11 TOTAL LIABILITIES AND EQUITY 17,960 14,439 16,104 6.12 OTHER INFORMATION (a) Debt to Equity Ratio (%) (Total Liabilities divided by Equity) 373.88% 238.23% 222.34% (b) Total number of co-operative shares (millions) 1,217 1,200 1,261 1.89 1.51 1.61 (c) Net tangible assets per security N/A N/A N/A (d) Earnings per security * Refer to Attachment 2 for detailed note on Loans and Borrowings Where a change in the presentational format of the financial statements has been made during the period, comparative figures have been restated accordingly January 2009 Page 3 of 5
  • 5. Consolidated Cash Flow Appendix 1 (Rule 10.4) Statement Preliminary Half Year Report Current Corresponding Half Year Half Year 7 CASH FLOWS RELATING TO OPERATING ACTIVITIES $NZ millions $NZ millions 7.1 CASH FLOWS FROM OPERATING ACTIVITIES (a) Cash inflows 8,922 7,001 (b) Cash outflows (8,811) (6,183) NET CASH FLOWS FROM OPERATING ACTIVITIES 111 818 7.2 CASH FLOWS FROM INVESTING ACTIVITIES (a) Cash inflows 95 19 (b) Cash outflows (554) (286) NET CASH FLOWS FROM INVESTING ACTIVITIES (459) (267) 7.3 CASH FLOWS FROM FINANCING ACTIVITIES (a) Cash inflows 2,458 3,471 (b) Cash outflows (2,117) (3,180) NET CASH FLOWS FROM FINANCINF ACTIVITIES 341 291 7.4 NET INCREASE IN CASH AND CASH EQUIVALENTS (7) 842 (a) Cash and cash equivalents at the beginning of the period 614 115 (b) Effect of exchange rate changes on cash balances 65 NIL CASH AND CASH EQUIVALENTS AT THE END OF THE PERIOD 672 957 7.5 RECONCILIATION OF CLOSING BANK BALANCE TO THE BALANCE SHEET (a) Cash and cash equivalents 751 974 (b) Bank overdraft (79) (17) CLOSING CASH BALANCES 672 957 7.6 RECONCILIATION OF PROFIT/(LOSS) FOR THE PERIOD TO NET CASH FLOWS FROM OPERATING ACTIVITIES PROFIT/(LOSS) FOR THE PERIOD (1) 26 ADJUSTMENT FOR NON-CASH ITEMS (a) Depreciation / amortisation 234 231 (b) Other non-cash items (291) (97) (c) Movements in working capital (113) 141 (d) Items classified as investing and financing activities 282 517 NET CASH FLOWS FROM OPERATING ACTIVITIES 111 818 8 NON-CASH FINANCING AND INVESTING ACTIVITIES Provide details of financing and investing transactions which have had a material effect on group assets and and liabilities but did not involve cash flows: There were no material non cash financing and investing transactions for the Group for the six months ended 31 January 2009 January 2009 Page 4 of 5
  • 6. EQUITY ACCOUNTED INVESTMENTS IN ASSOCIATES 9 Appendix 1 (Rule 10.4) Preliminary Half Year Report MATERIAL INTERESTS IN CORPORATIONS NOT BEING SUBSIDIARIES (a) The Group has a material (from Group's viewpoint) interest in the following corporations: Percentage of ordinary Contribution to net shares held at end of surplus (deficit) Name Half Year after tax Previous Previous Equity Accounted Current Corresponding Current Corresponding Associates Half Year Half Year Half Year Half Year $NZ millions $NZ millions Equity Accounted in current year DairiConcepts Management, LLC 50.0% 50.0% AFF P/S 25.0% 25.0% Dairy Industries (Jamaica) Ltd 50.0% 50.0% Corporation Inlaca C.A. 25.0% 25.0% Earnings Earnings DPA Manufacturing Holdings Ltd 50.0% 50.0% $69 $72 Dairy Partners Americas Brasil Limitada 50.0% 50.0% Impairment Impairment Dairy Partners Americas Argentina S.A. 50.0% 50.0% ($62) ($3) Dairy Partners Americas del Ecuador S.A. 50.0% 50.0% Net Contribution Net Contribution DMV Fonterra Excipients GmBH & Co KG 50.0% 50.0% $7 $69 Britannia New Zealand Foods PVTE Limited 49.0% 49.0% Shijiazhuang San Lu Group Company Limited 43.0% 43.0% RD1 Limited 50.0% 50.0% (b) In August 2008, Fonterra became aware that certain milk products manufactured in China had been contaminated. This included products sold by Shijiazhuang San Lu Group Company Limited (quot;San Luquot;), a company in which Fonterra has a 43% interest. As a result of issues associated with the contamination, Fonterra recognised an impairment charge, for the 14 months ended 31 July 2008, of $139 million against the carrying value of the investment in San Lu. The remaining investment in San Lu of NZD 62 million has been written down to zero in the six month period ended 31 January 2009. OTHER INFORMATION 10 If no report in any section, state NIL. If insufficient space below, provide details in the form of notes to be attached to this report. (a) Material factors affecting the revenues and expenses of the Group for the current half year Refer to Attachment 3 (b) Significant trends or events since end of current half year On 10 March 2009 Fonterra Co-operative Group Limited issued $800 million of six year unsecured fixed rate bonds. There were no other material events subsequent to 31 January 2009 that would materially impact these financial statements. (c) Management's discussion and analysis of financial condition, result and/or operations Refer to attachment 3 (d) Significant Accounting Policies Fonterra Co-operative Group Limited (“Fonterra” or the “Company”) is a co-operative company incorporated and domiciled in New Zealand. Fonterra is registered under the Companies Act 1993, and the Co-operative Companies Act 1996, and is an issuer for the purpose of the Financial Reporting Act. The consolidated interim financial statements of Fonterra, as at and for the six months ended 31 January 2009, comprise Fonterra and its subsidiaries (together referred to as the “Group”) and the Group’s equity accounted investees. The consolidated interim financial statements comply with New Zealand Generally Accepted Accounting Practice (“NZ GAAP”) and have been prepared in accordance with New Zealand Equivalent to International Accounting Standard (“NZ IAS”) 34: Interim Financial Reporting. The consolidated interim financial statements also comply with International International Accounting Standard (“IAS”) 34: Interim Financial Reporting. The consolidated interim financial statements should be read in conjunction with the financial statements for the 14 months ended 31 July 2008. The accounting policies used are consistent with those used to prepare the financial statements for the 14 months ended 31 July 2008 and the half year report for the six months ended 30 November 2007. There have been no changes in accounting policy during the interim period. Due to the seasonal nature of Fonterra’s business, the final Milk Price can only be calculated at the end of the financial year. For the purpose of the consolidated interim financial statements it is assumed that 100% of profit attributable to shareholder suppliers for the six months to 31 January 2009 will be paid out as Payout to shareholder suppliers. At year end the Payout to shareholder suppliers is based on the amount declared by the Directors. The consolidated interim financial statements are presented in New Zealand dollars (“$”), which is the Company’s functional and presentation currency, and rounded to the nearest million. The Group is primarily involved in the collection, manufacture and sale of milk and milk derived products and is a profit oriented entity. January 2009 Page 5 of 5
  • 7. Attachment 1 Fonterra Co-operative Group Limited For the six months ended 31 January 2009 5) SEGMENT REPORTING The Group has four reportable segments that are defined by product type and geographic area to reflect how the Group’s operations are managed. The Commodities & Ingredients segment includes the manufacturing business in New Zealand together with the integrated offshore supply chain, manufacturing operations and specialty ingredients business. Commodities & Ingredients generates its revenue primarily from ingredient milk products. All other reportable segments generate their revenue primarily from consumer products and exclude any part of the Group’s operations that is included within Commodities & Ingredients. Transactions between segments are based on estimated market prices. Reportable segment Description Commodities & Includes New Zealand Milk Supply, New Zealand Ingredients Manufacturing, Sales and Operations Planning, Global Trade, Global Supply Chain, Fonterra Ingredients and Specialty Ingredients operations in North Asia, North America and Europe (including equity accounted investments), and Corporate. ANZ Represents operations in New Zealand (other than those included in Commodities & Ingredients) and Australia (including Milk Supply and Manufacturing). Asia / AME Represents operations and equity accounted investments in Asia (excluding North Asia), Africa and the Middle East. Latam Represents operations and equity accounted investments in South America. Commodities & ANZ Asia / Latam Eliminations Total $ million Ingredients AME Group Segment revenue and assets For the six months ended and as at 31 January 2009 (unaudited) External revenue 4,965 1,504 1,208 358 - 8,035 923 461 40 37 (1,461) - Inter-segment revenue 5,888 1,965 1,248 395 (1,461) 8,035 Total revenue 12,121 3,876 1,629 1,020 (686) 17,960 Total assets For the six months ended and as at 30 November 2007 (unaudited) External revenue 4,880 1,345 788 321 - 7,334 767 236 24 23 (1,050) - Inter-segment revenue 5,647 1,581 812 344 (1,050) 7,334 Total revenue 11,217 3,610 1,382 674 (779) 16,104 Total assets i
  • 8. Attachment 1 Fonterra Co-operative Group Limited For the six months ended 31 January 2009 Segment reporting (continued) Commodities ANZ Asia / Latam Eliminations Total $ million & AME Group Ingredients Segment revenue and assets For the 14 months ended and as at 31 July 2008 (audited) External revenue 13,517 3,302 1,904 789 - 19,512 2,009 696 84 53 (2,842) - Inter-segment revenue 15,526 3,998 1,988 842 (2,842) 19,512 Total revenue 9,061 3,737 1,374 892 (625) 14,439 Total assets To complete segmental profit analysis for the Group, it is necessary to calculate Milk Price. Due to the seasonal nature of Fonterra’s business, the final Milk Price can only be calculated at the end of the financial year. Accordingly, segmental profit analysis is not prepared for the half year reporting periods, and is only presented for the 14 months ended 31 July 2008. Commodities ANZ Asia / Latam Eliminations Total $ million & AME Group Ingredients Segment profit For the 14 months ended and as at 31 July 2008 (audited) Segment operating profit before depreciation, amortisation and non- recurring items 824 266 96 119 (36) 1,269 Depreciation (362) (75) (8) (20) - (465) Amortisation (78) (1) (1) (1) - (81) Share of royalty income 2 1 - 17 - 20 Non-recurring items (156) 12 (1) - - (145) Segment profit before finance costs, equity accounted income and tax 230 203 86 115 (36) 598 Share of profit of equity accounted investees 137 - 7 14 - 158 Impairment of equity - - (142) - - (142) accounted investees Segment profit before finance costs and tax 367 203 (49) 129 (36) 614 Unallocated finance income 76 Unallocated finance costs (443) Unallocated tax income 47 Profit for the period (before Value Return) 294 ii
  • 9. Attachment 2 Fonterra Co-operative Group Limited For the six months ended 31 January 2009 6) LOANS AND BORROWINGS 6 months to 14 months to 6 months to 30 Nov 2007 31 July 2008 31 Jan 2009 Unaudited Audited $ million Unaudited 5,160 5,160 Balance at beginning of period 6,553 New issues 58 627 Loans drawn 898 - - New finance leases 22 2,061 4,958 Commercial paper issued 729 - 445 Medium term notes issued 668 2,119 6,030 2,317 Repayments (525) (916) Bank lending (17) (17) (126) Finance leasing (23) (804) (4,129) Commercial paper matured (1,776) (3) (10) Medium term notes matured (57) (1,349) (5,181) (1,873) Other movements 15 105 Amortisation of debt 37 41 34 Changes in fair value 168 20 405 Changes due to foreign exchange 932 76 544 1,137 6,006 6,553 Balance at end of period 8,134 Represented by: Current borrowings 2,391 2,016 1,890 Non-current borrowings 3,580 4,502 6,209 Capital notes 35 35 35 6,006 6,553 8,134 Net interest bearing debt position Total borrowings 6,006 6,553 8,134 Cash and cash equivalents (974) (681) (751) Long term interest bearing advances (79) (79) (102) Bank overdraft 17 67 79 Net interest bearing debt 4,970 5,860 7,360 Less carrying value of derivatives used to manage foreign exchange movements on debt 212 70 (561) Net interest bearing debt after deducting derivatives used to manage foreign exchange movements on debt 5,182 5,930 6,799 The following table explains the impact of other movements in loans and borrowings on the income statement: Total non-cash movement in loans and borrowings 76 544 1,137 Less amount recognised directly in FCTR 8 (141) (281) Less amount offset by derivatives used to manage foreign exchange movements on debt (69) (298) (782) Net pre-tax impact on profit or loss 15 105 74 The amount recognised directly in FCTR relates to translation of subsidiary debt and debt that has been designated as net investment hedges. The amount offset by the derivatives used to manage foreign exchange movements on debt relates to both realised and unrealised derivative contracts held throughout the period. The unrealised portion only remains on balance sheet as at reporting date. Any realised portion will be offset as a repayment of borrowings during the period. i
  • 10. Attachment 3 Fonterra Co-operative Group Limited For the six months ended 31 January 2009 10a/c) Media Release i
  • 11. Media Release 24 March 2009 FONTERRA ANNOUNCES SOLID HALF YEAR FINANCIAL RESULT Financial performance driven by seasonal factors, stronger contribution from regional consumer businesses and the lower Kiwi dollar Payout forecast for season unchanged at $5.10 per kgMS Fonterra Co-operative Group announced today its financial results for the six months to January 31, 2009. Because of a change to the annual balance date last year, the result is affected by seasonal factors. The latest half year covers the period August 2008 to January 2009 and includes two additional high production months (December and January), distorting comparisons with the previous half year which went from June 2007 to November 2007. Highlights of the half-year result include: • Revenue was up 9.6% to $8.0 billion. The higher revenue was driven by the inclusion of two high sales months due to the change in balance date, stronger contributions from Fonterra’s regional consumer businesses, and the lower Kiwi dollar - offset by lower global dairy prices. - Commodities & Ingredients revenue up 2% to $5.0 billion. - Australia/New Zealand revenue up 12% to $1.5 billion. - Asia/Africa Middle East revenue up 53% to $1.2 billion. - Latin America revenue up 12% to $358 million. Adjusting for timing factors and including exchange hedging, total revenues would have been down by 7.6%, reflecting the lower international dairy commodity prices. • Operating expenses as reported were up 13%. Adjusting for seasonal and currency factors, operating expenses would have been down by 2%. • Debt gearing at January 31, 2009 was 61.5%, compared with 57.4% at July 31, 2008. The increase primarily reflects: - The cost of carrying higher inventories over the season’s peak; - The devaluation of the New Zealand dollar which resulted in foreign currency debt increasing when converted to NZD. Although the Group has an offsetting hedge on the foreign debt, this hedge is recognised in the accounts as an asset and not as a reduction in debt; - And the higher-than-usual advance rate percentage Fonterra has been paying farmer-shareholders this season, which resulted in more than $700 million extra in payments to farmers over and above the normal payment schedule. • Debt gearing is expected to reduce to more normal levels by year-end as working capital requirements ease due to the normal seasonal cycle and with other initiatives such as a freeze on non-essential capital expenditure. Additionally, the requirement announced last October that farmers must bring their shareholdings fully in line with this season’s milk production is expected to bring in around $400 million of additional equity by the end of the financial year offsetting forecast share redemptions. • By paying back short term loans and taking out longer term borrowings, average debt maturity has increased, putting the Co-operative in a stronger position to face uncertain times in financial markets. As at January 31, the weighted average length of borrowings was 4.1 years - up from 3.3 years at July 31, 2008. As at March 31, Fonterra’s successful retail bond issue in New Zealand has extended the company’s average maturity to 4.7 years. • The payout forecast for the 2008/09 season is unchanged from the revised forecast of $5.10 per kilogram of milksolids (kgMS) announced in late January. This would be Fonterra’s third highest payout. Chairman Henry van der Heyden said the interim result was satisfactory given the global economic meltdown and its impact on dairy markets. “Despite this climate, our payout is still forecast to be $5.10, and our result shows Fonterra to be in reasonable shape given the turmoil in the world economy - it’s a tough time for everyone and Fonterra is no exception. We have taken, and will continue to take, the tough decisions to manage the business prudently in the current climate and get our farmers the highest payout.” - ENDS - For further information contact: Fonterra Communications
  • 12. Phone: +64 21 507 072 About Fonterra Fonterra is the world’s largest dairy exporter, with annual revenues of about NZ$17 billion*. As New Zealand’s largest and truly multinational business, Fonterra trades in 140 countries. Our portfolio includes dairy ingredients, liquid and powdered milks, cultured foods and yoghurts, butter, cheese and specialty foodservices products. Our brands include Anchor, Anlene, Anmum, Fresh n’ Fruity, Mainland, Peters, Brownes, Tip Top, and Chesdale. * Fonterra reported revenues of NZ$19.5 billion for 14 months ended 31 July 2008. If this material is not relevant to your purpose, you may wish to prevent further deliveries via email. To opt-out, please click this link.